


Our Verdict
Introduction, Drive Specifications, Pricing and Availability
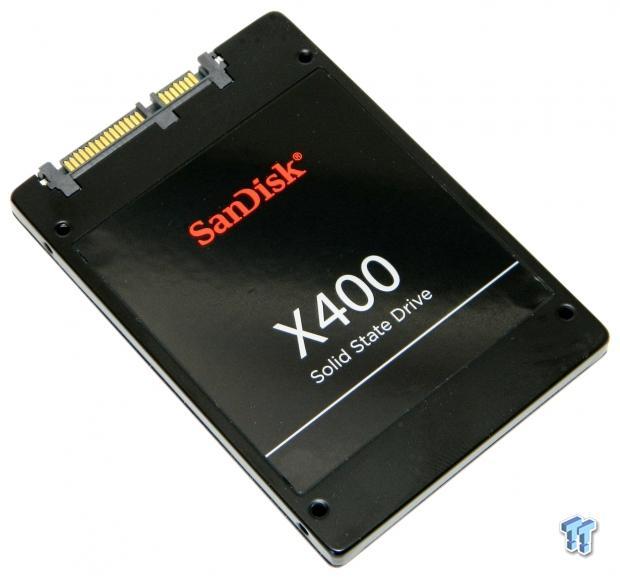
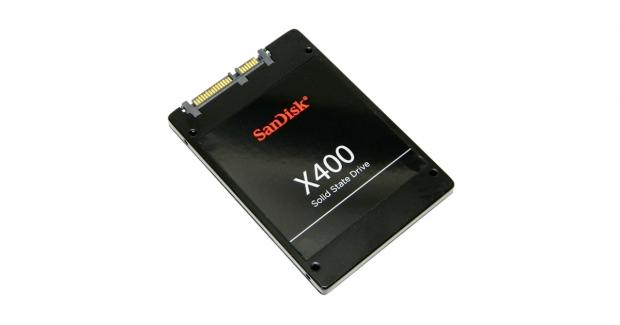
The X400 is Sandisk's tier-one client SATA SSD. The X400 is available in two form factors: M.2 2280 and a standard 2.5"x7mm cased design. Both form factors carry identical performance specifications. The 1TB M.2 X400 is advertised as the world's thinnest 1TB M.2 solution. At only 1.5mm thin, the M.2 version is designed primarily for OEM's looking for the thinnest possible SSDs for use in ultrabooks and high-performance tablets. The 2.5"x7mm version is designed as a drop-in replacement for mechanical HDDs. Both form factors are available in self-encrypting drive (SED) versions that support TCG Opal 2.0 thus maximizing interoperability with a wide spectrum of security software platforms.
The X400 pairs Marvell's TLC (Triple-Level-Cell or 3-bit per cell) specific 88SS1074 four-channel controller with Sandisk's own 15nm toggle mode planar flash. Marvell's 28nm-based 88SS1074 is loaded with features, the most important being LDPC (Low-Density Parity-check Code) error correcting code (ECC). LDPC greatly magnifies the endurance of TLC flash. In comparison to Sandisk's previous generation client TLC SSD, the X300, the X400 sports an endurance rating or TBW (Total Bytes Written) that is 300% greater; taking planar TLC from roughly 500 P/E cycles to an impressive 2000 P/E cycles. Sandisk combines their proprietary nCache 2.0 and DataGuard technologies with LDPC to produce their highest ever endurance for a client SSD. Sandisk is so confident in the planar-based TLC X400's endurance and reliability that they back the drive with a class-leading five-year warranty.
Sandisk's X400 1TB SATA III SSD has a lot going for it. World's thinnest 1TB M.2 SSD, nCache2.0, SED, DataGuard, a five-year warranty, and one of the lowest price points we've seen to date. The only thing left to determine is how well it performs. In choosing our test pool, we factored in pricing and TLC flash. Samsung's 850 EVO 1TB costs roughly one hundred dollars more than Sandisk's 1TB X400, so even though the EVO is a TLC flash-based product and the better performing SSD, we feel it is not going to be in direct competition with the X400, which is why we will not be comparing the two. We comprised our test pool of competing low-cost planar TLC solutions, albeit most are half the capacity of the X400 we are testing today; the cost per GB is similar.
Specifications
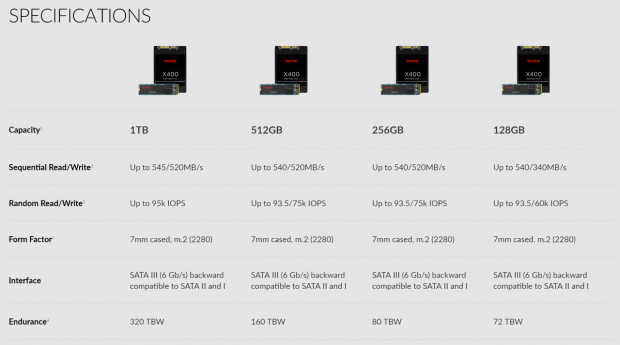
Sandisk's X400 SATA III SSD is available in four capacities: 128GB, 256GB, 512GB, and 1TB. The 1TB 7mm x 2.5" cased model we have on the bench has the following factory specifications:
Sequential Read: up to 545 MB/s. Sequential Write: up to 520 MB/s. Max 4K Random Read/Write: up to 95,000/75,000 IOPS at QD32. TBW checks in at 320TB, MTBF up to 1.75 million hours. Power consumption: 70mW active, Max Read 2.85W, Max Write 4.4W, Slumber 45-52mW, DEVSLP 6-9.7mW.
Sandisk backs the 1TB X400 for five years or 320 terabytes written, whichever comes first.
Drive Details
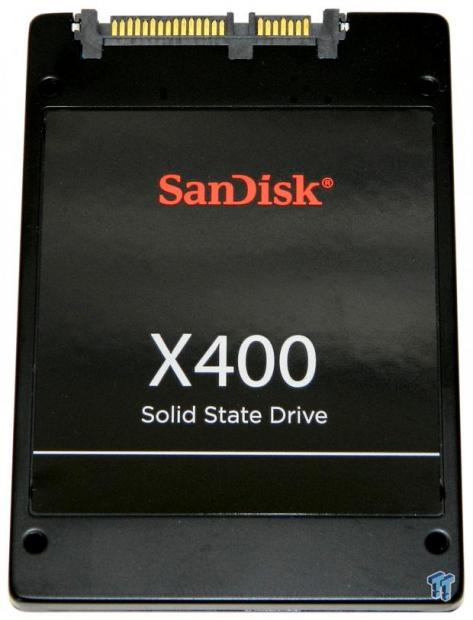
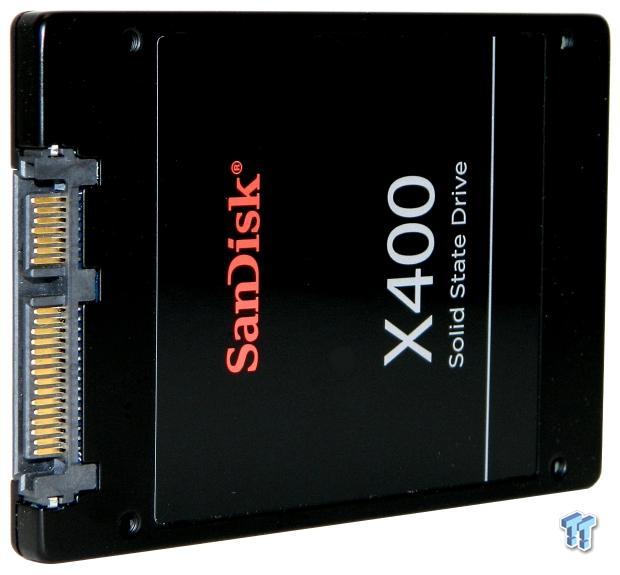
Sandisk X400 1TB SATA III SSD
The bottom of the drive's all-black enclosure is formed from sheet aluminum. A basic looking manufacturer's label covers most of this side of the enclosure as well as the four screws that hold the enclosure together.
Our Latest SSD Review Coverage
- Biwin M560 2TB SSD Review - Best Overall Retail-Ready DRAMless SSD
- Samsung 990 2TB SSD Review - Ninth Gen QLC at PCIe Gen4 Speeds
- Phison E37T SSD Controller Exclusive Preview - The Fastest DRAMless SSD Platform Yet
- Seagate FireCuda X1070 4TB SSD Review - A New Mainstream Contender
- Micron 3610 2TB SSD Review - DRAMless QLC at 11,000 MB/s

The back half of the drive's enclosure is formed from plastic and features a manufacturer's label listing the particulars of the drive.
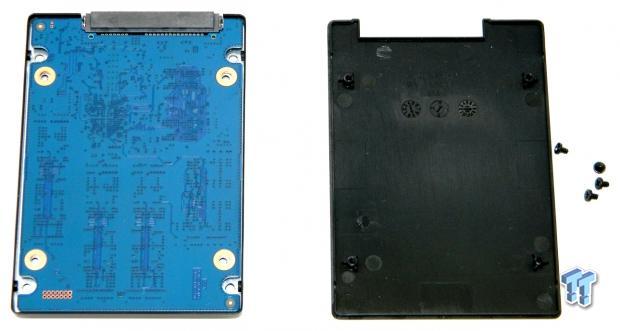
Cracking the enclosure open reveals the blank half of the drive's blue PCB.
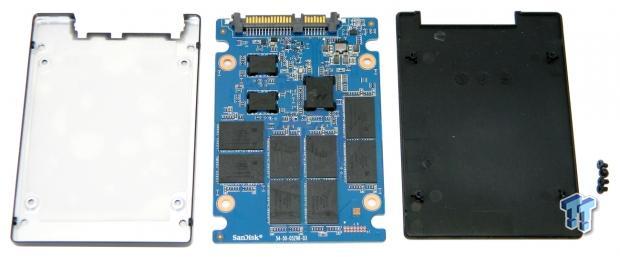
Pulling the PCB shows that all the of the drive's major components make contact with a thermal sheet that is affixed to the aluminum half of the enclosure.
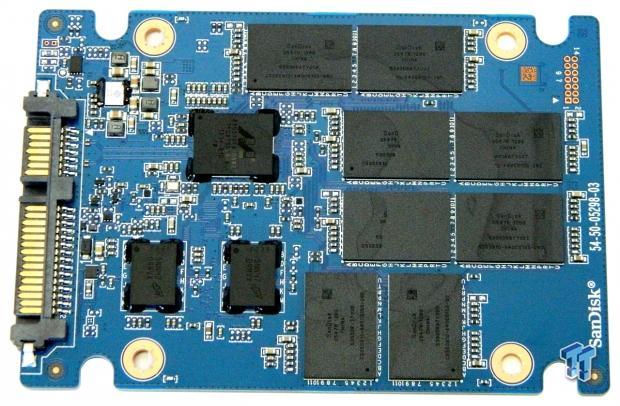
All of the components are located on this half of the drive's PCB.
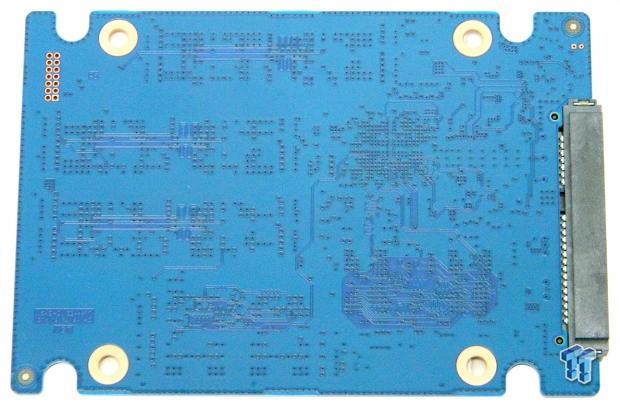
This half of the PCB is devoid of components.
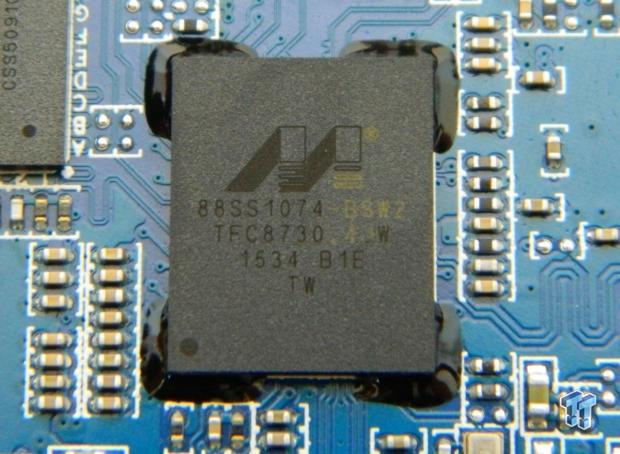
A detailed view of the Marvell 4-channel 88SS1074 controller that powers the X400.

A detailed view of one of the eight Sandisk 64GB 15nm BGA flash packages that populate the PCB.
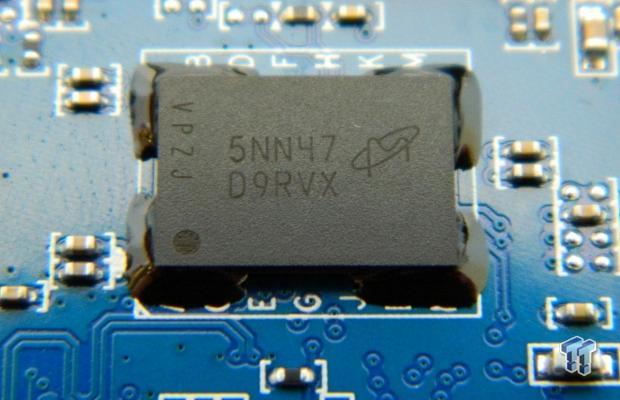
A detailed view of one of the drive's two Micron 512MB DDR3 1600MHz BGA DRAM cache packages.
Test System Setup and Properties
Jon's Consumer SSD Review Test System Specifications
- Motherboard: ASRock Extreme9 Z97 - Buy from Amazon
- CPU: Intel Core i7 4790K @ 4.8GHz - Buy from Amazon / Read our review
- Cooler: Swiftech H2O-320 Edge - Buy from Amazon / Read our review
- Memory: Corsair Dominator DDR3 32GB 2400MHz - Buy from Amazon
- Video Card: Onboard Video
- Case: IN WIN X-Frame - Buy from Amazon / Read our review
- Power Supply: Seasonic Platinum 1000 Watt Modular - Buy from Amazon / Read our review
- OS: Microsoft Windows 10 Professional 64-bit - Buy from Amazon
- Drivers: Intel RAID option ROM version 13.0.0.2075 and Intel RST driver version 13.6.0.1002
We would like to thank ASRock, Crucial, Intel, Corsair, RamCity, IN WIN, and Seasonic for making our test system possible.
Drive Properties
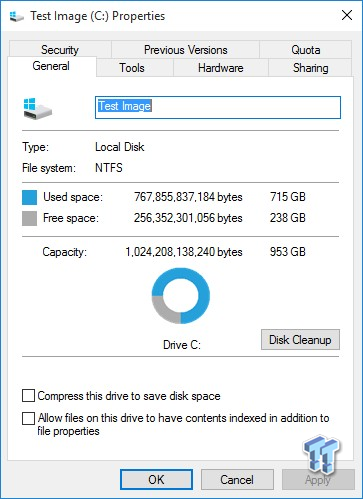
The majority of our testing is performed with our test drive as our boot volume. Our boot volume is 75% full for all OS Disk "C" drive testing to replicate a typical consumer OS volume implementation. We feel that most of you will be utilizing your SSDs for your boot volume and that presenting you with results from an OS volume is more relevant than presenting you with empty secondary volume results.
System settings: Cstates and Speed stepping are both disabled in our systems BIOS. Windows High-Performance power plan is enabled. Windows write caching is enabled, and Windows buffer flushing is disabled. We are utilizing Windows 10 Pro 64-bit OS for all of our testing except for our MOP (Maxed-Out Performance) benchmarks where we switch to Windows Server 2008 R2 64-bit.
Synthetic Benchmarks – ATTO & Anvil Storage Utilities
ATTO
Version and / or Patch Used: 2.47
ATTO is a timeless benchmark used to provide manufacturers with data used for marketing storage products.
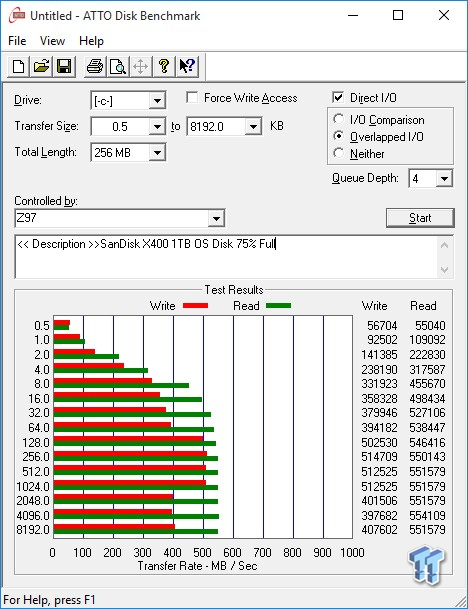
Compressible sequential read/write transfers max out at 554/514 MB/s. Keep in mind this is our OS volume, and it is filled to 75% of its total capacity. Maximum sequential read performance is achieved at a 4MB transfer size, maximum sequential write performance at 256KB transfers.
Sequential Write
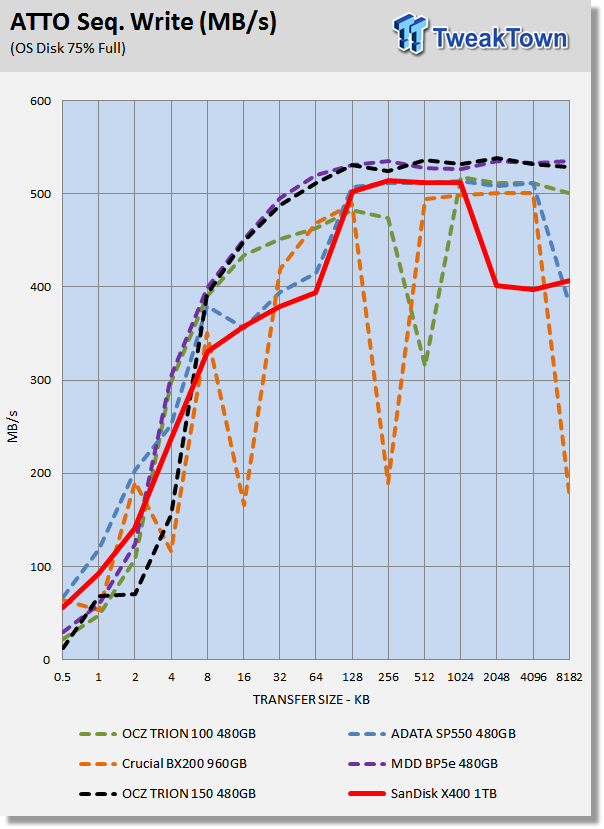
The choppy write performance with data on our OS disk is typical of many of today's TLC-based SSDs.
Sequential Read
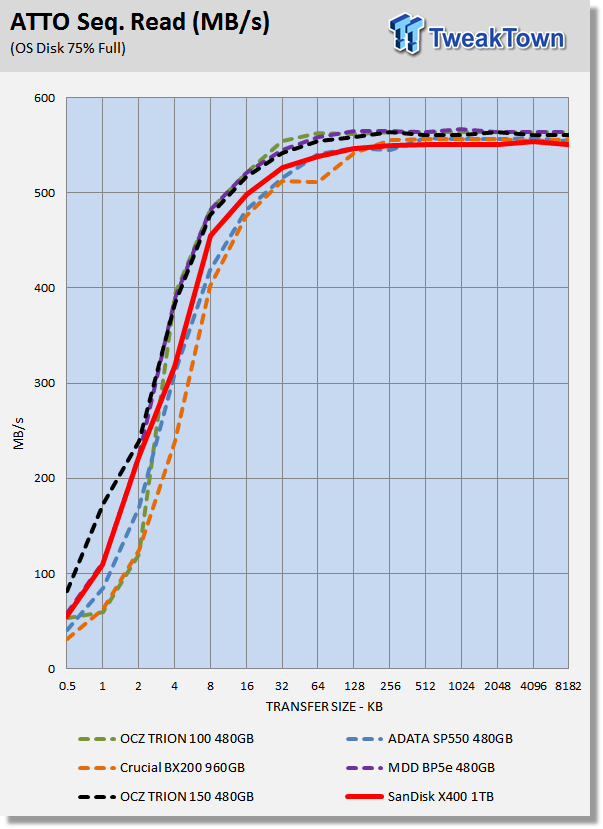
Read performance displays a nice performance curve, with stout small file performance.
Anvil Storage Utilities
Version and / or Patch Used: 1.1.0
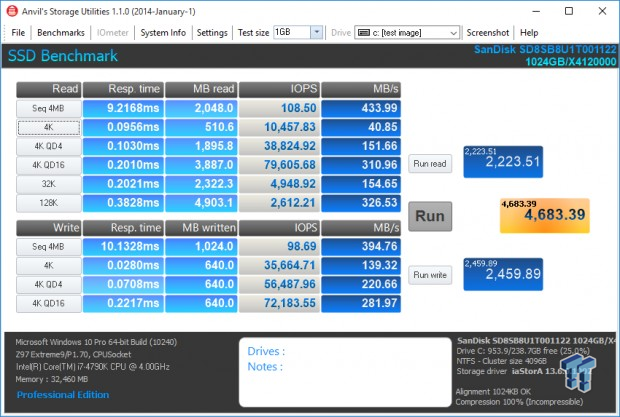
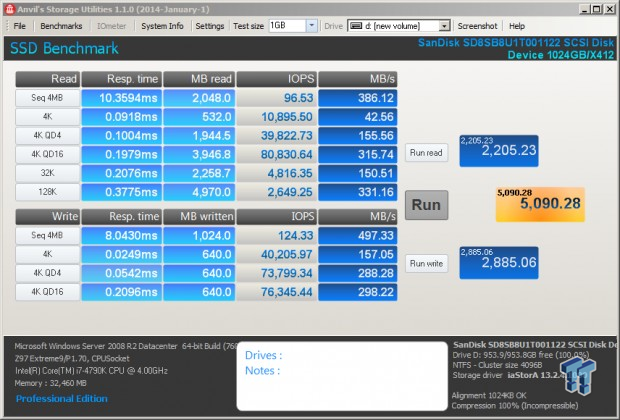
Anvil's Storage Utilities is a storage benchmark designed to measure the storage performance of SSDs. The Standard Storage Benchmark performs a series of tests; you can run a full test or just the read or write test, or you can run a single test, i.e. 4k QD16.
Scoring
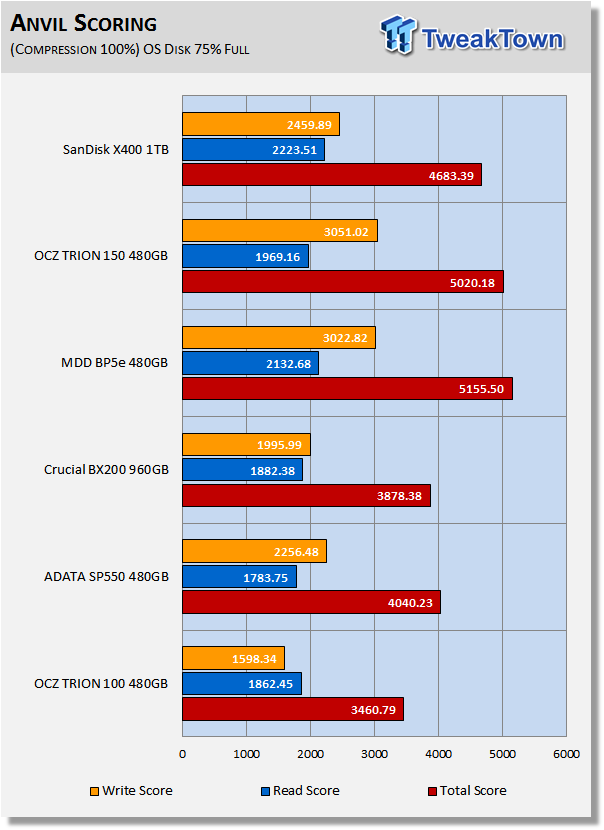
Anvil's scoring gives a good indication of a drive's overall performance. The X400 returns a good overall score, third best of the drives in our test pool. The X400 displays the best read performance due in part to its excellent 4K QD1 IOPS of well over 10K. 10,000 IOPS at 4K QD1 is a very good indicator that the X400 will deliver good moderate workload performance.
(Anvil) Read IOPS through Queue Depth Scale
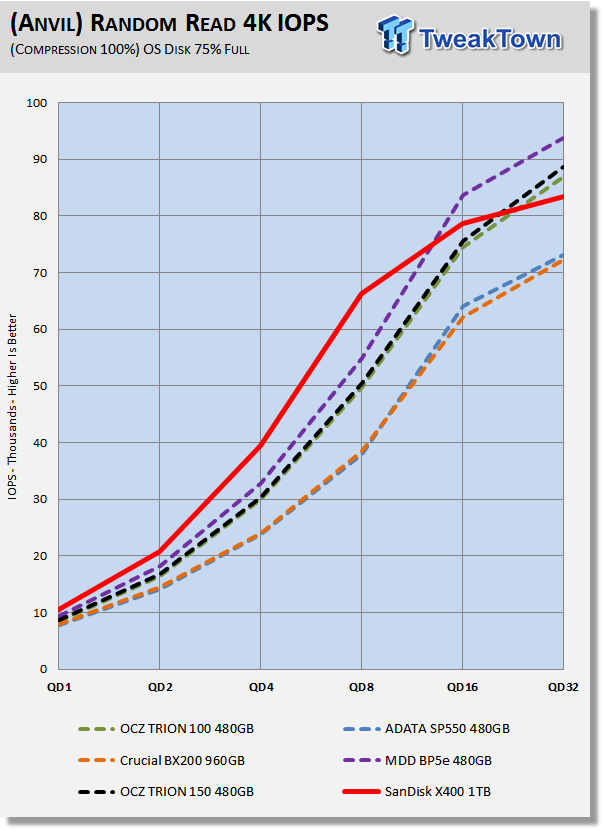
The X400 smokes the rest of the field at QD1-8.
(Anvil) Write IOPS through Queue Scale
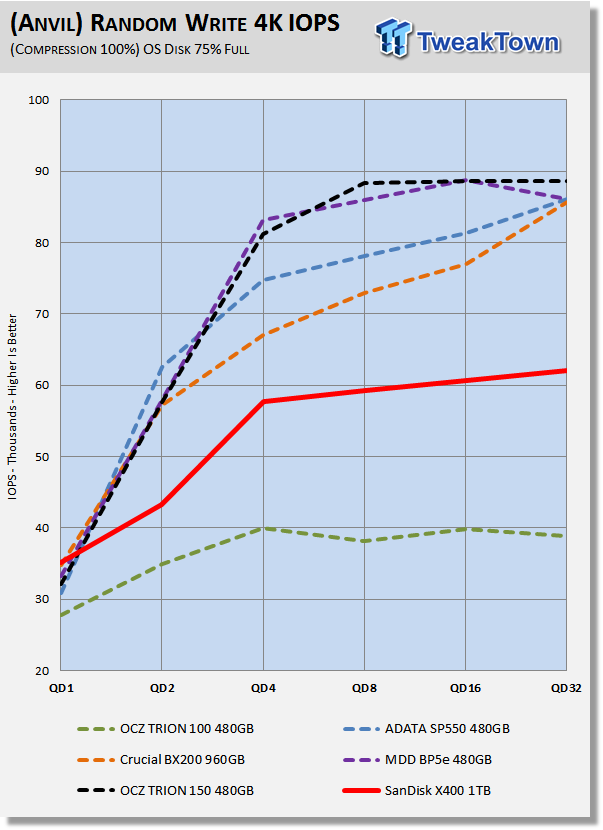
QD1 performance is the most important metric, and the X400 delivers the goods at 4K QD1. However, all but the TRION 100 deliver higher write performance than the X400 at QD2-32.
Synthetic Benchmarks – CrystalDiskMark & AS SSD
CrystalDiskMark
Version and / or Patch Used: 3.0 Technical Preview
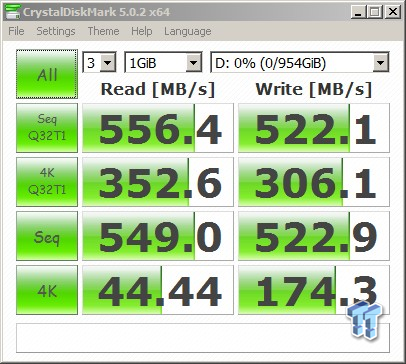
CrystalDiskMark is disk benchmark software that allows us to benchmark 4k and 4k queue depths with accuracy. Note: Crystal Disk Mark 3.0 Technical Preview was used for these tests since it offers the ability to measure native command queuing at QD4.


The X400 wins this test hands down. The X400 delivers vastly superior 4K random read performance, especially where it counts most; QD1.
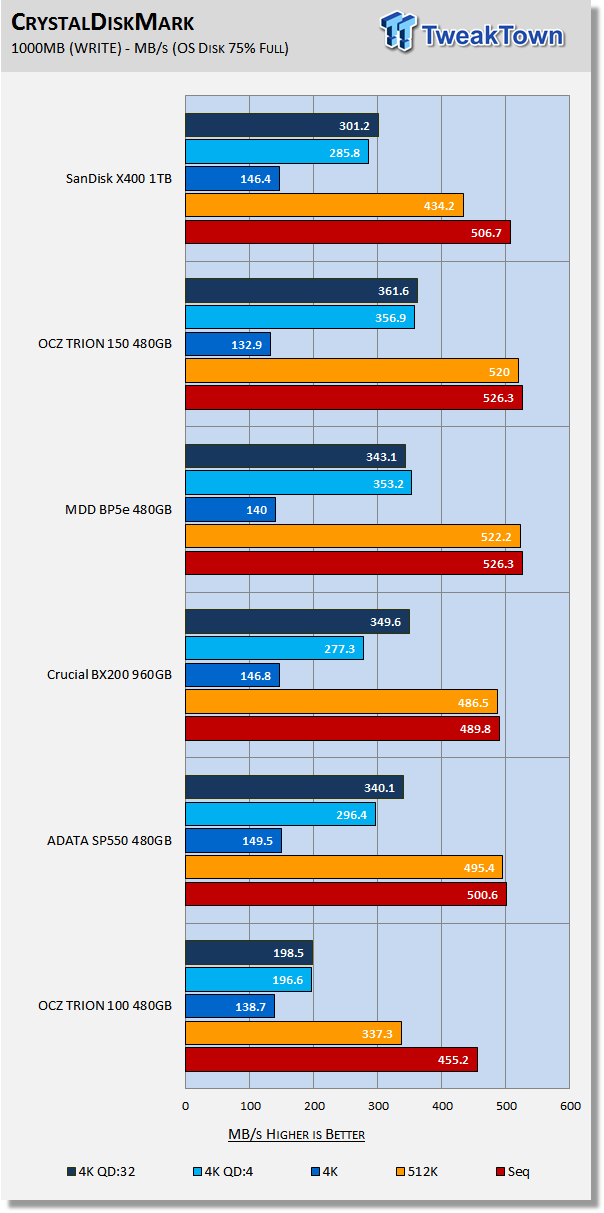
The X400 delivers the third best sequential and 4K QD1 write performance.
AS SSD
Version and / or Patch Used: 1.7.4739.38088
AS SSD determines the performance of SSDs. The tool contains four synthetic as well as three practice tests. The synthetic tests are to determine the sequential and random read and write performance of the SSD.

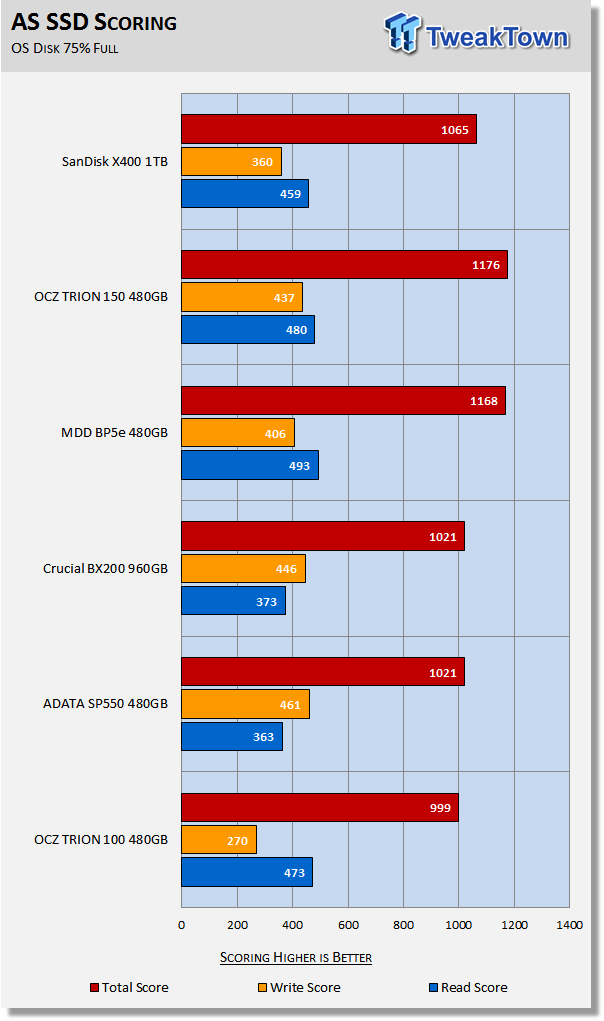
AS SSD is a demanding test, and the X400 manages a third place finish, losing to the S10-powered TRION 150 and BP5e. We expect to see the X400 make a big comeback with our moderate workload testing, which we consider to be much more important than synthetic performance.
Benchmarks (Trace-Based OS Volume) - PCMark Vantage, PCMark 7 & PCMark 8
Moderate Workload Model
We categorize these tests as indicative of a moderate workload environment.
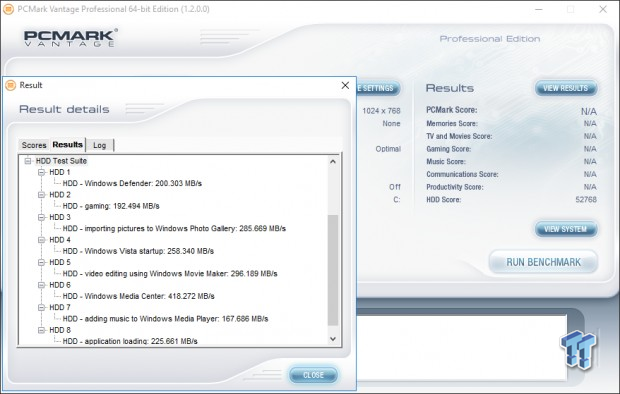
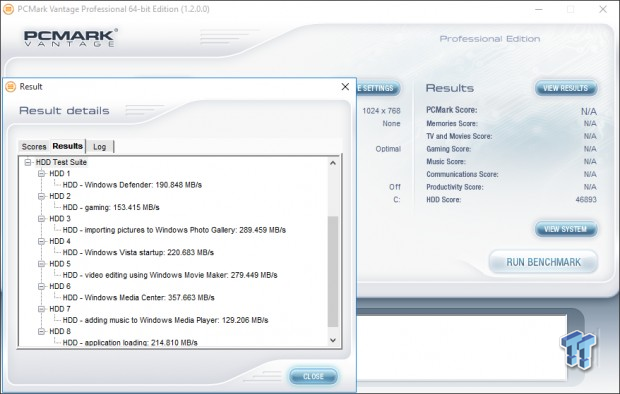
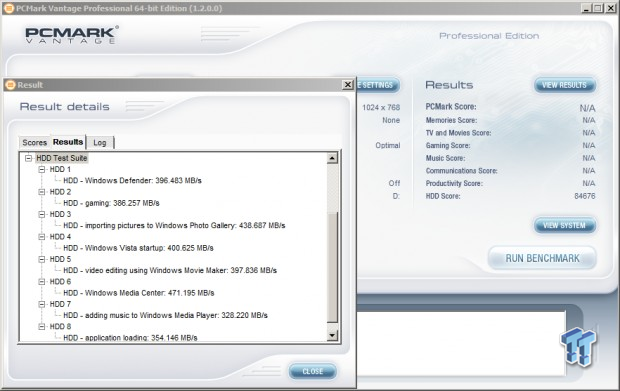
PCMark Vantage - Hard Disk Tests
Version and / or Patch Used: 1.2.0.0
The reason we like PCMark Vantage is because the recorded traces are played back without system stops. What we see is the raw performance of the drive. This allows us to see a marked difference between scoring that other trace-based benchmarks do not exhibit. An example of a marked difference in scoring on the same drive would be empty vs. filled vs. steady state.
We run Vantage three ways. The first run is with the OS drive 75% full to simulate a lightly used OS volume filled with data to an amount we feel is common for most users. The second run is with the OS volume written into a "Steady State" utilizing SNIA's guidelines. Steady state testing simulates a drive's performance similar to that of a drive that been subjected to consumer workloads for extensive amounts of time. The third run is a Vantage HDD test with the test drive attached as an empty, lightly used secondary device.
OS Volume 75% Full - Lightly Used
OS Volume 75% Full - Steady State
Secondary Volume Empty - FOB
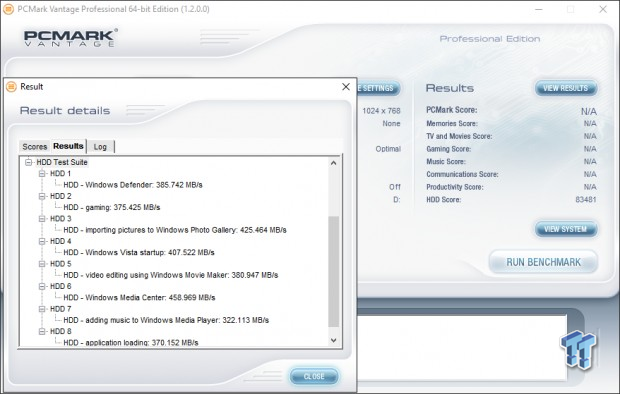
There's a big difference between an empty drive, one that's 75% full/used, and one that's in a steady state.
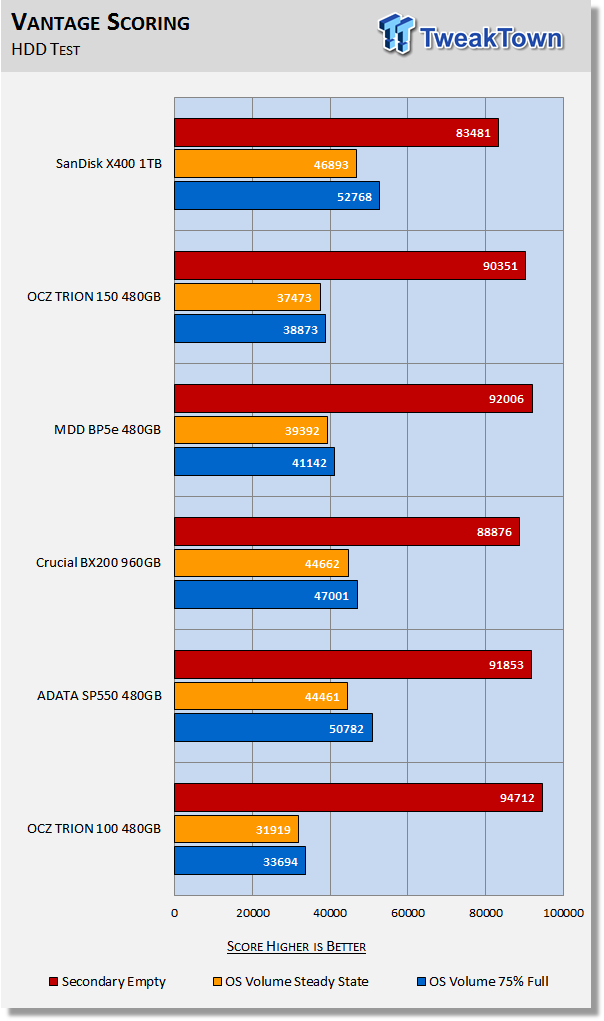
The important scores to pay attention to are "OS Volume Steady State" and "OS Volume 75% full." These two categories are most important because they are indicative of typical of consumer user states. When a drive is in a steady state, it means garbage collection is running at the same time it's reading/writing. This is exactly why we focus on steady state performance.
As expected, the X400 wins this test. This is what we want to see, steady-state performance that is a cut above. The X400 is delivering moderate workload performance that rivals that of many MLC-based SSDs.
PCMark 7 - System Storage
Version and / or Patch Used: 1.4.0
We will look to Raw System Storage scoring for evaluation because it's done without system stops and, therefore, allows us to see significant scoring differences between drives.
OS Volume 75% Full - Lightly Used
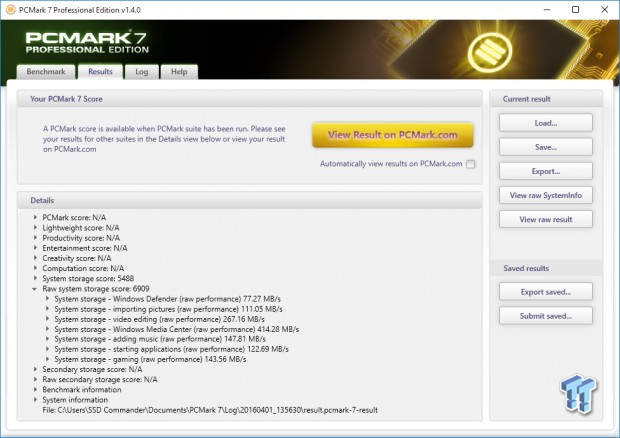
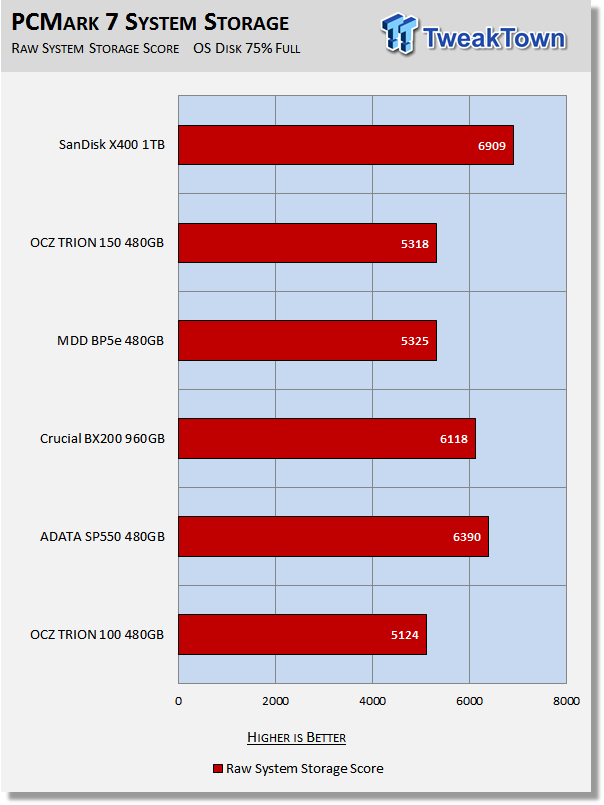
Reinforcing what we saw with Vantage, the X400 dominates the rest of the drives in our test pool. It's rather rare to see a planar-based TLC SSD deliver moderate workload performance this good.
PCMark 8 - Storage Bandwidth
Version and / or Patch Used: 2.4.304
We use PCMark 8 Storage benchmark to test the performance of SSDs, HDDs, and hybrid drives with traces recorded from Adobe Creative Suite, Microsoft Office, and a selection of popular games. You can test the system drive or any other recognized storage device, including local external drives. Unlike synthetic storage tests, the PCMark 8 Storage benchmark highlights real-world performance differences between storage devices.
OS Volume 75% Full - Lightly Used
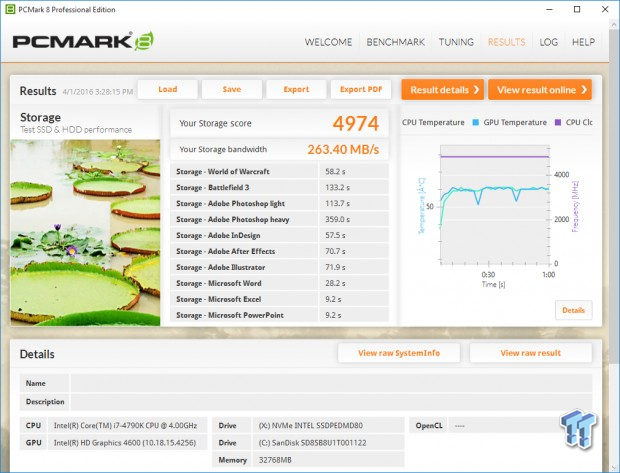
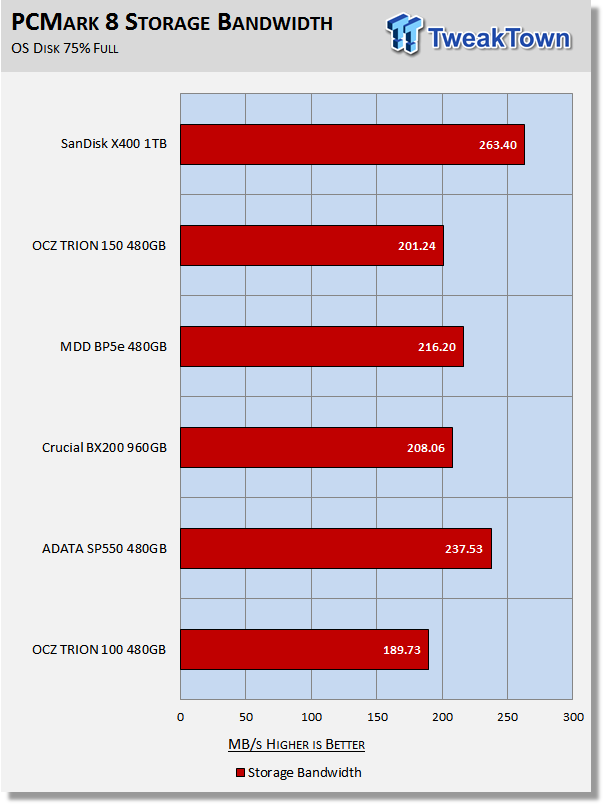
PCMark 8 is the most intensive moderate workload simulation we run. With respect to moderate workloads, this test is what we consider the best indicator of a drive's performance. This result cements the X400 as a moderate workload powerhouse and one of the best performing planar TLC SSDs on the market. The X400 also clearly displays the prowess of Marvel's power sipping 4-channel 88SS1074 flash processor.
Benchmarks (Secondary Volume) – Max IOPS, Disk Response & Transfer Rates
Iometer – Maximum IOPS
Version and / or Patch Used: Iometer 2014
We use Iometer to measure high queue depth performance. (No Partition)
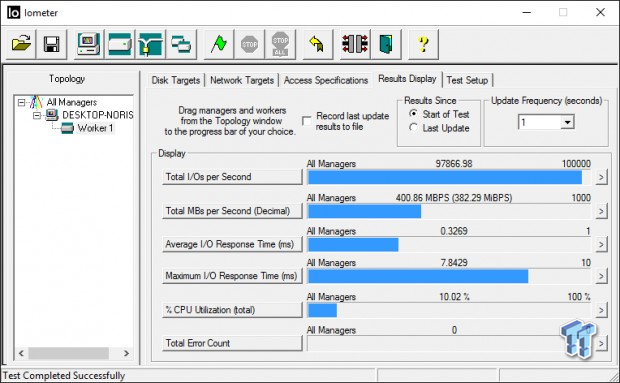
Max IOPS Read
Max IOPS Write
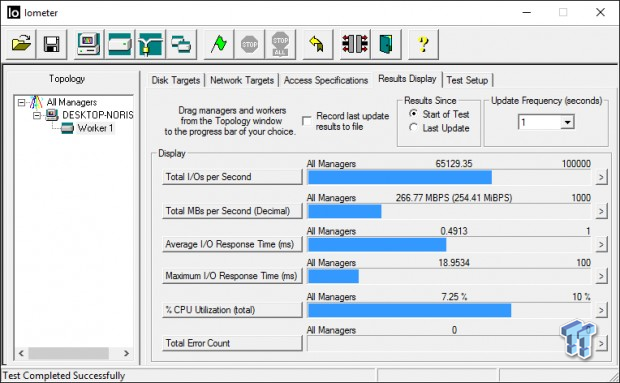
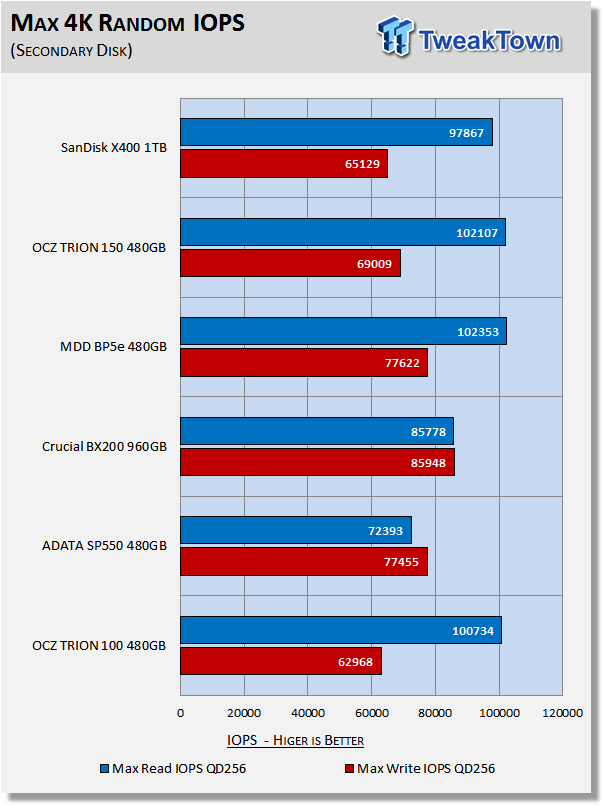
With our configuration, we are able to exceed Sandisk's 95K maximum read IOPS specification. We are not able to achieve Sandisk's 75K maximum write IOPS specification, falling short by roughly 10K IOPS. We are not sure how Sandisk arrived at their 75K 4K random write specification. However, we are very certain that they did not run their test for a full 30 seconds, which apparently exceeds the drive's nCache 2.0 capacity.
Iometer – Disk Response
Version and / or Patch Used: Iometer 2014
We use Iometer to measure disk response times. Disk response times are measured at an industry accepted standard of 4K QD1 for both write and read. Each test runs twice for 30 seconds consecutively, with a 5-second ramp-up before each test. We partition the drive/array as a secondary device for this testing.
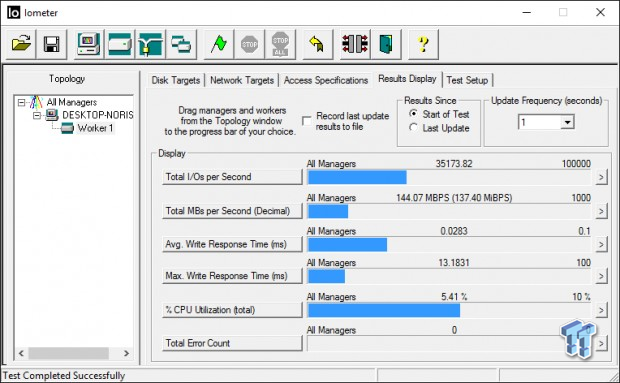
Avg. Write Response
Avg. Read Response
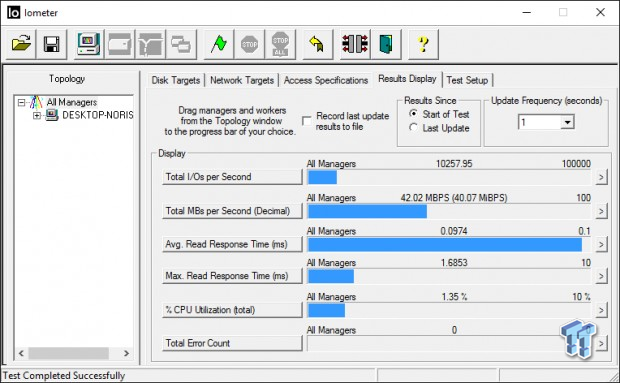
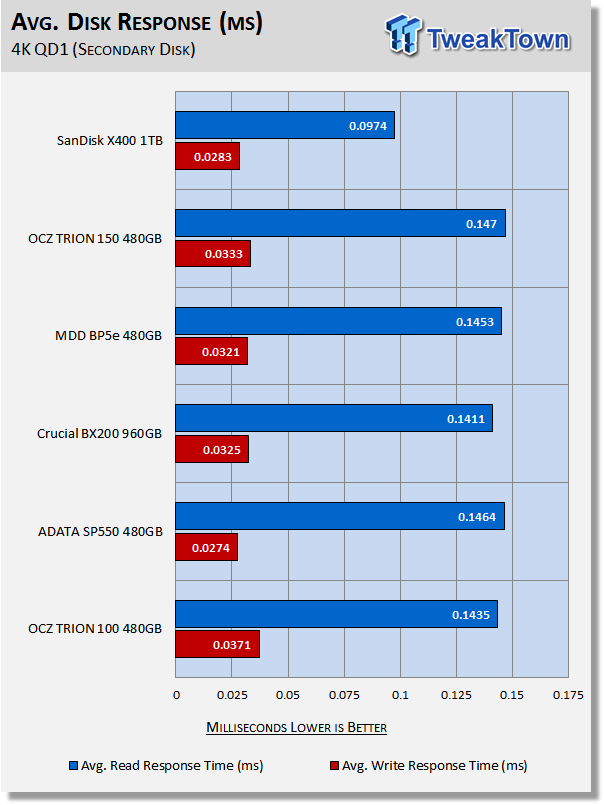
With a read response of well under 0.1ms or 42MB/s (10K IOPS) at 4K QD1, the X400 smashes the competing drives in our test pool. The X400 gets edged out of first by the SP550 in write response.
DiskBench - Directory Copy
Version and / or Patch Used: 2.6.2.0
We use DiskBench to time a 28.6GB block (9,882 files in 1,247 folders) composed primarily of incompressible sequential and random data as it's transferred from our DC P3700 PCIe NVME SSD to our test drive. We then read from a 6GB zip file that's part of our 28.6GB data block to determine the test drive's read transfer rate. Our system is restarted prior to the read test to clear any cached data, ensuring an accurate test result.
Write Transfer Rate

Read Transfer Rate
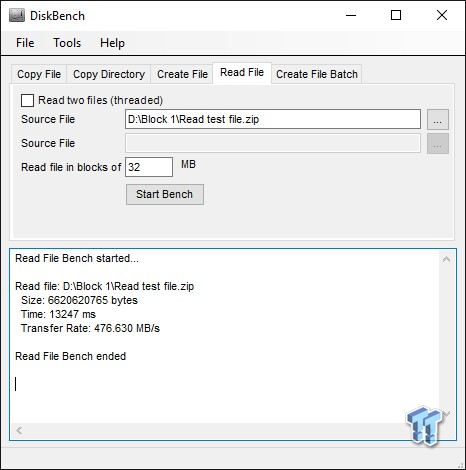
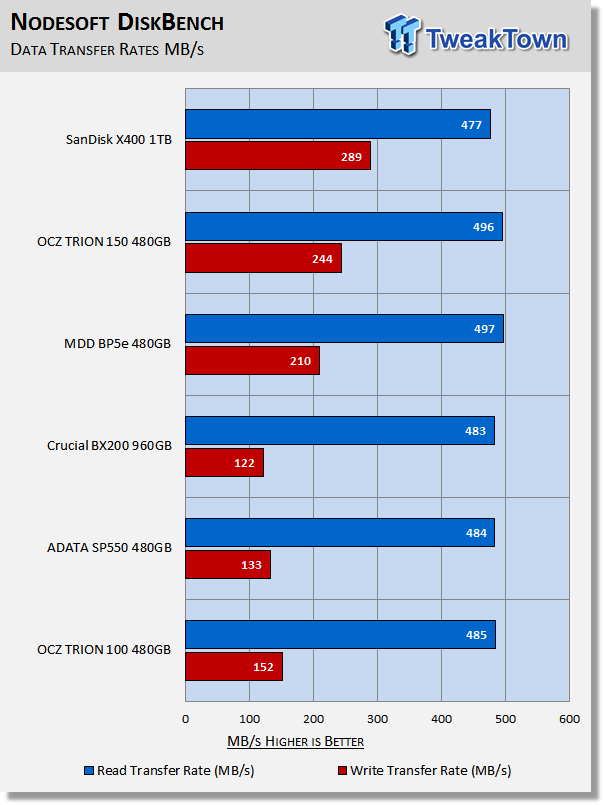
The main drawback to planar-based TLC SSDs is sustained write performance. We see it getting better as time goes on. The X400 is able to best the competing SSDs in our test pool by a significant margin. Marvell's 88SS1074 and 15nm Sandisk TLC flash is proving to be a potent combination.
Benchmarks (Secondary Volume) – PCMark 8 Extended
Futuremark PCMark 8 Extended
Heavy Workload Model
PCMark 8's consistency test simulates an extended duration heavy workload environment. PCMark 8 has built-in, command line executed storage testing. The PCMark 8 Consistency test measures the performance consistency and the degradation tendency of a storage system.
The Storage test workloads are repeated. Between each repetition, the storage system is bombarded with a usage that causes degraded drive performance. In the first part of the test, the cycle continues until a steady degraded level of performance has been reached. (Steady State)
In the second part, the recovery of the system is tested by allowing the system to idle and measuring the performance after 5-minute long intervals. (Internal drive maintenance: Garbage Collection (GC)) The test reports the performance level at the start, the degraded steady-state, and the recovered state, as well as the number of iterations required to reach the degraded state and the recovered state.
We feel Futuremark's Consistency Test is the best test ever devised to show the true performance of solid state storage in an extended duration heavy workload environment. This test takes on average 13 to 17 hours to complete and writes somewhere between 450GB and 14,000GB of test data depending on the drive. If you want to know what an SSDs steady state performance is going to look like during a heavy workload, this test will show you.
Here's a breakdown of Futuremark's Consistency Test:
Precondition phase:
1. Write to the drive sequentially through up to the reported capacity with random data.
2. Write the drive through a second time (to take care of overprovisioning).
Degradation phase:
1. Run writes of random size between 8*512 and 2048*512 bytes on random offsets for 10 minutes.
2. Run performance test (one pass only).
3. Repeat 1 and 2 for 8 times, and on each pass increase the duration of random writes by 5 minutes.
Steady state phase:
1. Run writes of random size between 8*512 and 2048*512 bytes on random offsets for 50 minutes.
2. Run performance test (one pass only).
3. Repeat 1 and 2 for 5 times.
Recovery phase:
1. Idle for 5 minutes.
2. Run performance test (one pass only).
3. Repeat 1 and 2 for 5 times.
Storage Bandwidth
PCMark 8's Consistency test provides a ton of data output that we use to judge a drive's performance.
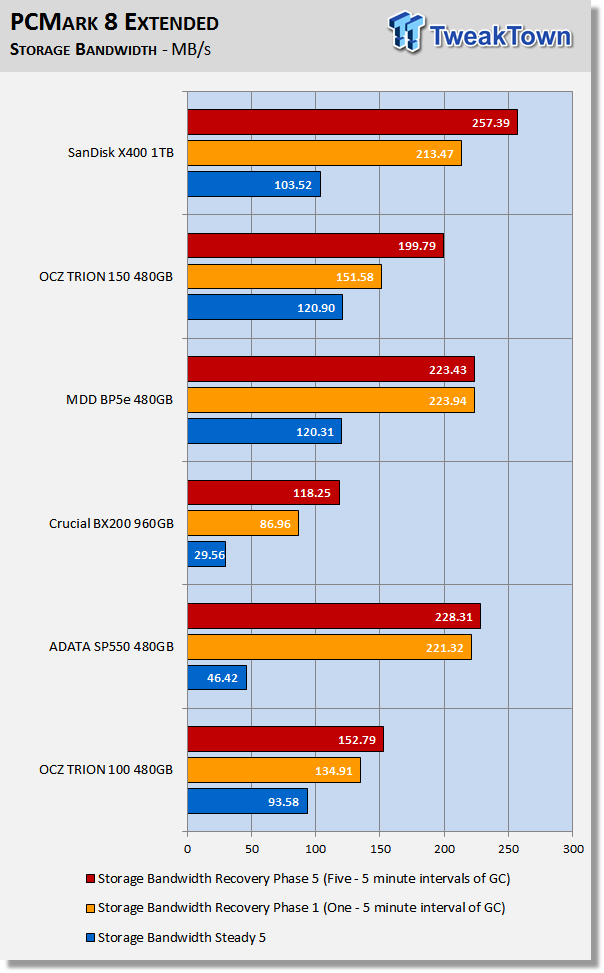
We consider steady state bandwidth (the blue bar) our test that carries the most weight in ranking a drive/arrays heavy workload performance. Performance after Garbage Collection (GC) (the orange and red bars) is what we consider the second most important consideration when ranking a drive's performance. Trace-based steady state testing is where true high performing SSDs are separated from the rest of the pack.
OCZ's TRION 150 delivers the best steady-state performance of the SSDs in our test pool. The X400 outperforms the competing SSDs after five 5-minute rounds of GC by a significant margin. The X400 does not have the advantage of OP like the rest of the drives in our test pool do. If we were to OP the X400 even a tiny bit, it would easily win this test.
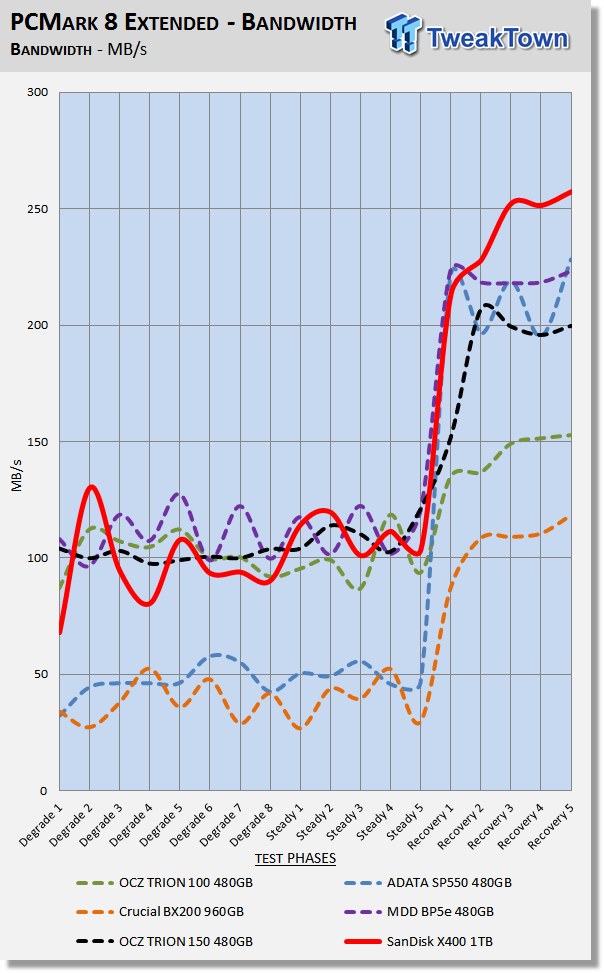
We chart our test subject's storage bandwidth as reported at each of the test's 18 trace iterations. This gives us a good visual perspective of how our test subjects perform as testing progresses. This chart sheds more light on how the drives perform as they progress through the testing phases.
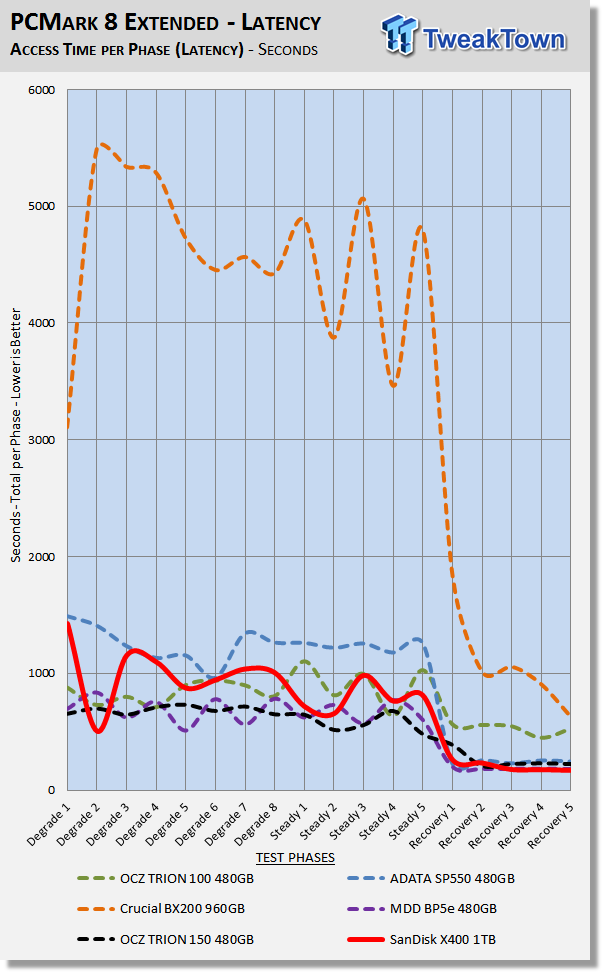
Total Access Time (Latency)
We chart the total time the disk is accessed as reported at each of the test's 18 trace iterations. Low latency translates to the real-world as snappiness.
Disk Busy Time
Disk Busy Time is how long the disk is busy working. We chart the total time the disk is working as reported at each of the tests 18 trace iterations.
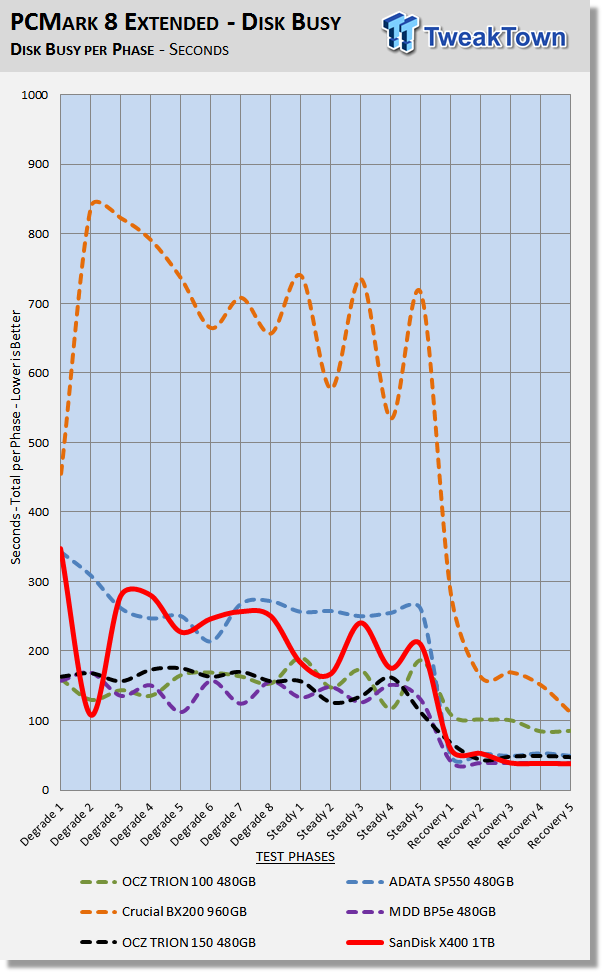
When latency is low, disk busy time is low as well.
Data Written
We measure the total amount of random data that our test drive/array is capable of writing during the degradation phases of the consistency test. Pre-conditioning data is not included in the total. The total combined time that degradation data is written to the drive/array is 470 minutes. This can be very telling. The better a drive/array can process a continuous stream of random data; the more data will be written.
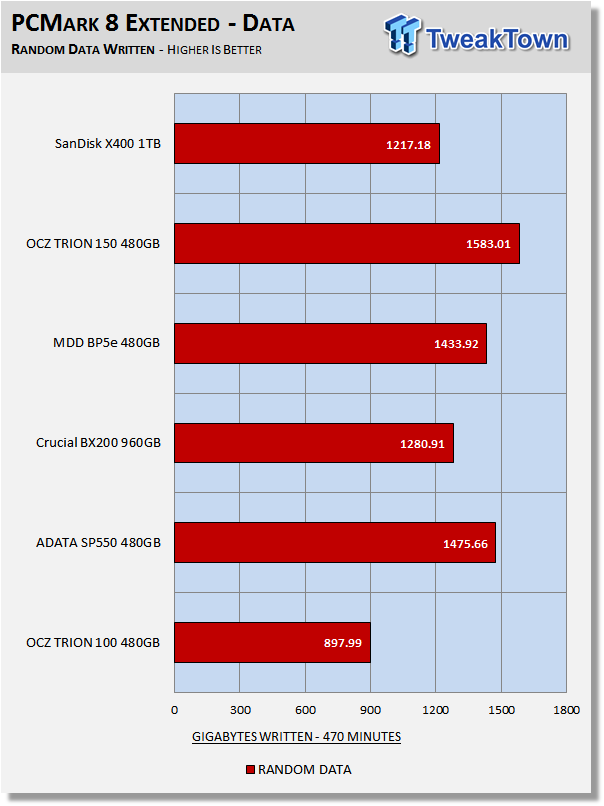
Write latency, and overprovisioning are the biggest factors that determine the outcome of this portion of the test. With zero overprovisioning, the X400 is at a disadvantage in this particular test.
Benchmarks (Secondary Volume) – 70/30 Mixed Workload
70/30 Mixed Workload Test (Sledgehammer)
Version and / or Patch Used: Iometer 2014
Heavy Workload Model
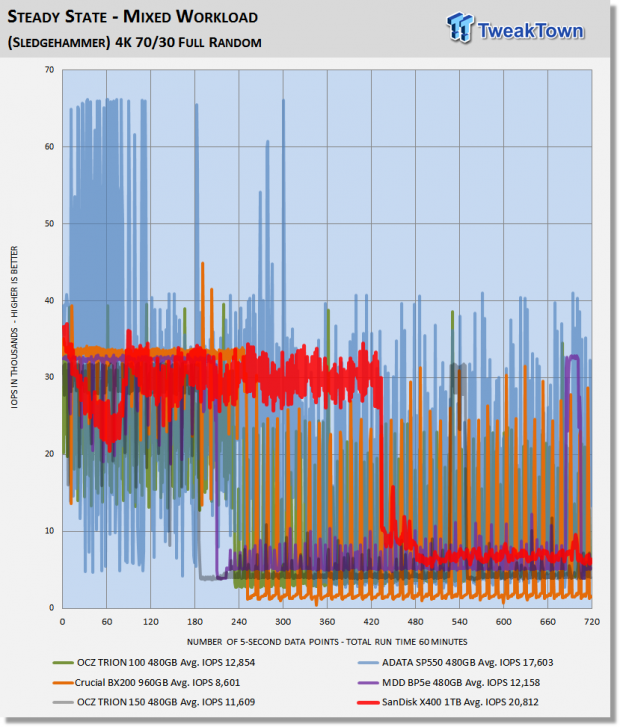
This test hammers a drive so hard we've dubbed it "Sledgehammer". Our 70/30 Mixed Workload test is designed to simulate a heavy-duty enthusiast/workstation steady-state environment. We feel that a mix of 70% read/30% write, full random 4K transfers best represents this type of user environment. Our test allows us to see the drive enter into and reach a steady state as the test progresses.
Phase one of the test preconditions the drive for 1 hour with 128K sequential writes. Phase two of the test runs a 70% read/30% write, full random 4K transfer workload on the drive for 1 hour. We log and chart (phase two) IOPS data at 5-second intervals for 1 hour (720 data points). 60 data points = 5 minutes.
What we like about this test is that it reflects reality. Everything lines up, as it should. Consumer drives don't outperform Enterprise-Class SSDs that were designed for enterprise workloads. Consumer drives based on old technology are not outperforming modern Performance-Class SSDs, etc.
Because of its capacity, the X400 takes longer to drop into a steady state resulting in higher average IOPS than the rest of the SSDs in our test pool. The X400 displays much less variability (tighter pattern) than the competition, which is what we want to see.
Maxed-Out Performance (MOP)
This testing is just to see what the drive is capable of in an FOB (Fresh Out of Box) state under optimal conditions. We are utilizing Windows Server 2008 R2 64-bit for this testing. Same Hardware, just an OS change.
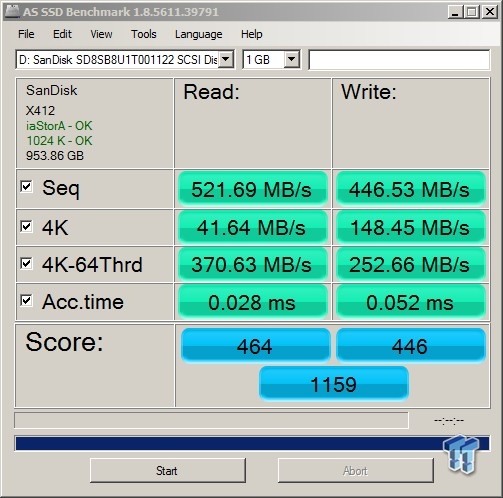
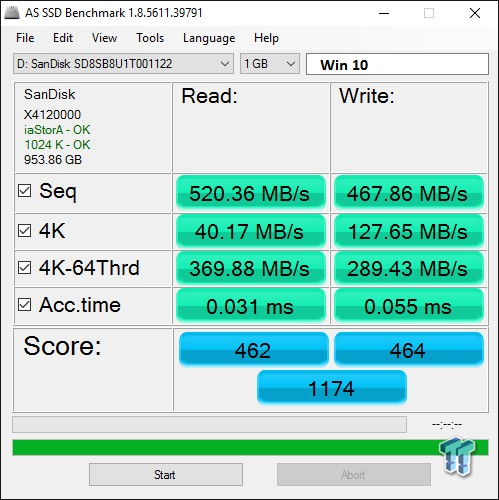
For reasons unknown, the highest AS SSD scores are achieved with Windows 10 and an empty drive.
Final Thoughts
Sandisk's X400 surprised us with its excellent performance. What we like most about the X400 is how it stands out as a top performer when running moderate workloads. We feel that moderate workloads best represent a typical user environment. We attribute the X400's moderate workload prowess directly to its superior 4K random read performance. It's not often that we see a planar TLC-based SSD capable of delivering over 10,000 IOPS at 4K QD1 read.
The X400 is the first SSD we've tested that is powered by Marvell's 4-channel 88SS1074 controller, and we are impressed with the performance it can generate when paired with quality TLC flash. Sandisk's proprietary nCache 2.0 speeds things along while at the same time extending the endurance of the drive's TLC flash array. Additionally, we are impressed by the X400's sustained write transfer performance - in fact, it's tops for a planar TLC-based SSD.
Selling for a scant $220 at Amazon, we are hard pressed to find any SSD that's a better overall value at a 1TB capacity point. ADATA's SP550 960GB can be had for $10-$15 less, but overall its performance is well below that of the X400, its warranty period is only three years, and it is 40GB smaller in capacity. Mushkin's MLC-based Reactor at the 1TB capacity point is currently selling for the same price as Sandisk's X400 1TB, however, the Reactor cannot match the X400's moderate workload performance, endurance, or its five-year warranty.
Running Sandisk's X400 as our OS disk was a pleasurable experience. The drive is responsive, boots like lightning, and handles multi-tasking with ease. Overall, the X400 1TB SATA III SSD delivers a best-in-class SSD experience.
All things considered, Sandisk's X400 1TB SSD in our opinion delivers the best price to performance ratio of any SATA III SSD currently on the market. Sandisk's X400 1TB SATA III is TweakTown recommended.
Pros:
- Low Cost
- Moderate Workload Performance
- Random Read Performance
- Five-Year Warranty
Cons:
- Random Write Performance
- Sequential Write Performance
 Biwin M560 2TB SSD Review - Best Overall Retail-Ready DRAMless SSD
 Samsung 990 2TB SSD Review - Ninth Gen QLC at PCIe Gen4 Speeds
 HighPoint Rocket 1604L Gen5 x16 NVMe Software RAID AIC Review: half the price with full 59 GB/s speed
 UGREEN NASync DXP4800 GT Review: powerful 4-bay NAS with AMD Ryzen and dual 10GbE ports
 Phison E37T SSD Controller Exclusive Preview - The Fastest DRAMless SSD Platform Yet
 Qualcomm is raising chip prices from September 1, and Android phones could get more expensive
 Google's AI patched more Chrome bugs in two releases than it had in two years, including a 13-year-old flaw
 A missing underscore in a Skyrim-inspired username sent an innocent man to prison for 18 months
 Microsoft improves Windows 11 optimization for PCs with 8GB RAM
 Steam Deck LCD battery returns to iFixit, but costs $50 more now
 Redditor scores a working GTX 1050 Ti for just $2 at Goodwill
 Sony has secured enough memory to meet PS5 sales targets through March 2027 and says no further price hikes are planned
 Reddit is building a video and audio listening experience for the viral post format it accidentally created for TikTok
 Seagate says Mozaic 5 50TB hard drives are on track for 2027, with 100TB already on the roadmap
 MSI adds a BIOS toggle to tighten standard DDR5 timings closer to EXPO ULL kits
 Montech TG3 Mid-Tower Chassis Review
 ASUS ROG Strix X870E-A Gaming WiFI7 Neo Review - A New Enticing Option
 Noctua NL-LC1-36 Liquid CPU Cooler Review
 Logitech G316 X 98 Wired Gaming Keyboard Review - Retro-Inspired Board that Falls a Little Short
 Logitech G512 X 98 Analog Mechanical Gaming Keyboard Review - An Innovative Two-in-One
 Thrustmaster T.Flight HOTAS 5 MSFS Edition Review
 SteelSeries Arctis Nova Pro Omni Wireless Headset Review - One Headset to Rule Them All
 SteelSeries Arctis Nova 7 Wireless Gen 2 Headset Review - New and Improved, But Is It Enough?
 AMD Ryzen 7 7700X3D Review - Days of Future Past
 6 Task Manager tips for troubleshooting Windows performance problems
 ASUS ROG's 20th Anniversary Line-up of Premium PC Gaming Gear has Arrived - Here's Everything You Need to Know
 Six File Explorer tips every Windows user should know
 I switched my PC to encrypted DNS in Windows 11, and browsing felt more private
 Printer Not Working in Windows? How to fix detection, print queues and drivers
 The Ultimate Guide to Personalizing Your Windows 11 Taskbar
 How to Turn Your Windows Laptop Into a Second Monitor with Miracast and Wireless Display in Minutes
 6 Mistakes to Avoid When Buying a Windows Laptop
 I capped Windows Update's bandwidth with Delivery Optimization, and my downloads stopped choking
 I use this decade-old free tool that finds files faster than Windows Search does