Introduction and Package
Introduction of the HIS R9 280 IceQ X2 OC 3GB

The other day we had a chance to look at the R9 280 again. This one in particular was from GIGABYTE, and during our review, we found ourselves a lot more enthusiastic about the model than when we first saw it from Sapphire at launch. Overall, the model wasn't bad, but it was let down by one simple thing: the MSRP that AMD had set for the product. Against the likes of the R9 280X 3GB, the price point that AMD had set just seemed ridiculous.
More recently, we saw AMD push the price of the model down, and now they're making a second push on the model, hopeful that initial thoughts on the model can be changed. Our fresh look at the GIGABYTE WINDFORCE OC version of the card really changed our overall thoughts on the model. GIGABYTE had done a great job overclocking the card, and the new price point set for the model is much more attractive.
Now we've got another R9 280 on our hands, with this particular version coming from HIS. Today we're going to take a slightly different approach to the card. Instead of testing it at out of the box clocks, we'll be increase the clock speeds ourselves to see just what kind of performance we're able to get out of the model.
The model already looks a lot better after we reevaluated it with the GIGABYTE version, and we're hoping that HIS helps to keep the trend going with strong overclocking performance. The IceQ X2 series of cards from HIS hasn't let us down yet, and we're hoping it continues to impress us today. So, let's see exactly what's going on with the HIS R9 280 IceQ X2 OC 3GB.
Package - What comes inside the box


Looking at the front of the box, you can see the overall design is very similar to the packaging of other IceQ X2 based cards we've looked at. The HIS logo is featured across the top of the box, along with icons indicating that the card is "Cooler" and "Quieter." The IceQ X2 logo is in the center, while across the bottom we've have the iTurbo information, a look at the cooler, and the model information. We also have some of the main features listed here, which include 3GB GDDR5, and 4K support.
On the rear of the box, HIS goes into some of the features of the cooler, like the cooler's four heat pipes, and the IceQ X2 cooling technology. Below that information, there are some details regarding the power features, including the Dynamic Phase Control PWM IC, the Full Solid-State Capacitors, and the Solid-State Choke. Everything is rounded off with some of the key AMD features that are bought to the table.

Inside of the box, we've got a typical HIS bundle, which includes a Driver CD, an Installation Guide, and a Case Sticker. A DVI to VGA connector is included to round things off.
Video Card Details and Specifications
Close up with the HIS R9 280 IceQ X2 OC 3GB

Looking at the card, you could almost mistake it for any of the more recent high-end R9 Ice Q2 cards from HIS. That large heat sink and fan combination covers almost the entire PCB, and it actually shoots out of the back of the card. The dual fan setup sits on top of a massive heat sink, which includes a four heat pipe setup. This cooler has done extremely well with higher-end models, and we're looking forward to seeing how it does today with our overclocked R9 280.


Moving away from the cooler, and making our way around to the top of the card, you can see that power comes in the form of a single six-pin and eight-pin PCIe power connector. If we stay across the top, and move closer to the front of the card, you can see our two CrossFire connectors, and a switch that lets us move between two installed BIOS'.

To finish up our look at the card, we head over to the I/O, which sees my kind of setup. Along with the Dual-Link DVI-I and HDMI port, you can see that HIS has included two MiniDP connectors. This is great, but we must say it would've been nice to see them include a Mini DP to DP adapter in the bundle, even if that meant the exclusion of the DVI to VGA adapter.
Specifications
As the name of the card suggests, the card is an overclocked model, and out of the box it sees a core clock of 953 MHz. This is slightly higher than the 940MHz clock that Sapphire's OC version had. The 3GB of GDDR5 is left at a stock level of 5000MHz QDR.

When it came to overclocking, the results where a little interesting. In the end, we managed to get the core up to a really strong 1170MHz. However, the memory didn't want to move. Increasing the memory tended to cause hard freezes, or artifacts. While we could've sacrificed some of the core speed to possibly get a bit out of the memory, the decrease in the core clock would've cost more performance than the increase in the memory clock would have given. We're looking forward to seeing how this card performs with this strong core clock.
Test System Setup & FPS Numbers Explained
Test System Setup

We would like to thank the following companies for supplying and supporting us with our test system hardware and equipment: Intel, ASUS, and Corsair.
While we have added a few new benchmarks to our lineup recently, we have been testing a bunch of video cards lately, and they're quickly getting filled up with results. The cards that will be sitting alongside our HIS R9 280 IceQ X2 OC 3GB at 1170MHz on the core include the lower-end HIS R9 270X IceQ X2 Turbo Boost 2GB OC, the GIGABYTE R9 280 WINDFORCE 3GB OC (which saw quite a strong out of the box overclock), and the Sapphire R9 280X 3GB Vapor-X OC.
Moving into the 290 range, we've got the HIS R9 290 4GB IceQ X2 Turbo, and the HIS R9 290X iPower IceQ X2 Turbo 4GB, the latter of which was heavily overclocked to 1100MHz on the core, and 5700MHz QDR on the 4GB of GDDR4. From NVIDIA, we've got the reference GTX 770 2GB, and the ASUS GTX 780 ROG Poseidon Platinum 3GB OC.
The FPS Numbers Explained
When we benchmark our video cards and look at the graphs, we aim to get to a certain level of FPS which we consider playable. While many may argue that the human eye can't see over 24 FPS or 30 FPS, any true gamer will tell you that as we climb higher in Frames Per Second (FPS), the overall gameplay feels smoother. There are three numbers we're looking out for when it comes to our benchmarks:
30 FPS - It's the minimum number we aim for when it comes to games. If you're not dropping below 30 FPS during games, you're going to have a nice and smooth gaming experience. The ideal situation is that even in a heavy fire fight, the minimum stays above 30 FPS, making sure that you can continue to aim easily, or turn the corner with no dramas.
60 FPS - It's the average we look for when we don't have a minimum coming at us. If we're getting an average of 60 FPS, we should have a minimum of 30 FPS or better, and as mentioned above, it means we've got some smooth game play happening.
120 FPS - This is the newest number that we've been hunting down over recent months. If you're the owner of a 120 Hz monitor, to get the most out of it, you want to get around the 120 FPS mark. Moving from 60 FPS / 60 Hz to 120 FPS / 120 Hz brings with it a certain fluidity that can't really be explained, but instead has to be experienced. Of course, if you're buying a 120 Hz monitor to take advantage of 3D, an average of 120 FPS in our benchmark means that in 3D you will have an average of 60 FPS, which again means you should expect some smooth gameplay.
Why are some graphs incomplete?
Adding new game benchmarks is a long, tedious, and time consuming task, as every video card has to be re-tested in those new benchmarks. For that reason, we have always just reevaluated our benchmark line up every six months. To stay up-to-date and current with the latest benchmarks and games available, we've changed our approach to adding new benchmarks.
Our benchmark line up will progress and be updated as newer, more intensive games with benchmarks comes to light. While this will mean that initially you may only see a single video card in those particular graphs, as the weeks go on and we test more and more video cards, the results will quickly grow. This will help keep our benchmark line up as up-to-date as possible as we introduce and remove games on a constant basis.
Benchmarks - 3DMark
3DMark 11
Version and / or Patch Used: 1.1
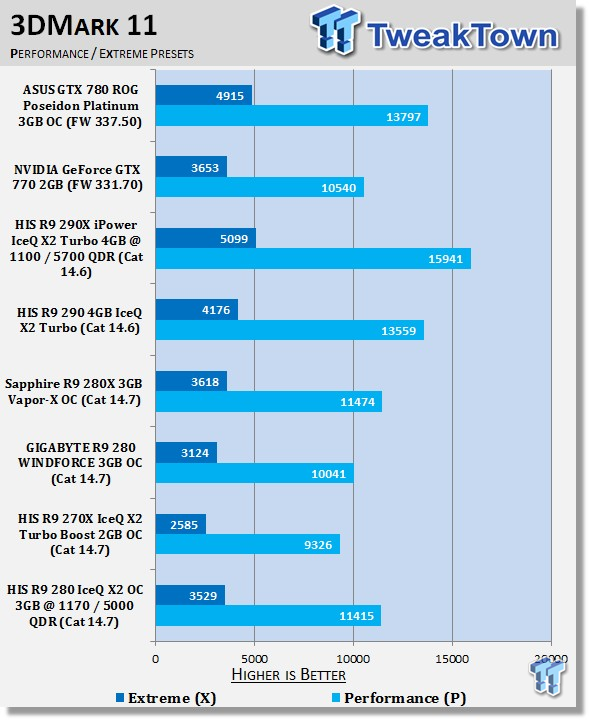
3DMark 11 sees some great performance from the HIS R9 280 IceQ X2 OC 3GB, thanks to that overclock. At both presets, you can see we're right on the tail of the more expensive Sapphire R9 280X 3GB Vapor-X OC. Let's hope we see this kind of performance continue throughout the remainder of our testing.
3DMark Fire Strike
Version and / or Patch Used: 1

Fire Strike sees the same kind of performance as above; the overclock gives us a really strong boost in performance, and both presets see the HIS R9 280 IceQ X2 OC 3GB sit quite close to the Sapphire R9 280X 3GB Vapor-X OC.
Benchmarks - 3DMark Sky Diver & Catzilla
3DMark Sky Diver
Version and / or Patch Used: 1.1

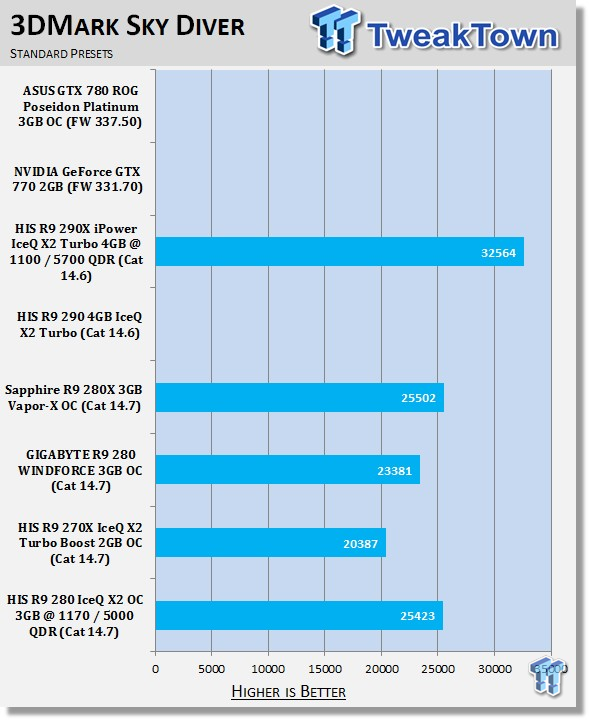
Here you can see that the HIS and Sapphire cards are quite close together once again. That strong core overclock we achieved on the HIS offerings means that it's only a stone's throw away from the R9 280X.
Catzilla
Version and / or Patch Used: 1.3

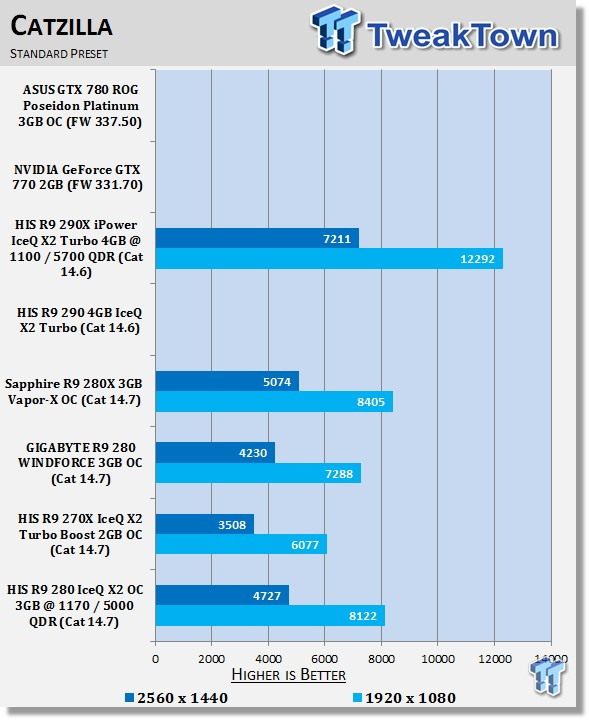
Catzilla follows the trend with the HIS R9 280 IceQ X2 OC 3GB, and sees some great performance gains over the GIGABYTE version of the card. The strong core overclock we achieved really closes the gap between the R9 280 and R9 280X.
Benchmarks - Unigine Heaven & Phantasy Star Online 2
Unigine Heaven Benchmark
Version and / or Patch Used: 3
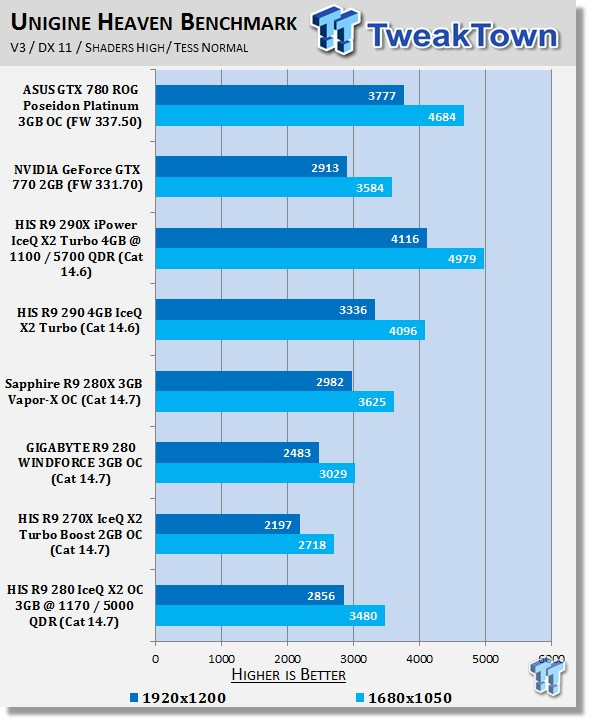
Looking at Heaven, the trend continues with some impressive numbers being seen out of the HIS R9 280 IceQ X2 OC 3GB, thanks to that really strong core clock we managed to achieve when overclocking.
Phantasy Star Online 2
Version and / or Patch Used: Standalone Benchmark

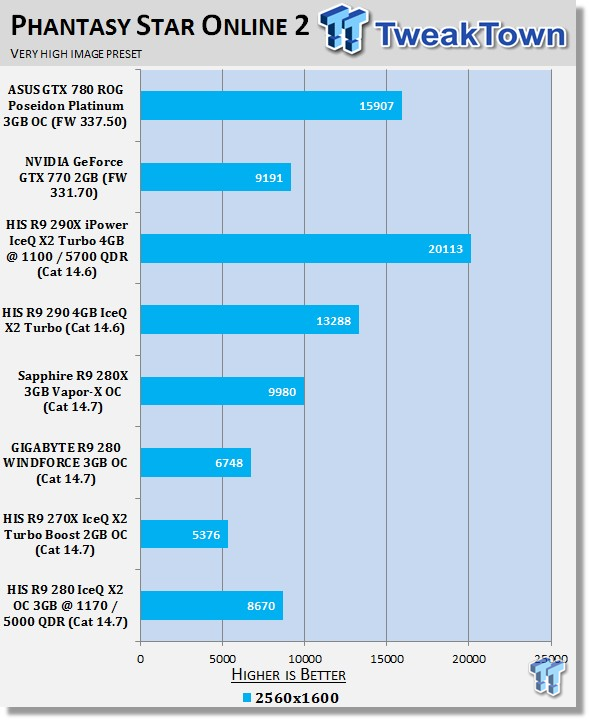
Phantasy Star Online 2 loves overclocked cards, and by looking above, you can see a massive boost in performance when comparing the two R9 280 cards.
Benchmarks - Lost Planet 2 & Just Cause 2
Lost Planet 2
Version and / or Patch Used: Standalone Benchmark
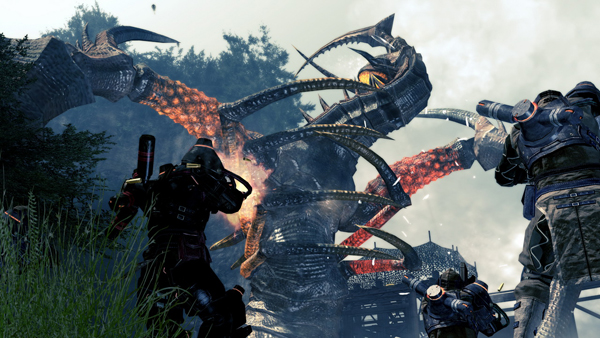

Lost Planet 2 numbers are extremely healthy across the board. At the highest resolution, you can see the strong overclock we managed to achieve helps give us a fair bit of breathing room as we move out of the 60 FPS range, and into the 70 FPS range.
Just Cause 2
Version and / or Patch Used: Latest Steam Update


Just Cause 2 numbers are really strong across the board, and excellent numbers are seen at all resolutions. Here you can see we actually manage to sit ahead of the GTX 770 2GB at all resolutions.
Benchmarks -Metro: Last Light & Nexuiz
Metro: Last Light
Version and / or Patch Used: Latest Steam Update


Metro: Last Light is extremely intensive, and you can see the GIGABYTE R9 280 wasn't able to break that 60 FPS number we're after at any resolution. However, thanks to the extremely strong core clock we achieved on the HIS R9 280 IceQ X2 OC 3GB, you can see that we're able to break the 60 FPS mark at 1680 x 1050 with a solid 66 FPS average. While moving north on the resolution table results in numbers that are too low, you can see that we do get a nice increase in performance in comparison to the GIGABYTE version.
Nexuiz
Version and / or Patch Used: Latest Steam Update
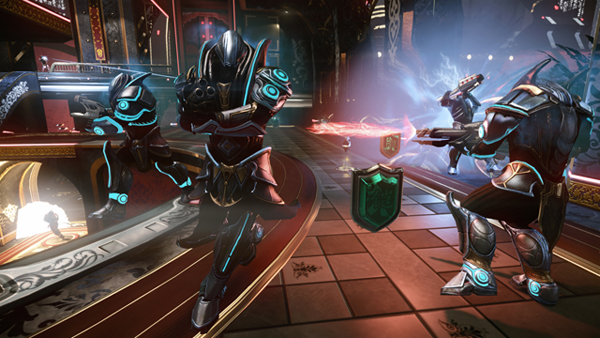

Just like Metro: Last Light, the GIGABYTE R9 280 WINDFORCE 3GB OC falls short of the of that 60 FPS number we're on the hunt for at any resolution. While the HIS R9 280 IceQ X2 OC 3GB sees a nice boost thanks to our strong overclock, we still fall short of that 60 FPS, with the closest number being the 57 FPS average at 1680 x 1050.
Benchmarks - Sniper Elite V2 & Sleeping Dogs
Sniper Elite V2
Version and / or Patch Used: Standalone Benchmark
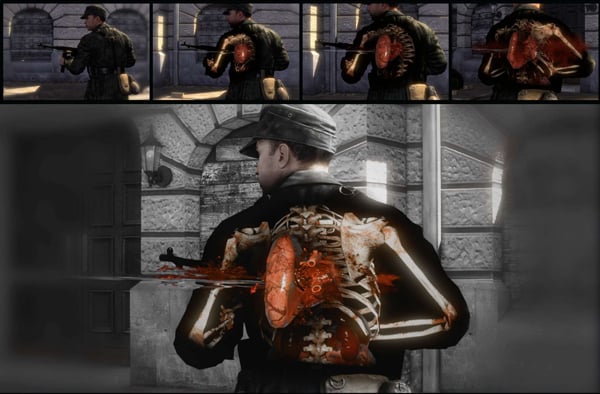

Sniper Elite V2 numbers look strong across the board, and thanks to that strong core clock we achieved, the HIS R9 280 IceQ X2 OC 3GB manages to break past the 60 FPS barrier at the highest resolutions. This is something the GIGABYTE R9 280 WINDFORCE 3GB couldn't do out of the box.
Sleeping Dogs
Version and / or Patch Used: Latest Steam Update

Here we continue to see that the HIS R9 280 IceQ X2 OC 3GB provides strong performance gains over the GIGABYTE version when overclocked so high on the core. Performance remains close to that of the R9 280X Vapor-X OC from Sapphire, and in this case, we manage to come out ahead of the GTX 770 2GB.
Benchmarks - Hitman: Absolution & Tomb Raider
Hitman: Absolution
Version and / or Patch Used: Latest Steam Update

Hitman: Absolution performance is great, and the strong core overclock we achieved sees the HIS R9 280 IceQ X2 OC 3GB give us an average of over 60 FPS at the highest resolution (something the GIGABYTE card couldn't do out of the box). You can also see we're well ahead of the GTX 770 2GB.
Tomb Raider
Version and / or Patch Used: Latest Steam Update

Tomb Raider seems to make great use of the strong core overclock here; the HIS R9 280 IceQ X2 OC 3GB manages to break the 60 FPS average barrier at 1920 x 1200. The GIGABYTE version fell behind at 56 FPS.
Benchmarks - BioShock Infinite & Battlefield 4
BioShock Infinite
Version and / or Patch Used: Latest Steam Update


While BioShock Infinite sees the R9 280 struggle at the highest resolution, the strong core clock we managed to get on the HIS R9 280 IceQ X2 OC 3GB really helps give us a bit more breathing room at 1920 x 1200. We moved up from the 62 FPS average seen on the GIGABYTE R9 280 WINDFORCE 3GB OC, to 69 FPS seen on our overclocked HIS version.
Battlefield 4
Version and / or Patch Used: Latest Origin Update


Looking above, you can see that we manage to get great performance across the board from the HIS R9 280 IceQ X2 OC 3GB. Thanks to the strong overclock, at 2560 x 1600 we moved from an average that is below 60 FPS to an average over 60 FPS when compared to the GIGABYTE version.
Benchmarks - GRID Autosport
Grid Autosport
Version and / or Patch Used: Latest Steam Update

GRID Autosport numbers look great across the board. Just like we saw under Battlefield 4, the strong core clock we achieved on the HIS R9 280 IceQ X2 OC 3GB sees an average of over 60 FPS, while the GIGABYTE version falls short with its out of the box clock.
Benchmarks - High Quality AA and AF
High Quality AA and AF Testing
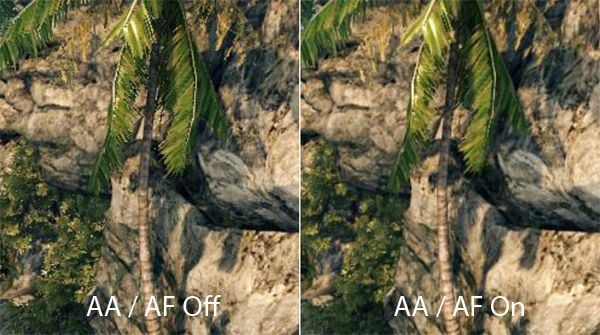
While we test all our games with maximum in-game settings, turning on Anti-Aliasing (AA) and Antistrophic Filtering (AF) helps take the intensity of our testing to another level.
Here we see video cards go from playable FPS to unplayable FPS, and the real power houses continue to help break that 60 FPS mark we always aim for to provide a smooth gaming experience.

Even with the strong core clock increases, AA and AF just aren't an option at any resolution for a game like Metro: Last Light.

At 1920 x 1200, the GRID Autosport numbers are strong, with a 71 FPS average coming from the strongly overclocked HIS R9 280 IceQ X2 OC 3GB. You can see that we manage to get quite a bit more breathing room by overclocking in comparison to the GIGABYTE, which sees a 64 FPS average.

Just like Metro: Last Light, Sleeping Dogs sees numbers that are just way to low when AA and AF are thrown into the mix.
Benchmarks - 4K - 3840 x 2160 Testing
4K - 3840 x 2160 Testing

4K monitors are the next step for gamers demanding the best in image quality. With 4x the pixels of a standard 1920 x 1080 monitor (meaning 4x the intensity), 3840 x 2160 brings a new level of intensity to video cards.
To make sure that you're buying the right video card for a monitor that offers such a large resolution, we test the latest and greatest video cards in a couple of benchmarks to give you an idea of just what kind of setup you require.
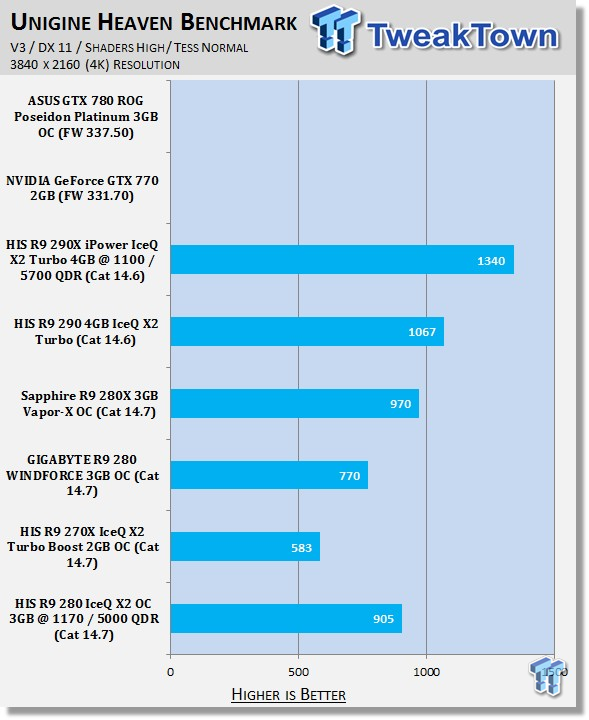
With the resolution cranked up, you can see that the strong core clock we achieved on the HIS R9 280 IceQ X2 OC 3GB helps close the gap between the R9 280 and R9 280X.

While we do see a nice boost in performance, the overall average is still too low for the HIS R9 280 IceQ X2 OC 3GB at this resolution.
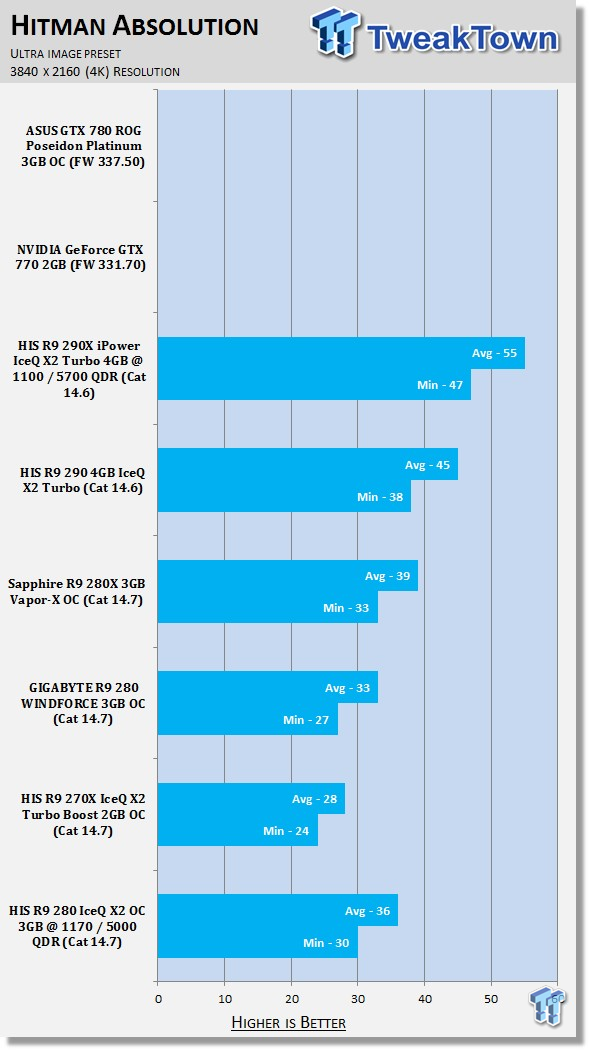
While the minimum doesn't look too bad under Hitman: Absolution, the average FPS is just way too low.

Moving to Tomb Raider, you can see that the 4K the intensity of the game is just too much for all of our setups here.

Similar to what we saw with Hitman: Absolution, we can see a good minimum FPS here, but unfortunately the 39 FPS average is just way too low.
Temperature & Sound Testing
Temperature Test

The temperature of the core is pulled from MSI Afterburner with the max reading used after a completed run of 3DMark Vantage at the Performance preset.

Looking at the temperature numbers, you can see that we're sitting right in the middle of the pack here. Sixty-six Celsius at load isn't bad at all considering the extra voltage that is being run through the card to achieve the strong core overclock.
Sound Test

Pulling out the TES 1350A Sound Level Meter, we quickly find ourselves yelling into the top of it to see how loud we can be.
After five minutes of that, we get a bit more serious, and place the device two CM away from the fan on the card to find the maximum noise level of the card when idle (2D mode), and in load (3D mode).

Noise levels on the card are really strong, and come in at 58.8 dB under load. You can see we're sitting a decent chunk down into the bottom half of the graph here. Both numbers help show just how strong the IceQ X2 cooler is when it comes to cooling these cores; even when more voltage is thrown into the mix.
Power Consumption Testing

Using our PROVA Power Analyzer WM-01 -or "Power Thingy" as it has quickly become known as to our readers- we are now able to find out what kind of power is being used by our test system and the associated video cards installed. Keep in mind that it tests the complete system (minus LCD monitor, which is plugged directly into AC wall socket).
There are a few important notes to remember, though. While our maximum power is taken in 3DMark06 at the same exact point, we have seen the power being drawn as much as ten percent more in particular tests. We test at the exact same stage every time, so tests should be very consistent and accurate.
The other thing to remember is that our test system is bare minimum -only a SSD is used, with a single CD ROM, and minimal cooling fans.
So, while the system might draw 400 watts in our test system, placing it into your own PC with a number of other items will result in a higher draw.

Power consumption comes in at a little below 500 watts under load. For a setup like this, we'd recommend a quality power supply that was sitting around the area of 650+ watts.
Pricing, Availability, and Final Thoughts
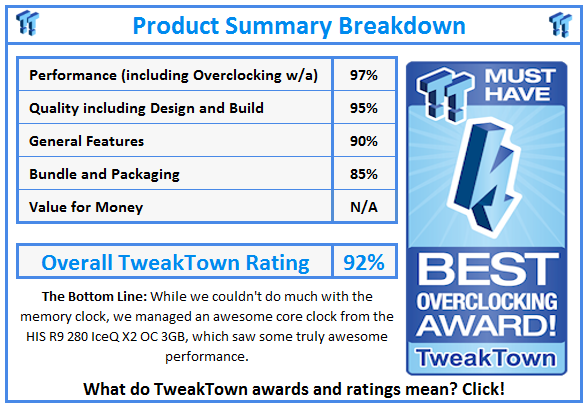
The HIS Radeon R9 280 IceQ X2 OC 3GB isn't a bad card at all. The IceQ X2 cooler is a winner as usual, and while the giant gold shroud isn't to everyone's liking, I must admit I'm quite a fan of it. Although, it's below the shroud where all the magic happens, and it is magic that happens indeed.
The cooling numbers the card puts out are fantastic; especially when you consider the extra voltage that is being run through the card with the higher core clock. The icing on the cake is really the noise readings of the cooler, which are also extremely impressive considering the same circumstances.
Out of the box, the performance isn't going to be too bad. It won't be as strong as the GIGABYTE version, which sees a higher out of the box core clock, but it will come out ahead of the Sapphire, which sees a slightly lower core clock. There's no denying that if you really want to make the model shine, you're going to want to fire up something like MSI Afterburner.
While we didn't have any luck when it came to memory overclocking, you can see that core overclocking was very successful. It's also worth mentioning, that while not always stable, we did manage to benchmark the HIS R9 280 IceQ X2 OC 3GB at 1200MHz core under some benchmarks. If you wanted to mess around with some extra cooling fans around the cards and increase the fan speed for some benchmarking, you would undoubtedly be able to achieve a higher overclock.
While the bundle was small, it was also typical. With that said, when a company provides Mini DP, we would like them to include a Mini DP to DisplayPort connector in the bundle. We would've preferred to see this connector included instead of the DVI to VGA connector, which we're sure doesn't get much use today.
All in all, though, the HIS R9 280 IceQ X2 OC 3GB is a great video card that should be priced around $200 like other versions. To get the most out of the card, we'd really recommend you get into overclocking; overclocking brings some real value out of the model. This is something that we didn't think would ever happen after the way AMD originally priced the model.

