Introduction
Virident was founded in 2006 with a simple goal of maximizing CPU utilization by boosting I/O performance. Virident's flash journey began with NOR products, but an eventual restructuring brought them into the NAND space. Their first PCIe SSD, the TachIO, rolled out in 2010 sporting ultra-durable SLC. MLC easily addresses endurance for 95% of applications, and acceptable performance and better economics led to the arrival of the MLC FlashMAX design in 2011. Virident delivers on density and performance, but their true strength lies in wide interoperability with leading applications and an ecosystem of software that enhances application performance. Virident's software offerings leverage the server, storage, and network resources of converged datacenter infrastructures to deliver SAN-like capabilities.
Virident came under the umbrella of storage industry heavyweight WD when HGST brought Virident in October of 2013. HGST is fast becoming the flash arm of WD, and the existing Virident product line fills a gap in their offerings. Virident gains access to an established channel and more engineering muscle to develop tightly integrated server-side flash storage and software.
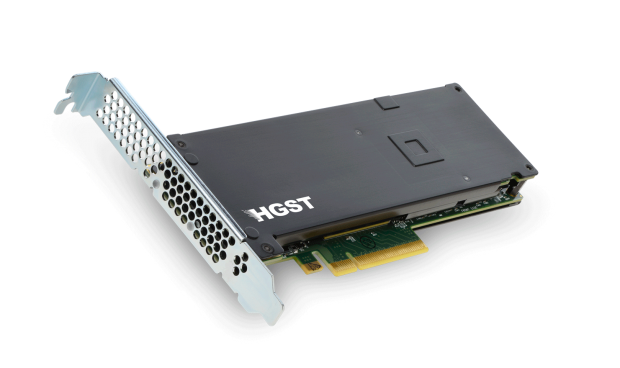
The HGST FlashMAX II is a Storage Class Memory (SCM) product designed to maximize density and performance, and minimize latency, to provide higher performance in cloud computing, virtualization, database, analytics, HPC, and webscale applications.
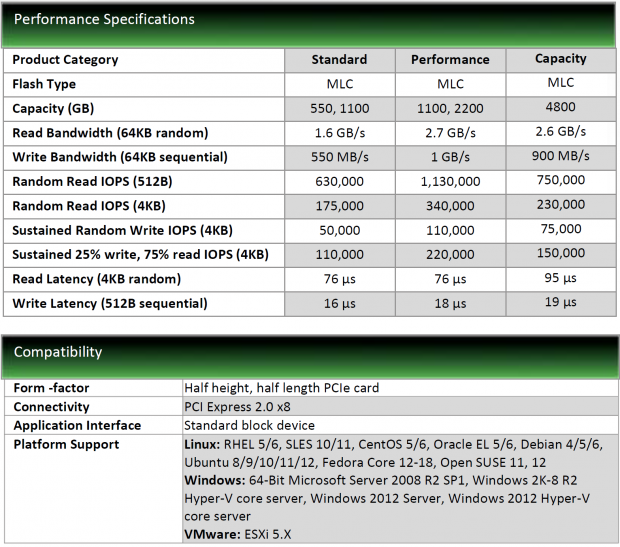
The third generation FlashMAX II design features formidable density packed into the HHHL (Half-Height, Half-Length) form factor. Three models, Standard, Performance, and Capacity, address varying performance and density requirements. The Standard model features the lowest speed and densities of 550 GB and 1.1 TB. The Capacity model has incrementally slower speed than the performance variant, but offers a whopping 4.8 TB of storage in the slim HHHL form factor.
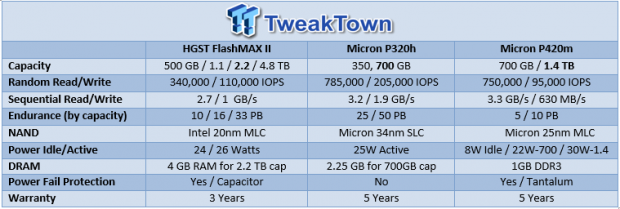
The 2.2 TB Performance model, which we are evaluating today, supplies large block random-read bandwidth of 2.7 GB/s, and sequential write speeds of 1 GB/s. The real strength lies in the tuning for transactional workloads, with 1,130,000 512B and 340,000 4k random read IOPS. Sustained 4k write IOPS are spec'd at 110,000. Mixed performance is also impressive with 220,000 75%/25% random read/write 4k IOPS on tap. HGST prides themselves on offering predictable and consistent performance during the warranty period when the drive is full and in steady state. Endurance metrics are impressive at 7.5 DWPD (Drive Writes Per Day) for five years, or 15PB per TB of capacity.
The Storage Class Memory (SCM) distinction is the pillar of the FlashMAX series architecture. The inefficiencies of the SCSI and AHCI driver stack are well known and there are new emerging standards, such as NVMe and SCSI Express, that are developed from the ground up to maximize the driver stack for non-volatile flash. HGST's SCM architecture minimized the driver stack even before finalization of standards such as NVMe.
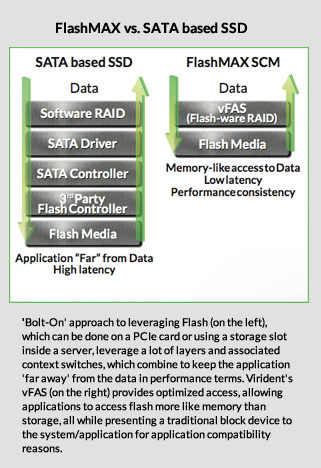
HGST's Virident Flash-management with Adaptive Scheduling (vFAS) is Virident's own proprietary software layer that streamlines flash access. vFAS virtualizes the underlying NAND components and presents them as a standard block storage device. vFAS sidesteps other storage protocols and interconnect layers and addresses flash more as an adjunct to memory. This results in memory-like 20-microsecond latency.
Many competing PCIe SSD designs employ multiple ASICs assigned to control separate 'drives' (consisting of onboard NAND components) that are controlled by a central RAID controller. This creates a flash hierarchy that limits NAND control to the ASIC managing each bank of NAND. vFAS utilizes an FPGA to provide a global view of the underlying flash resource for the host-based SMC software. Applications can create hot spots of activity that lead to premature wear, but the vFAS architecture maximizes endurance with a global wear distribution technique.
Data integrity is always a concern and vFAS addresses this with a flash-aware RAID scheme and end-to-end data protection. This allows isolation of the onboard NAND components into separate stripes in a RAID 5 (7+1) configuration. The global view of the NAND yields the benefit of a flash-optimized parity scheme that protects from multiple component failures, and capacitors protect from host power-loss events.
Most PCIe SSD implementations, with the exception of Fusion-IO (HGST's chief competitor), offload all SSD functions onto the device itself. This alleviates any host overhead and minimizes CPU cycles dedicated to managing the flash resource. HGST's approach utilizes host processing of NAND management to achieve lower latency than competing devices. This removes other performance bottlenecks and gives the SCM architecture a tight integration with their other software offerings.
HGST does not lead with chart-topping performance numbers, instead focusing on providing a performance and low latency that most users can utilize in a typical environment. Today we test the HGST FlashMAX II against two tough competitors, the MLC Micron P420m, and the SLC Micron P320h. First, let's take a look at the software offering of the FlashMAX II.
FlashMAX Connect Software
Many manufacturers overlook the big picture and focus solely on hardware. There are customers, such as the burgeoning hyperscale market, that create and manage their own environments to provide their own customized functionality. Unfortunately, this is a rather small subset of the market, and the majority of administrators are left wanting for traditional capabilities from their server-side flash.
One of the key differentiators of the Virident product line is their enhanced software application suites. Many users require SAN-like functionality, such as replication, high availability, failover, and sharing, to service clustered configurations and meet SLA's. Pairing these features with explosive flash performance has become a challenge.
The FlashMAX Connect software virtualizes memory and storage resources. This allows spanning flash capacity across multiple applications and servers by creating virtual flash storage networks with RDMA to provide the high availability, sharing, and replication features. This provides more flexibility and scalability, and increases efficiency by allowing storage to scale independently of compute resources. Users can integrate .5 TB to 24 TB of flash per server, and scale out by adding servers on an as-needed basis. The architecture has a side benefit of avoiding vendor lock-in.
FlashMAX Connect transforms normal off-the-shelf servers into distributed storage via three integral components. These components are deployed separately, or as an entire suite.
vHA - High Availability Flash Storage
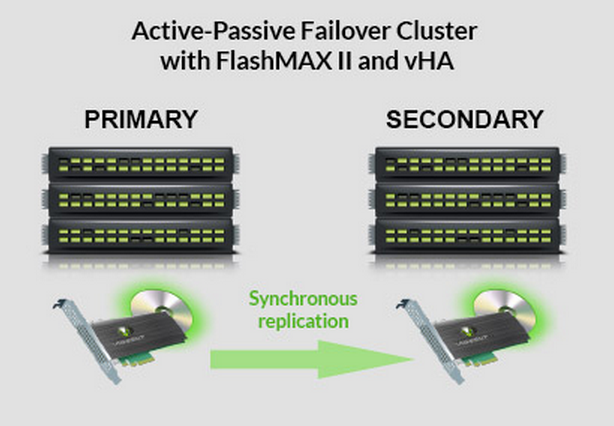
vHA allows the creation of fail-over clusters by enabling synchronous replication among servers for the data stored on remote FlashMAX II SSDs. High-throughput and low-latency are key to retaining the performance benefits of flash, and replication is delivered by RDMA (Remote Direct Memory Access) to minimize latency (with compatible hardware, notably IB QDR or FDR with Mellanox ConnectX-2, X-3, or equivalent). Read traffic is serviced from the in-chassis SSD to minimize network overhead.
vHA supports failover clustering for Oracle, MySQL, PostreSQl, and other applications, and provides replication bandwidth up to 7GB/s per server and 48 microsecond latency for 4k transfers.
vShare - Shared Flash Storage

One of the most common complaints is that PCIe SSDs can create underutilized and isolated pools of storage. In many cases, the speed of one FlashMAX II device will outstrip the needs of a single server, and massive capacities up to 4.8 TB are just begging to be shared. Any underutilized resource represents wasted opportunity and cost, especially with the premium price structure of flash.
vShare extends block-level shared access of FlashMAX devices to multiple servers. This provides access to flash performance for servers that do not have in-chassis flash, and allows creation of high-performance active-active clusters with application-driven data mirroring, such as redundancy modes in Oracle ASM. The vShare driver also features multi-path capability to combat network-based failures.
RDMA once again provides the high-performance data transfer pipe to keep latency low and throughput high, and speeds reach 10 GB/s read + 10 GB/s write. The added 4k read/write latency is 20/40 microseconds, and up to 1,000,000 IOPS can be shared between servers. This is certainly helpful for those wishing to extend the benefits of flash outside of a single server.
vCache - SAN and DAS Caching
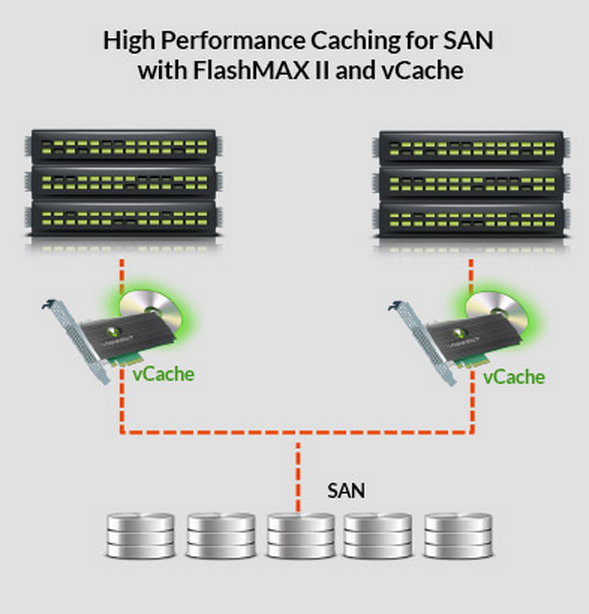
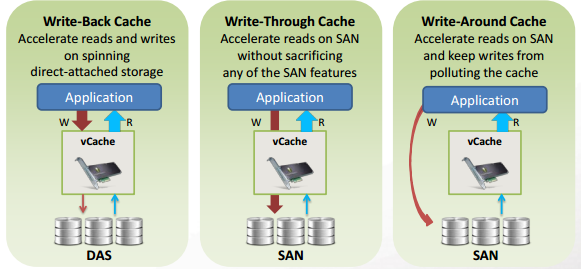
vCache configures the FlashMAX II as a fast front-end for SAN and DAS storage by caching hot data on the flash. vCache maximizes flash endurance by eliminating double mapping of block addresses and has three caching modes (write-back, write-through, and write around) to support varied applications and environments. Users can configure multiple cache pools on a single SSD to cache multiple LUNs. vCache can provide targeted caching by blocking certain processes, such as backup operations, from caching. This increases endurance and maximizes cache capacity.
The most impressive aspect is the combination of vCache with vShare, which provides access to cache pools located on other servers. This optimizes cache capacity in clusters by eliminating replicated cache data while providing easy acceleration to clustered applications. vCache provides 4k read latency at 85 microseconds, and write back cache latency weighs in at 16 microseconds.
Readers should research compatibility for each component to ensure interoperability with their environment.
ServerCache and EnhanceIO Profiler
ServerCache
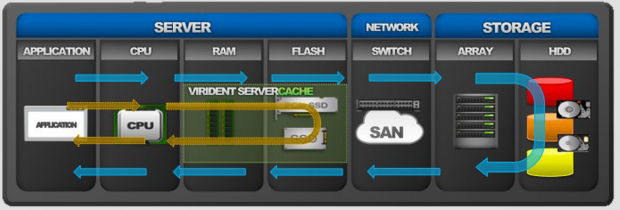
ServerCache provides local I/O acceleration of SAN and DAS volumes. This software automatically detects changing data patterns and manages the cache pool without manual intervention. ServerCache does not disrupt the existing environment and uses multiple methods to reduce the amount of cached data stored to supply maximum performance and endurance.
One of the peripheral benefits of ServerCache is reduction of network traffic. Hosting the majority of hot traffic in the chassis requires less network bandwidth to serve I/O, which in turn improves QoS for other servers connected to the same SAN. The most commonly cached data is random workloads. Alleviating the burden of random access on underlying platter-based architectures also speeds the SAN's performance at other tasks.
ServerCache also offers a robust set of features to tailor the caching algorithms to the needs of the environment. Read Caching (write-through caching) and Write-Back Caching are common functions of caching applications, but Virident also offers Warm Cache upon Reboot, SSD-Optimized Access, Multi-Volume Cache and RAM-only mode.
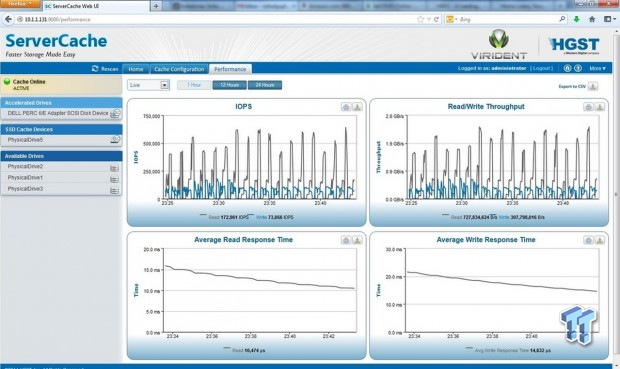
The web-based GUI provides at-a-glance monitoring of IOPS, throughput, and response times for data traffic and control of cache configurations. Users can monitor and adjust caching techniques based upon performance data.
EnhanceIO Profiler
EnhanceIO Profiler analyzes and interprets data access patterns on the host machine. The profiler compiles this data and intelligently recommends cache configurations and cache capacity. This free utility assists those assessing their cache needs.
FlashMAX II Manager
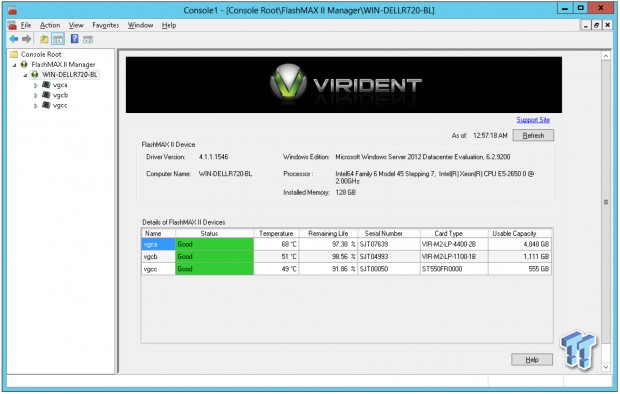
The HGST FlashMAX II Manager is a proprietary GUI application, automatically installed during device installation, which configures and monitors the device. The home pane provides system information and an easy-to-understand dashboard that displays system status at a glance. This displays remaining life, temperature, and drive status for each FlashMAX II in the server.
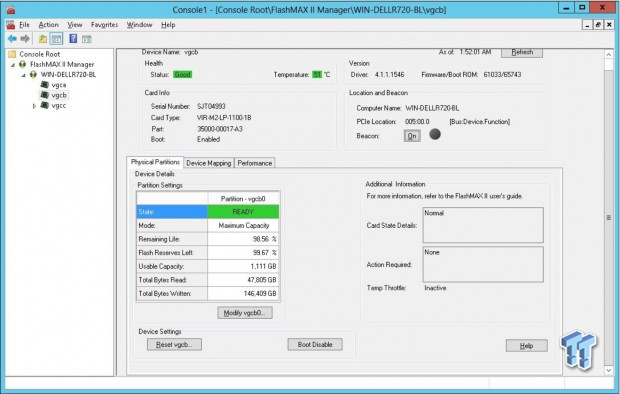
More in-depth information for each device is contained in the drive management pane. Users can perform multiple functions, such as modifying and resetting the device configuration. The FlashMAX II lets the user select Performance or Capacity modes to tune the level of overprovisioning and performance to their requirements. Performance mode will also provide more endurance due to increased overprovisioning, but Virident does not list the amount of extra endurance offered. The lifetime monitor allows users to monitor the remaining write endurance of the device.
The beacon button activates a light on the rear of the device to determine location in a rack environment. The 'additional information' area will alert users to dynamic throttling due to high temperature or crossing power thresholds. Reduced performance alleviates overheating when the drive reaches 78C, and the drive shuts down at 85C. The FlashMAX II throttles if it crosses a power consumption threshold of 24W for smaller capacities, and 26W for the 4,800GB variant. There is an option to disable power throttling by selecting the turbo mode.
The device can appear as one or two volumes if it is a large capacity variant (two PCBs). If one volume is selected the FlashMAX II automatically controls the RAID configuration and presents both devices as one logical drive to the operating system. This is an advantage over some PCIe SSDs, which require external RAID programs to unify multiple volumes.
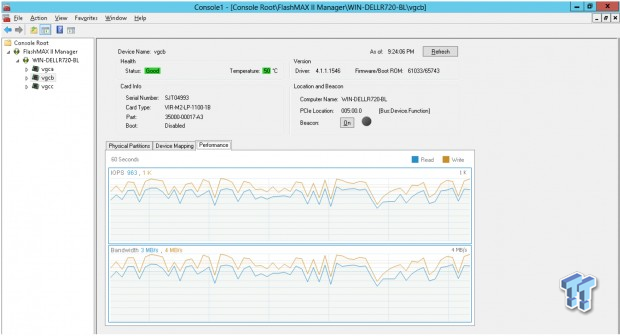
The Performance tab monitors the read/write bandwidth and IOPS for each device in real-time. There are several CLI utilities, such as vgc-beacon, vgc-config, and vgc-monitor. These provide CLI monitoring and configuration of many of the same features as the GUI.
One utility that stands out is vcg-secure-erase.exe. This Secure Erase utility provides two levels of sanitization to wipe the drive. The Clear and Purge options are compliant with DOD 5220.22-M and NIST SP800-99 sanitize erase specifications.
Finally, there is also the option to use the HGST Device Manager (HDM). This utility combines GUI and CLI components for detailed configuration, monitoring, reporting, and diagnostics of flash devices.
Design and Specifications
FlashMAX II Design
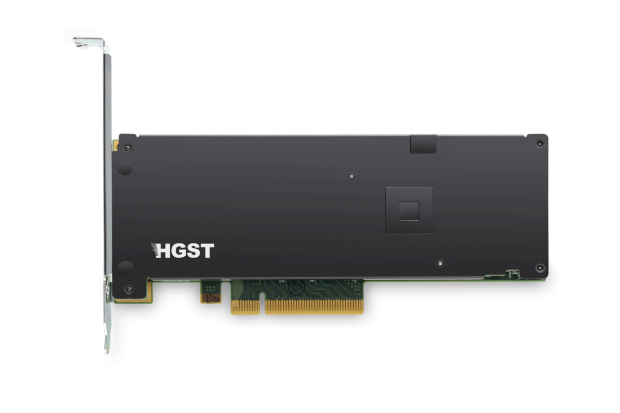
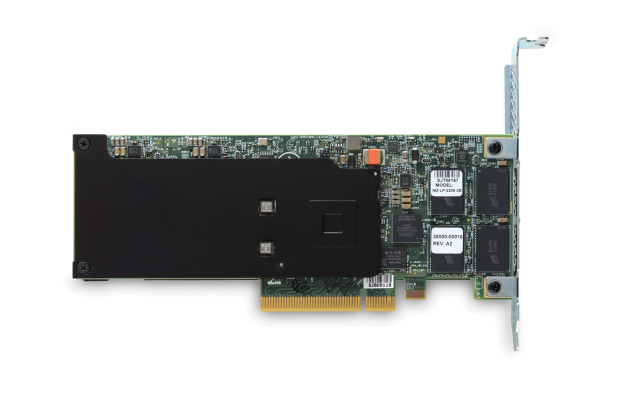
The HGST FlashMAX II comes in a slim HHHL form factor that allows installation into every major server platform. This dense configuration packs 3,072 GB of raw capacity with 2,222 GB user-addressable space in the Capacity configuration. The device features a PCIe 2.0 x8 connection.

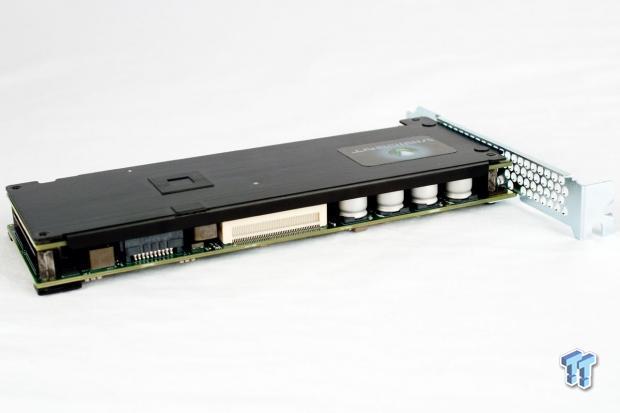
The drive comes in single PCB arrangements for smaller capacities, but the 2.2TB model features a two PCB configuration. There are large black heat sinks to facilitate thermal transfer from underlying components. We observe four rather large capacitors peeking out from underneath the edge of the device. These provide enough power to flush all data in transit down to the NAND in the event of a host power-loss event.
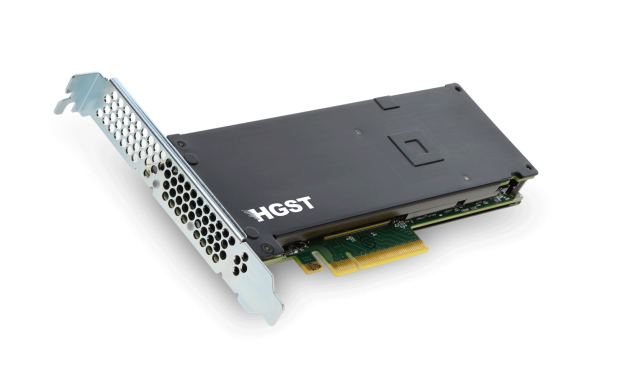
The bracket has holes to facilitate airflow and features two LED lights that denote drive activity and error states through various flashing codes.
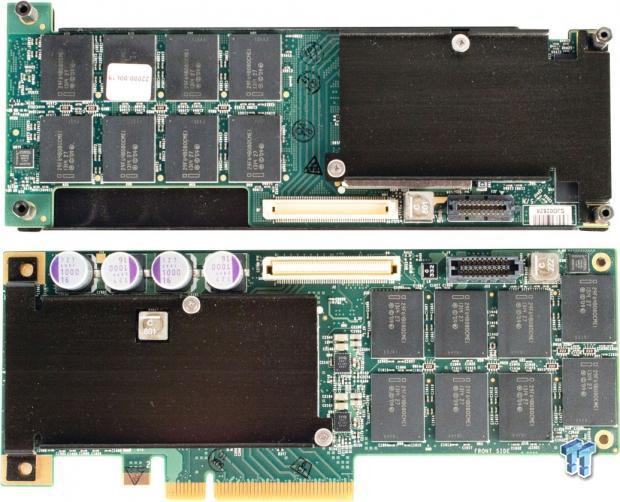
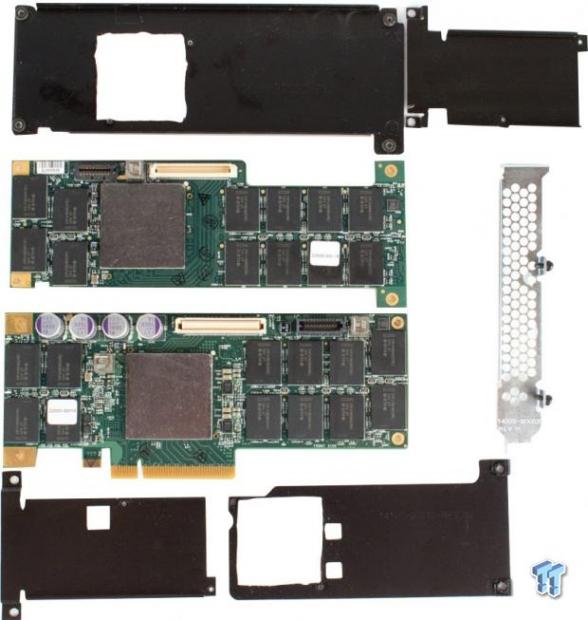
Dissembling the device reveals two separate PCBs that interconnect through mating connectors on the edge of the PCB's. There are two additional shrouds that cover the FPGA's present on each board.
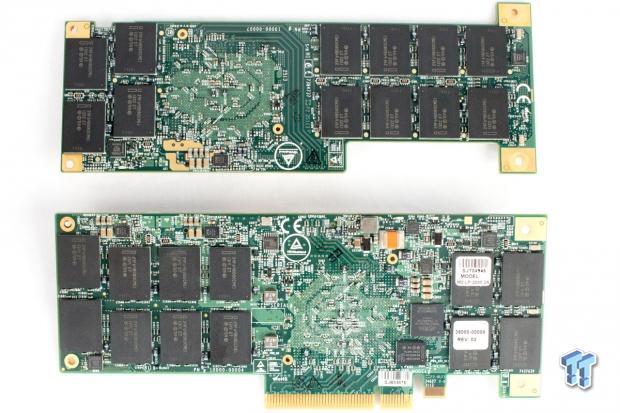
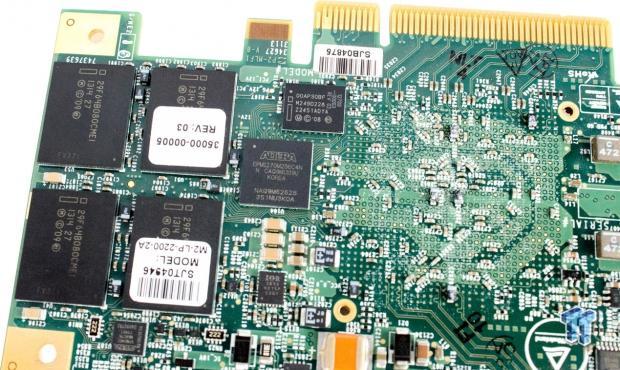
Once laid bare we observe the 20nm Intel MLC NAND packages. The 2.2TB FlashMAX utilizes 4GB of system RAM for operation.
FlashMAX II Specifications
HGST's FlashMAX II is bootable with UEFI and supported operating systems. The warranty period is notably shorter than competing products at three years. There are varying airflow requirements for each model, and all require a PCIe Gen 2 x8 electrical connection.

Test System and Methodology
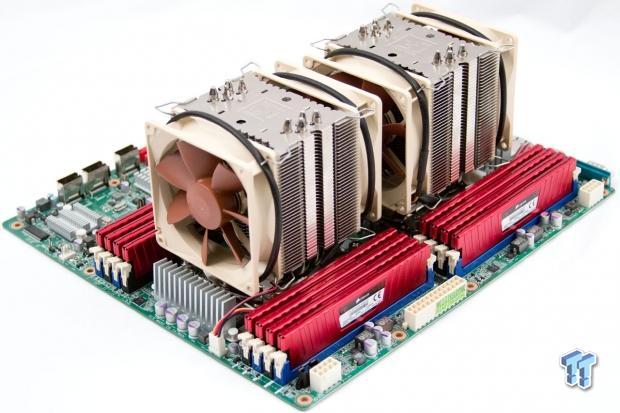

We designed our approach to storage testing to target long-term performance with a high level of granularity. Many testing methods record peak and average measurements during the test period. These average values give a basic understanding of performance, but fall short in providing the clearest view possible of I/O QoS (Quality of Service).
While under load, all storage solutions deliver variable levels of performance. 'Average' results do little to indicate performance variability experienced during actual deployment. The degree of variability is especially pertinent, as many applications can hang or lag as they wait for I/O requests to complete. While this fluctuation is normal, the degree of variability is what separates enterprise storage solutions from typical client-side hardware.
Providing ongoing measurements from our workloads with one-second reporting intervals illustrates product differentiation in relation to I/O QOS. Scatter charts give readers a basic understanding of I/O latency distribution without directly observing numerous graphs. This testing methodology illustrates performance variability, and includes average measurements, during the measurement window.
Consistent latency is the goal of every storage solution, and measurements such as Maximum Latency only illuminate the single longest I/O received during testing. This can be misleading, as a single 'outlying I/O' can skew the view of an otherwise superb solution. Standard Deviation measurements consider latency distribution, but do not always effectively illustrate I/O distribution with enough granularity to provide a clear picture of system performance. We utilize high-granularity I/O latency charts to illuminate performance during our test runs.
Our testing regimen follows SNIA principles to ensure consistent, repeatable testing, and utilizes multi-threaded workloads found in typical production environments. HGST's FlashMAX II operates in two modes, one for maximum user-addressable capacity of 2,222 GB, and the performance mode that trims addressable capacity to 1,847 GB to increase performance. We tested the 2.2TB FlashMAX II in its performance mode.
We test against the 1.4TB MLC P420m and the 700GB P320h. The P320h and the FlashMAX II are not direct competitors due to drastically different price points from the P320h's SLC NAND; we include the P320h as a frame of reference for comparison to SLC products. The first page of results will provide the 'key' to understanding and interpreting our test methodology.
Benchmarks - 4k Random Read/Write
4k Random Read/Write
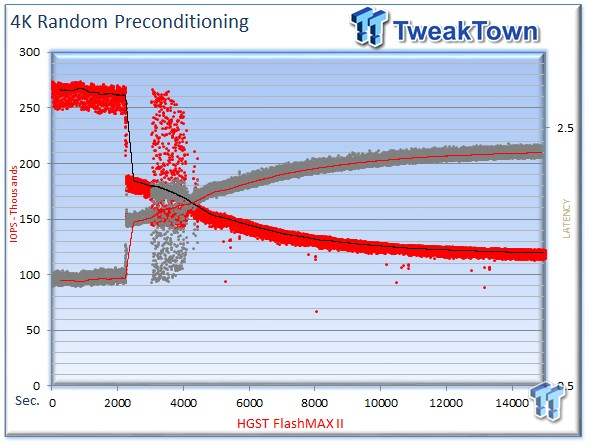
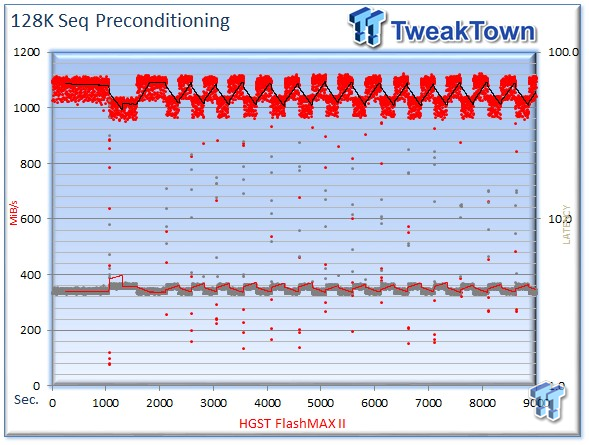
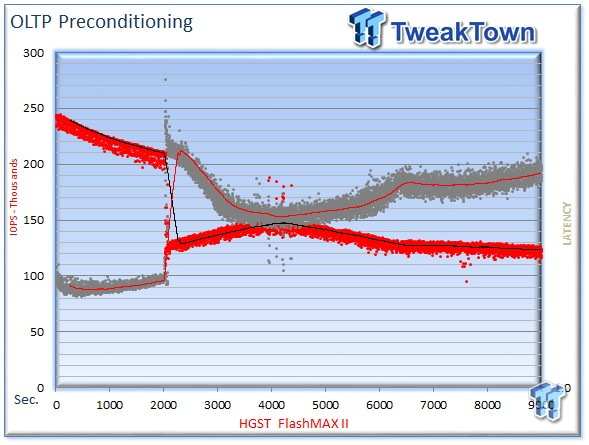
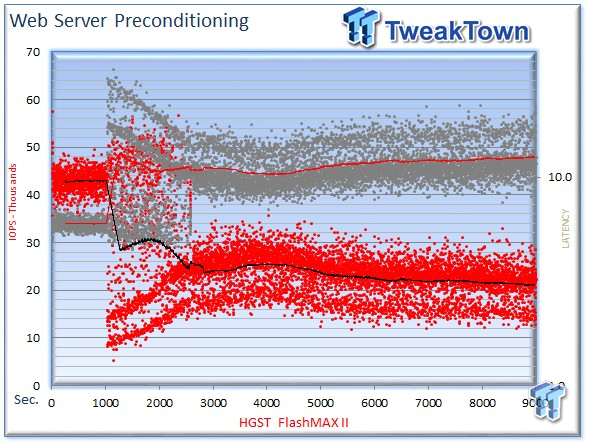
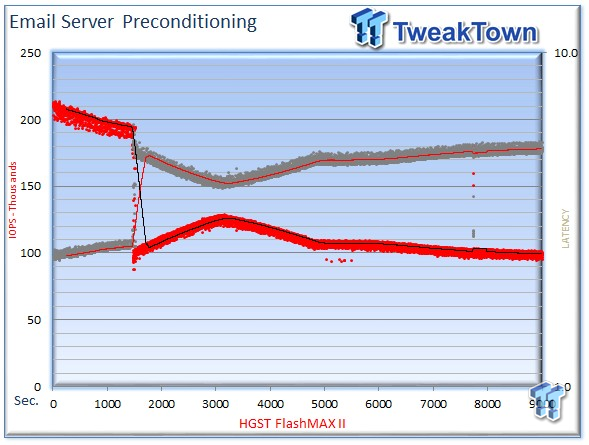
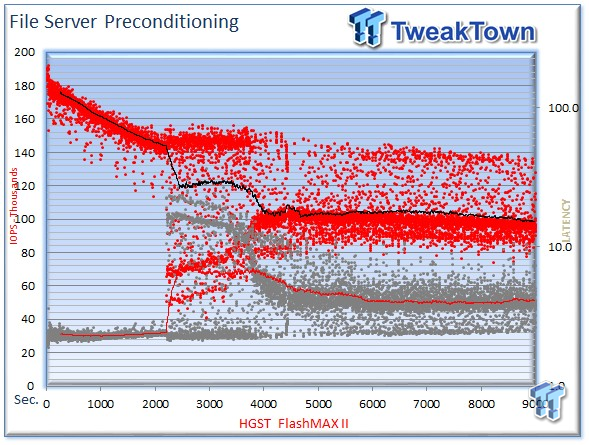
We precondition the HGST FlashMAX II for 9,000 seconds, or two and a half hours, receiving performance reports every second. We plot this data to illustrate the drives' descent into steady state.
This dual-axis chart consists of 18,000 data points, with the IOPS on the left and the latency on the right. The red dots signify IOPS, and the grey dots are latency measurements during the test. We place latency data in a logarithmic scale to bring it into comparison range. The lines through the data scatter are the average during the test. This type of testing presents standard deviation and maximum/minimum I/O in a visual manner.
Note that the IOPS and Latency figures are nearly mirror images of each other. This illustrates that high-granularity testing gives our readers a good feel for latency distribution by viewing IOPS at one-second intervals. This should be in mind when viewing our test results below. This downward slope of performance only happens during the first few hours of use, and we present precondition results only to confirm steady state convergence.
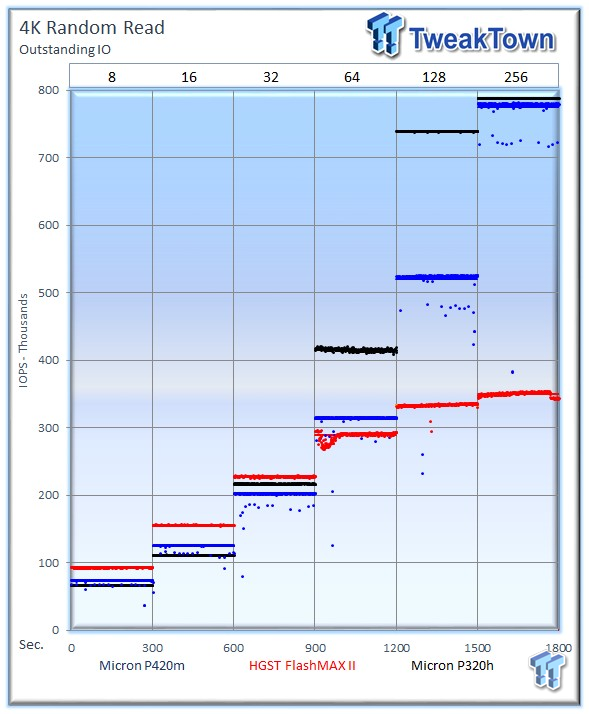
Each level tested includes 300 data points (five minutes of one second reports) to illustrate performance variability. The line for each OIO depth represents the average speed reported during the five-minute interval. 4k random speed measurements are an important metric when comparing drive performance, as the hardest type of file access for any storage solution to master is small-file random. One of the most sought-after performance specifications, 4k random performance is a heavily marketed figure.
The HGST FlashMAX II averages 350,532 IOPS at 256 OIO (Outstanding I/O), beating its rated speed of 340,000 IOPS, but trailing the two Micron offerings by a large margin. The Micron P320h tops the chart with 788,071 IOPS, with the Micron P420m hot on its heels with 774,958 IOPS. The P320h and the FlashMAX II are not direct competitors due to drastically different price points from the P320h's SLC NAND; we include the P320h as a frame of reference for comparison to SLC products.
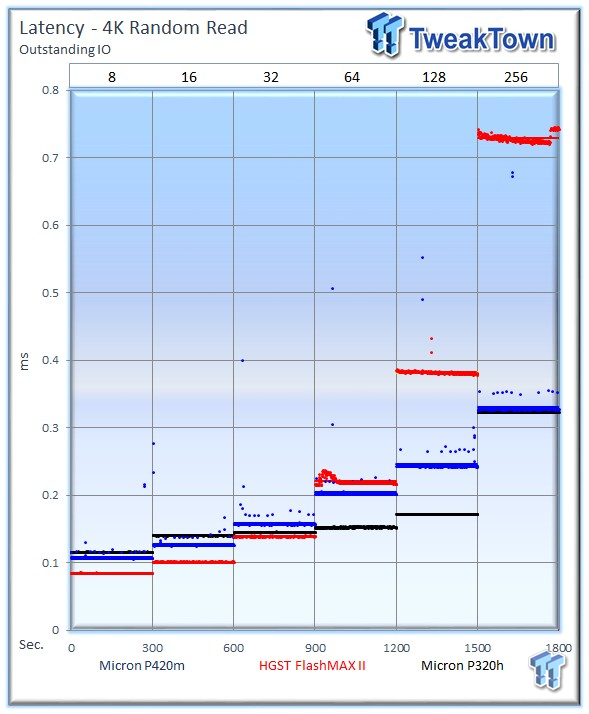
Latency is often the most important metric, and the FlashMAX II provides lower latency where some common applications reside, from 8 to 32 OIO.
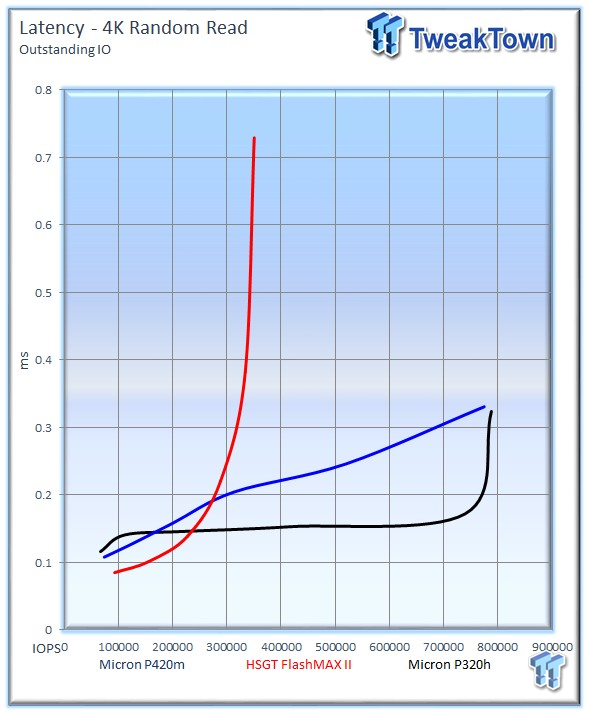
The FlashMAX II provides lower latency up to 230,000 IOPS, where the Micron SSDs take over due to higher peak performance. The benefits of SLC are clear in this test; the P320h's latency remains flat until it reaches its peak speeds.
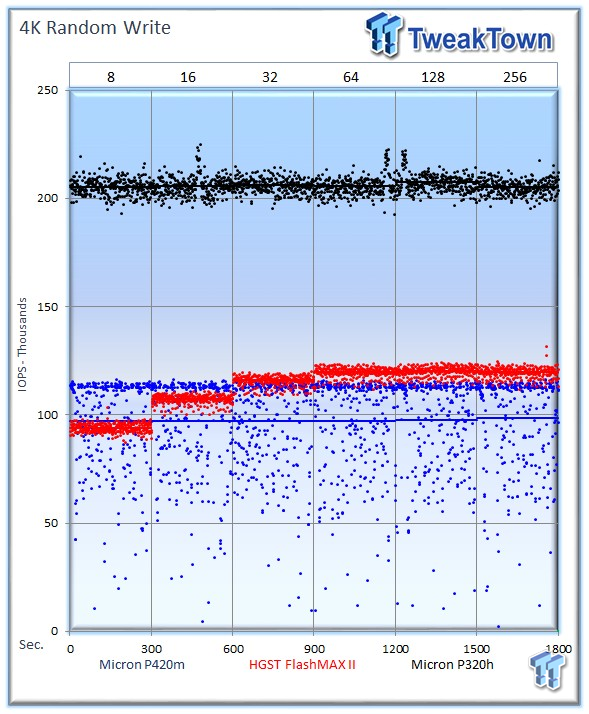
The FlashMAX II averages 119,662 IOPS at 256 OIO, leading its MLC competitor the P420m, which averages 98,304 IOPS. The P320h predictably leads this test with the SLC helping to score an impressive 209,288 IOPS.
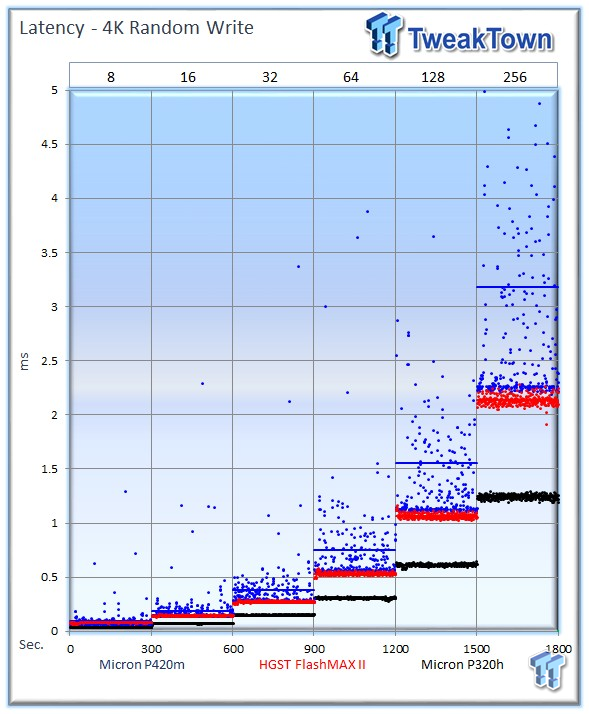
The FlashMAX II exhibits a tight and consistent performance envelope during the test, much like the P320h, albeit at a higher latency. The P420m is tuned for read-centric applications, and experiences performance variability at higher OIO.
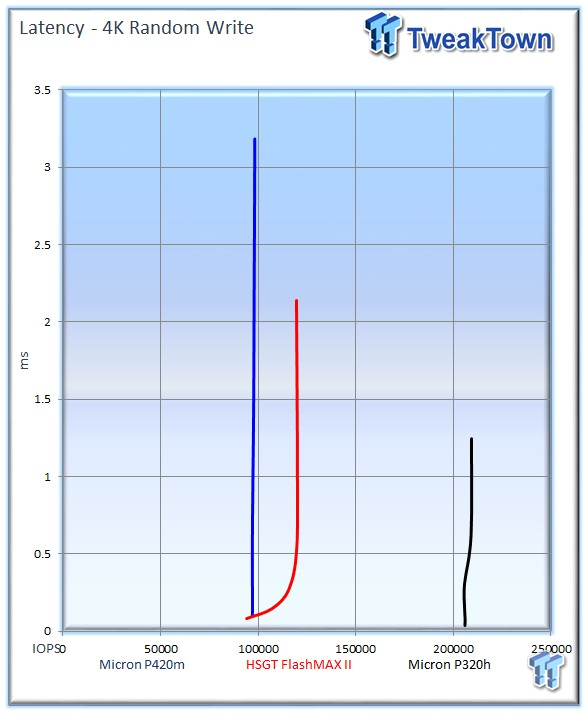
The P320h distances itself from the pack in this test, but the FlashMAX II performs admirably during heavy write workloads, besting the P420m in this test.
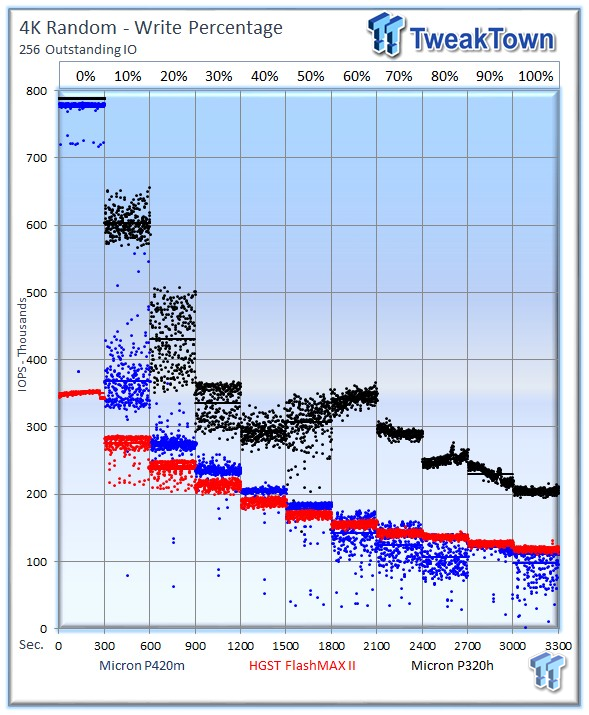
Our write percentage testing illustrates the varying performance of each solution with mixed workloads. The 100% column to the right is a pure 4k write workload, and 0% represents a pure 4k read workload.
The mixed testing illustrates the tremendous read performance of the Micron products, but as we mix in heavier write workloads the results shift in favor of the FlashMAX II in comparison to its MLC counterpart, the P420m. Another point of interest is the tight performance envelope of the FlashMAX II, even more tightly defined than even the P320h in some cases. The P320h delivers much higher performance, of course, but the tight predictable performance from the FlashMAX is commendable.
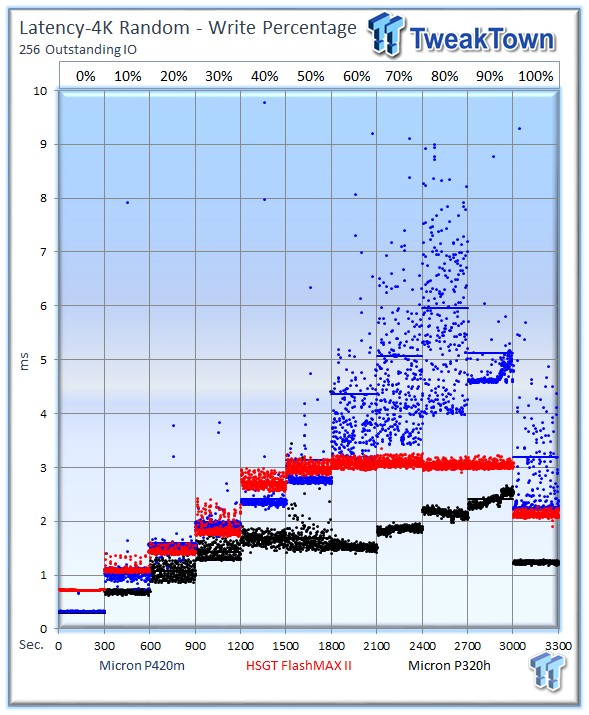
The Micron P420m experiences a significant increase in latency, and variability, as we mix in heavier write workloads. The latency does not scale well in comparison to the P420m IOPS results in this same test, giving the FlashMAX II a decisive win in the 4k mixed workload testing.
Benchmarks - 8k Random Read/Write
8k Random Read/Write
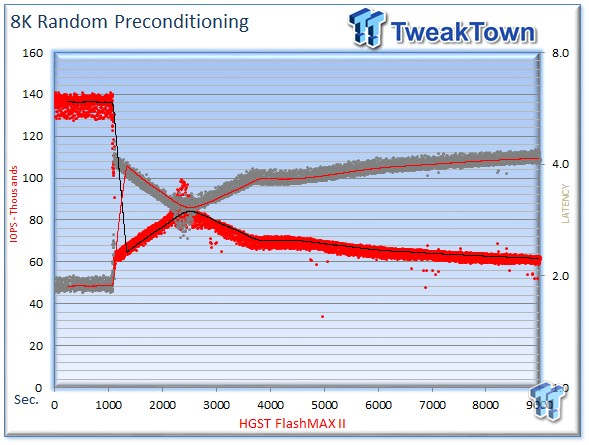
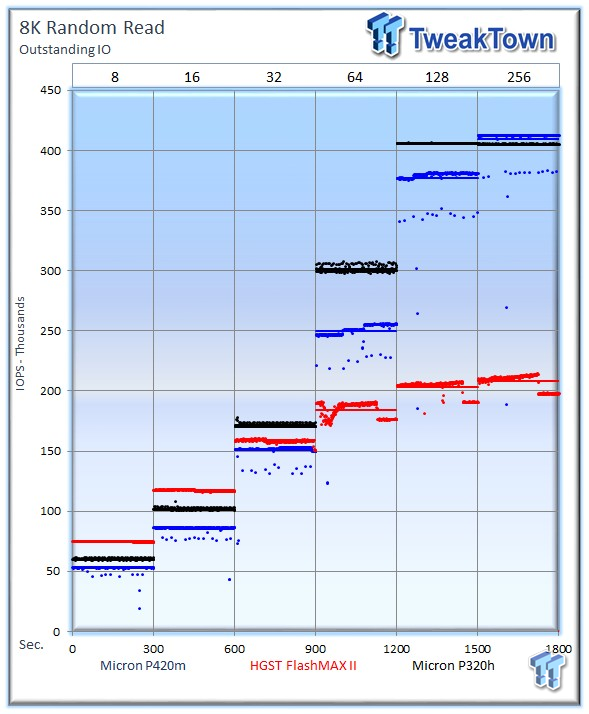
Many server workloads rely heavily upon 8k performance and we include this as a standard with each evaluation. Many of our server workloads also test 8k performance with various mixed read/write distributions.
The FlashMAX II averages 207,859 IOPS at 256 OIO, and the Microns top the chart at 409,751 and 405,481 IOPS. From 8 - 32 OIO the FlashMAX II has an advantage over its MLC competitor, but the formidable random read speed of the P420m pulls ahead under higher loads.
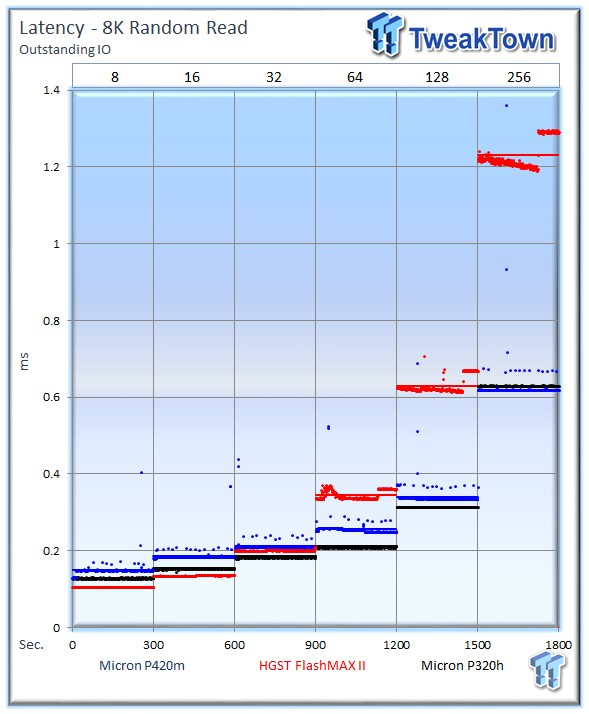
The FlashMAX II latency results surprisingly beat the SLC P320h at 8 and 16 OIO.
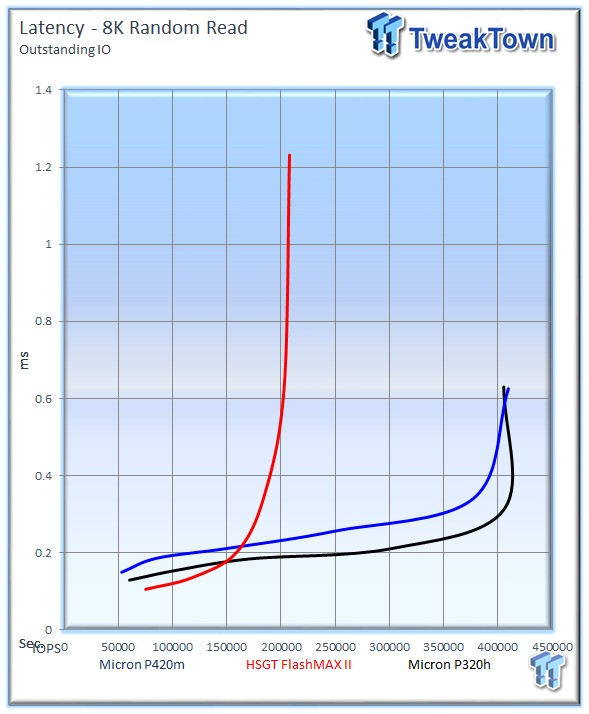
The Micron SSDs leverage their impressive random read speed to win this challenge, but the FlashMAX II continues to exhibit excellent low queue depth performance with the lead up to 150,000 IOPS.
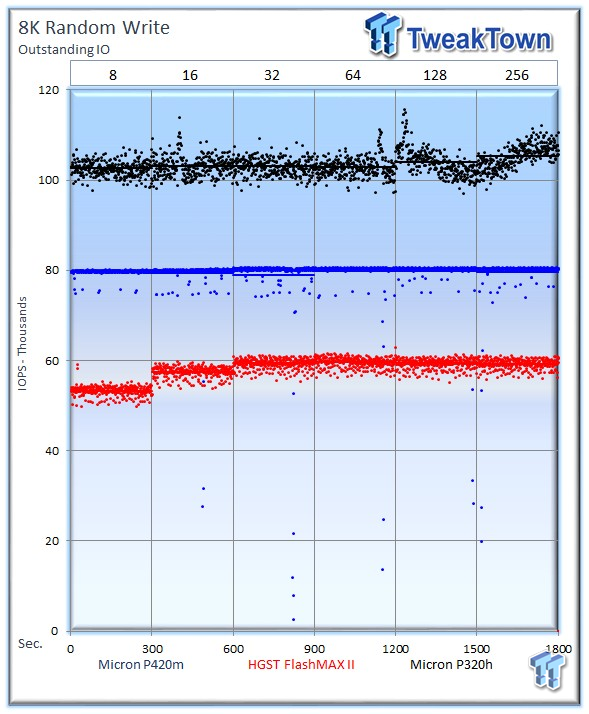
The FlashMAX II does not fare as well in 8k random write workloads, and tops out at a speed of 59,279 IOPS at 256 OIO, while the P420m hits 79,633 IOPS and the P320h leads with 105,363 IOPS.
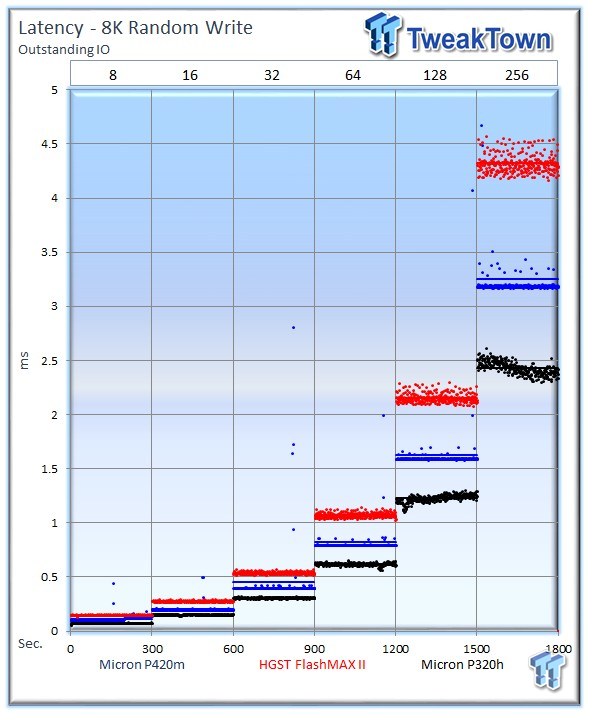
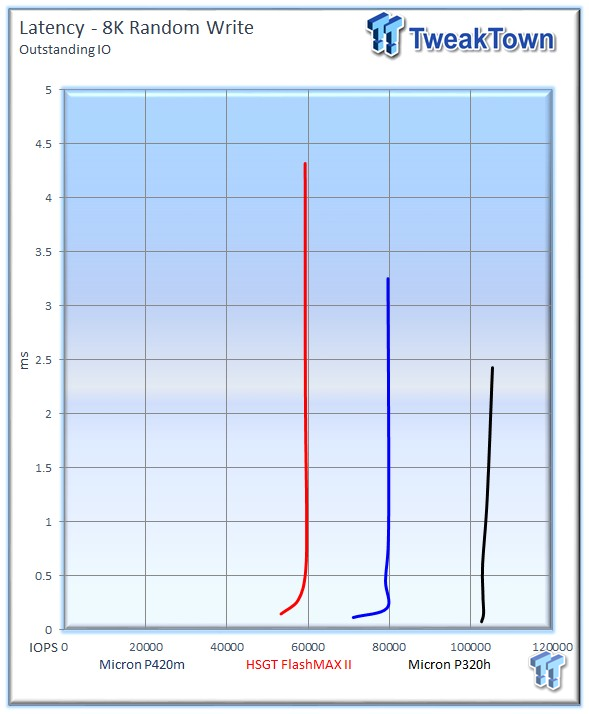
The Micron offerings lead the test with higher performance.
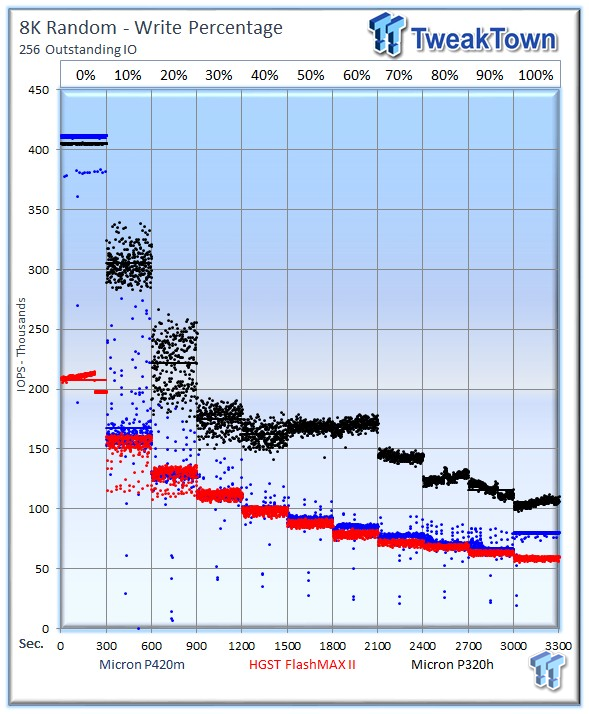
The mixed 8k read/write testing reveals an interesting wrinkle in our results. The Micron P420m experiences a significant jump in performance when it reaches a 100% write workload, but the FlashMAX II matches its performance for the majority of the test.
The P420m has very high speed at 100% read, but falls quickly with a 10% write workload, and falls to the same speed of the FlashMAX II when we reach a 20% write workload. Overall, the two MLC products are very comparable in IOPS during common mixed workloads.
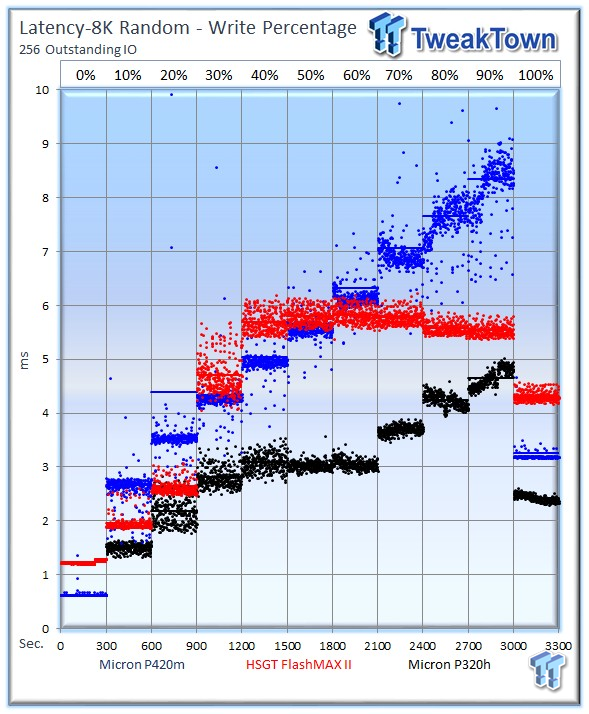
We witness the same increase in latency and variability for the P420m during the 8k mixed workload testing, while the FlashMAX II offers a tight predictable latency slope. The FlashMAX takes the win in our mixed workload testing.
Benchmarks - 128k Sequential Read/Write
128k Sequential Read/Write
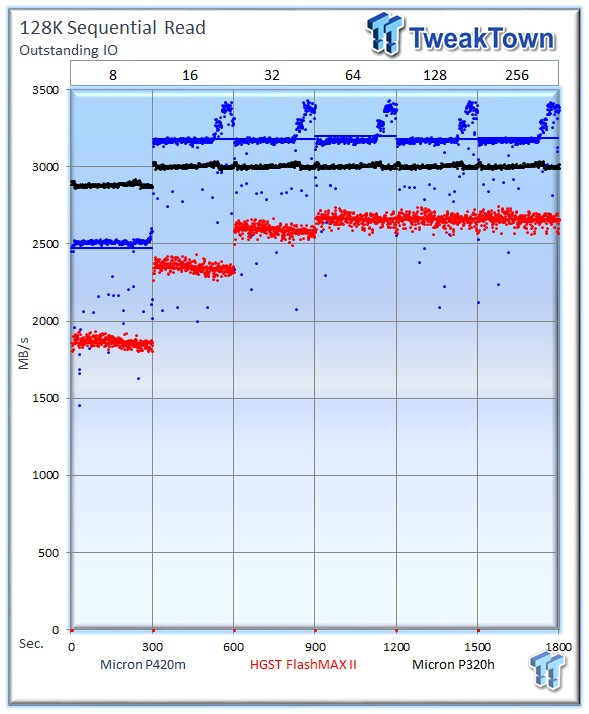
128k sequential speed reflects the maximum sequential throughput. The HGST FlashMAX II trails with an average of 2,664 MB/s at 256 OIO, the P420m leads with 3,186 MB/s, and the P320h averages 3,006 MB/s.
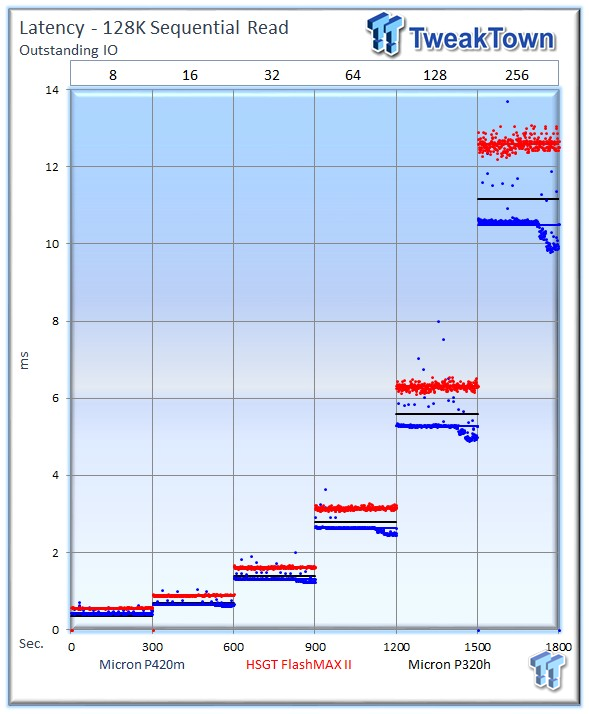
Latency testing reveals expected scaling.
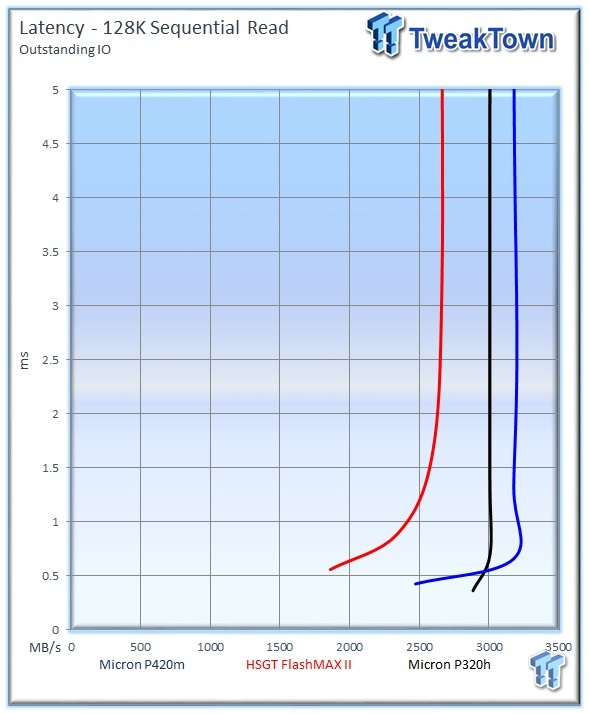
The Microns provide excellent Latency v MB/s performance.
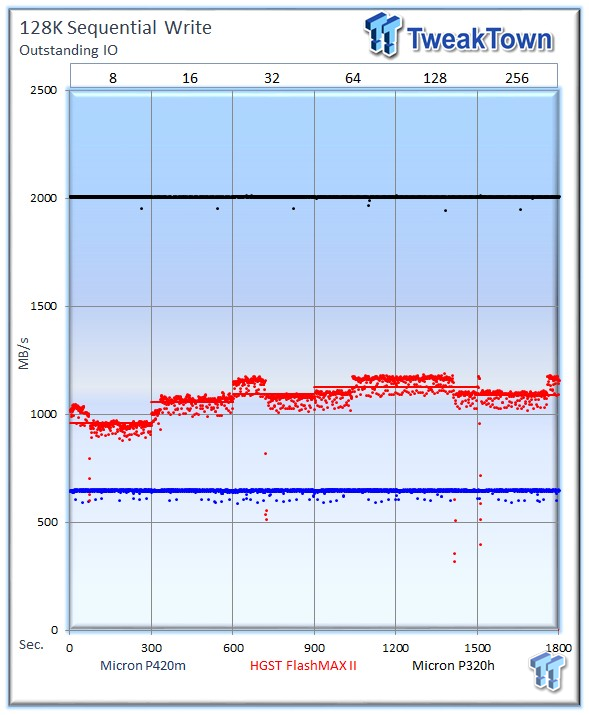
The HGST FlashMAX II writes at 1,091 MB/s at 256 OIO, the P320h leads with an impressive 2,007 MB/s, and the P420m brings in the rear with 647 MB/s.
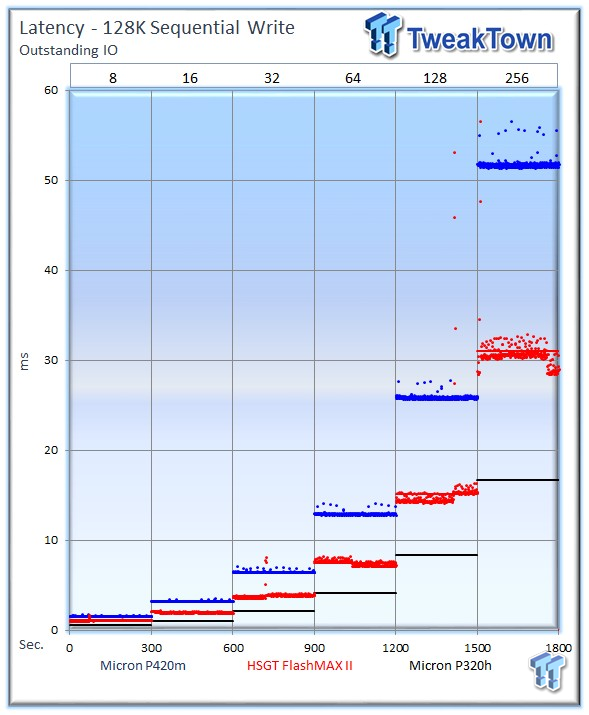
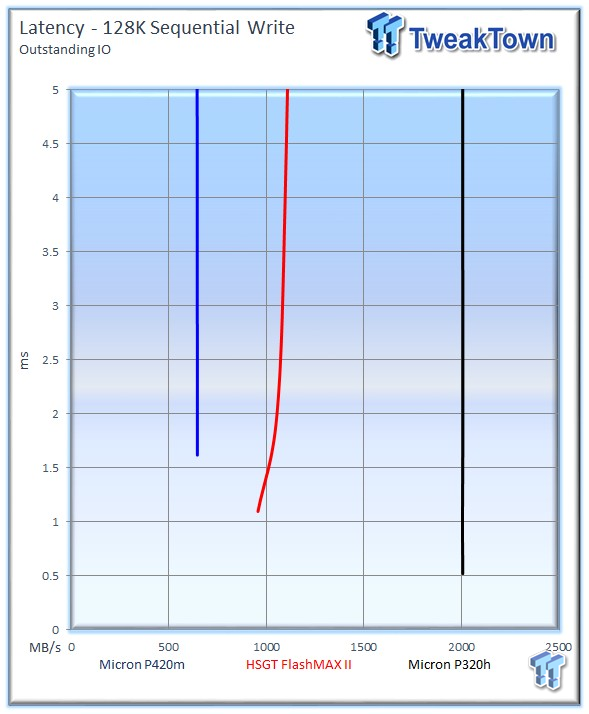
The HGST FlashMAX falls into the middle of the two Micron products, and the P320h exhibits wonderful latency from its SLC.
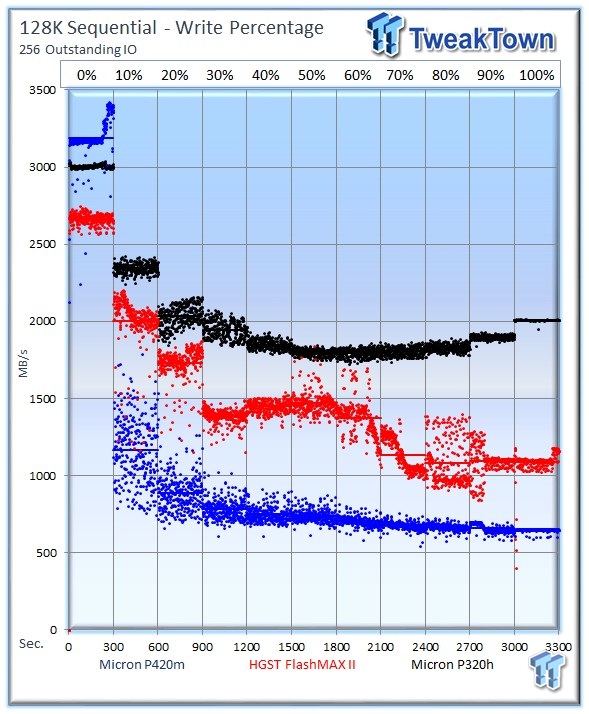
Write percentage-testing reveals that the FlashMAX II gets tantalizingly close to the P320h in 30 - 60% mixed workloads, but the P320h dominates the chart. The P420m leads in the pure read workload, but falls below the FlashMAX II quickly as we mix in more write activity. The FlashMAX takes the lead in mixed testing once again against its MLC competitor.
Database/OLTP and Web Server
Database/OLTP
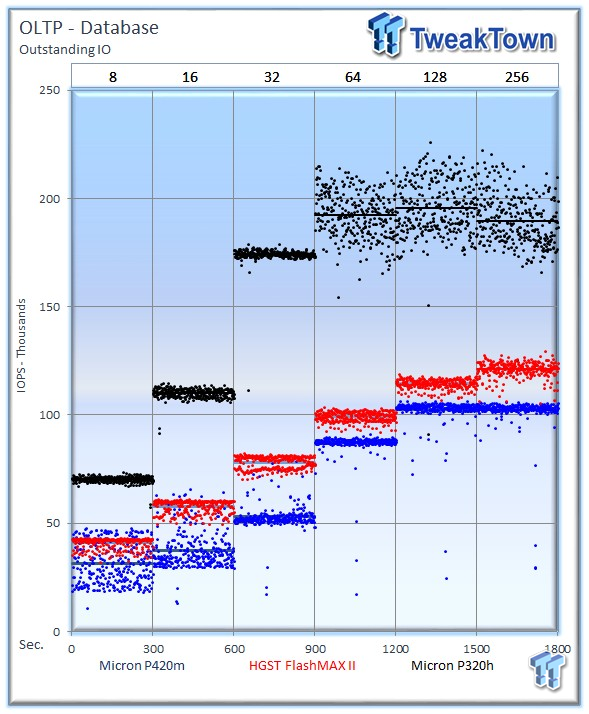
This test consists of Database and On-Line Transaction Processing (OLTP) workloads. OLTP is the processing of transactions such as credit cards and high frequency trading in the financial sector. Databases are the bread and butter of many enterprise deployments. These demanding 8k random workloads with a 66 percent read and 33 percent write distribution bring even the best solutions down to earth.
The HGST FlashMAX II leads the P420m with an average of 121,240 IOPS at 256 OIO, the Micron P420m averages 102,265 IOPS, and the P320h takes the lead with a peak speed of 195,688 IOPS at 128 OIO.
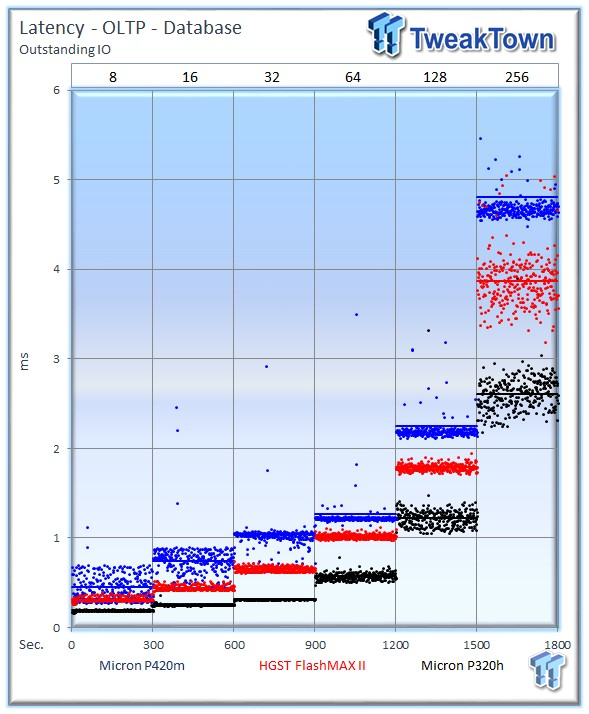
The FlashMAX II provides lower latency than the P420m.
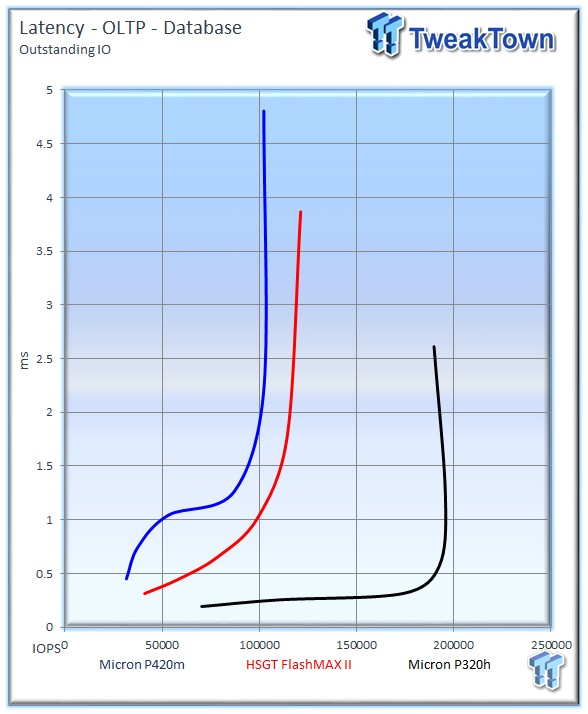
The FlashMAX II delivers 100,000 IOPS at 1ms, where the P420m only provides 50,000, but the SLC P320h astounds with 190,000 IOPS. The P420m closes the gap at 1.5ms with the FlashMAX II, but still lags behind.
RAID 0 Web Server
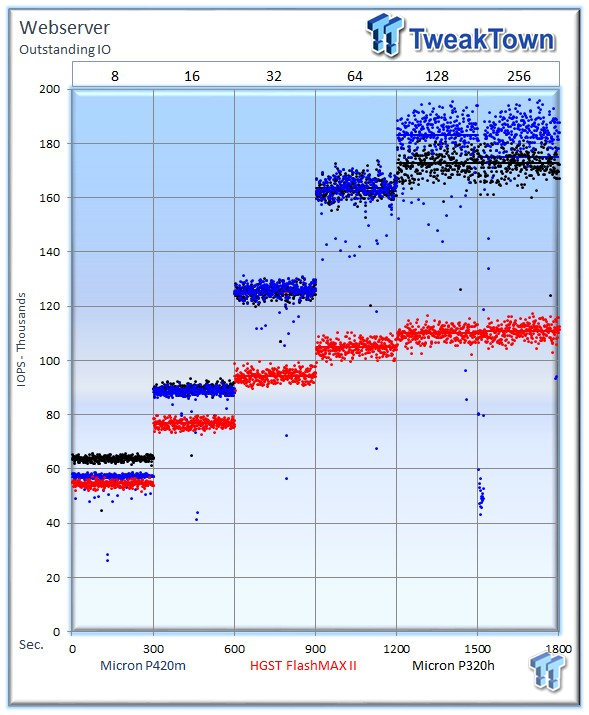
The Web Server workload is read-only with a wide range of file sizes. Web servers are responsible for generating content users view over the Internet, much like the very page you are reading. The speed of the underlying storage system has a massive impact on the speed and responsiveness of the server hosting the website.
The FlashMAX II lags behind with an average of 110,747 IOPS. The Microns leverage their intense read speed to deliver amazing performance. The P420m leads the test with 174,845 IOPS, followed closely by the P320h with 160,702 IOPS.
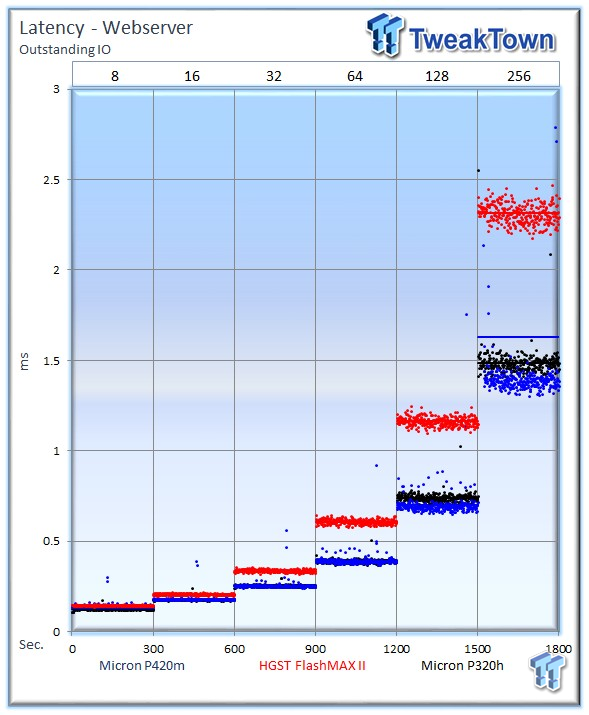
The P420m leads the test and scales well with increasing load.
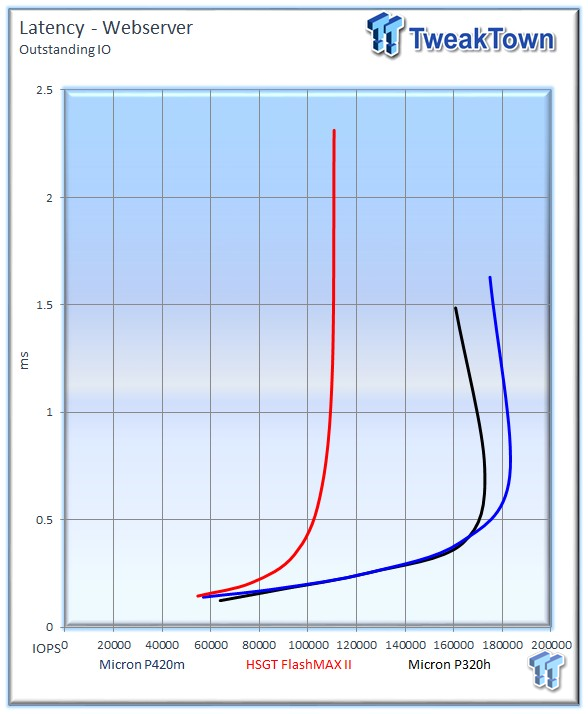
It is not surprising the Microns dominate this random read only test.
Email Server and File Server
Email Server
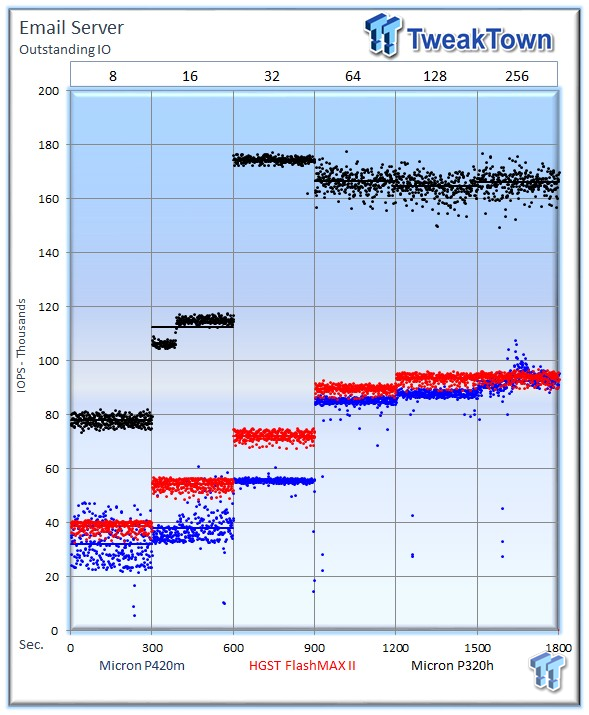
The Email Server workload is a demanding 8k test with a 50/50 read/write distribution. This application is indicative of performance in heavy random write workloads.
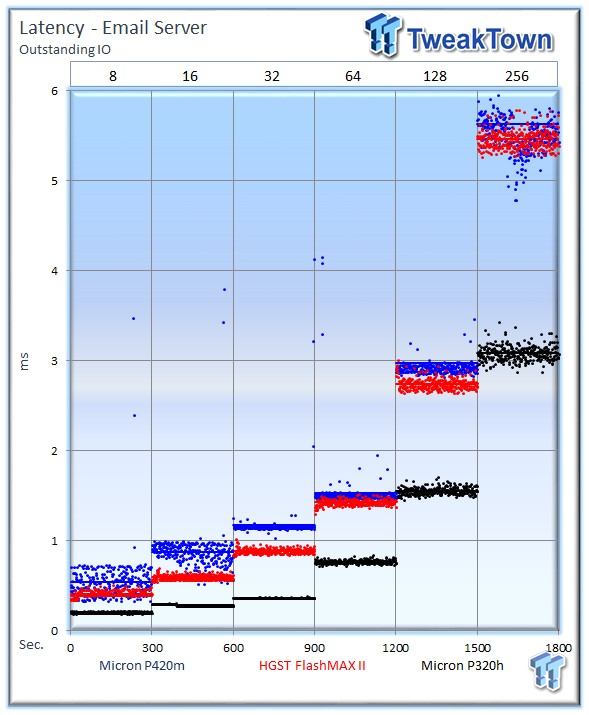
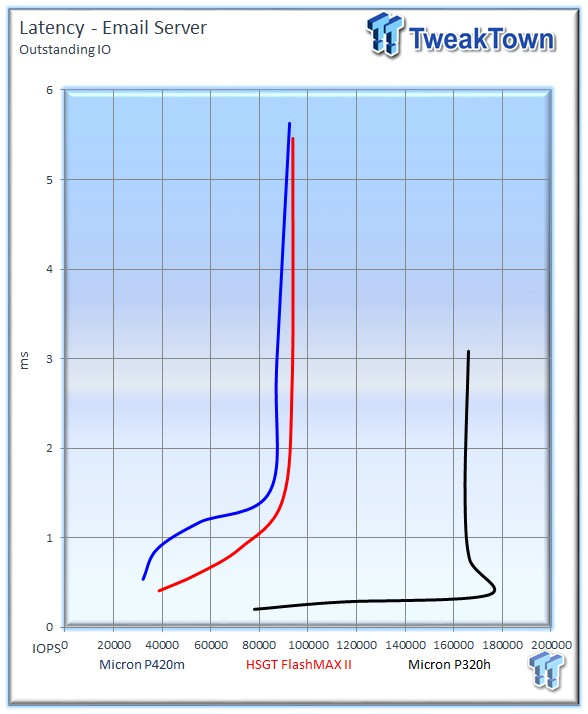
The FlashMAX II and P420m are in a dead heat at 256 OIO, with an average of 93,771 and 92,416 IOPS, respectively. The FlashMAX II does tend to scale better at the lower 8 - 32 OIO. The P320h averages 166,028 IOPS.
File Server
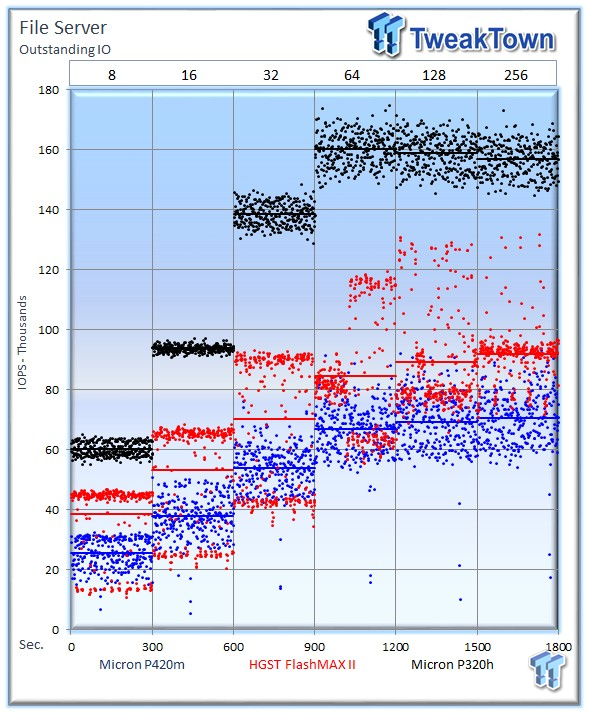
The File Server workload tests a wide variety of different file sizes simultaneously with an 80% read and 20% write distribution. The wide variety of simultaneous file size requests is very taxing on storage subsystems.
The HGST FlashMAX II experiences significant variability in this test and averages 91,820 IOPS at 256 OIO. The P420m also has difficulty with variability during this test and averages 70,574 IOPS. The P320h averages 157,040.
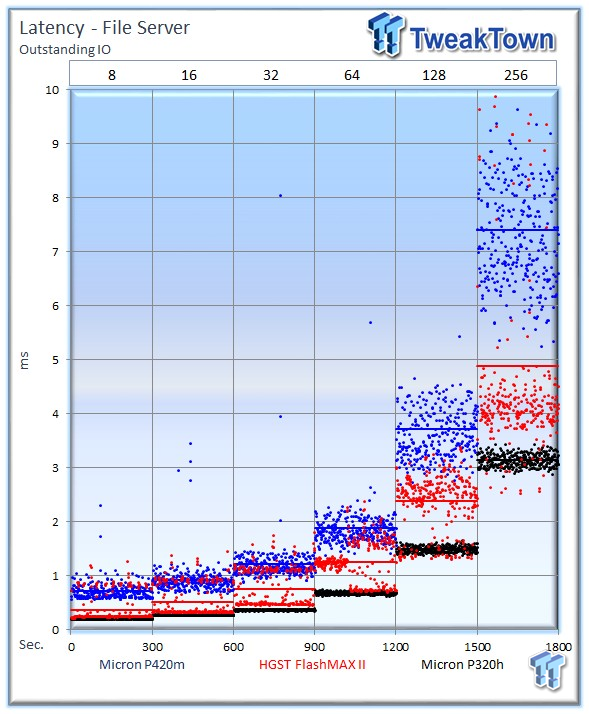
Both MLC competitors experience significant variability in this strenuous test.
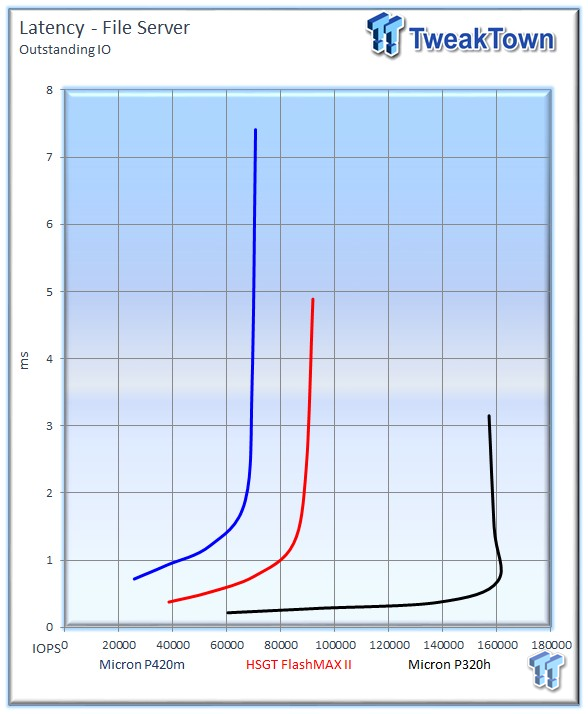
The FlashMAX II wins the test for MLC drives with 80,000 IOPS at 1ms, compared to 42,000 from the P420m. The P320h is off in a category of its own as it muscles its way through the workload.
Final Thoughts

New converged architectures are working their way down from hyperscale datacenters to mainstream deployments. Keeping flash close to the processor has always been the best way to reap low latency and high throughput advantages, and the rise of the server SAN is inevitable as flash spurs the migration of data into the host machine. Unfortunately, flash in the server can also create underutilized and isolated pools of storage capacity and performance. Hyperscale giants have the ability to create custom architectures, but the majority of environments require an easily deployed solution.
HGST has tackled the challenges of deploying flash with a holistic approach that focuses on innovative software offerings enabling full utilization of the flash resource. Through the functionality of FlashMAX Connect software, and the speed of RDMA, HGST products can extend their performance and capacity advantages beyond the host server and provide high availability and replication (vHA), sharing (vShare), and caching (vCache) to multiple servers and clustered applications. This helps vastly accelerate existing SAN architecture, or can even remove the need for a SAN.
The FlashMAX II is a mature product with an established history of reliability in the field. A visit to the Virident/HGST site reveals news of large-scale deployments with heavyweights such as LinkedIn, integration with leaders such as Gridstore, and a library of case studies. HGST is also constantly refining product features and compatibility, such as the recent announcement of the Oracle Validated Configuration for Real Application Clusters (RAC).
The FlashMAX II comes in a small HHHL form factor and packs impressive densities up to 4.8 TB. While the FlashMAX II doesn't deliver market-leading performance metrics, it is competitive with other solutions and focuses on performance in real-world applications.
When comparing results from our testing we have to mention the caveat that the SLC-powered P320h is not really a competing product for either of the MLC PCIe SSDs. The P320h was included as a frame of reference for SLC products. As much as we love SLC, the economics do not work for the majority of mainstream applications. We will focus on the two MLC competitors for our performance breakdown.
The FlashMAX II led in 4k random write workloads in comparison to the Micron P420m, but fell behind in read performance. In our mixed random workload testing the FlashMAX II led the P420m with a tighter and more consistent latency envelope. The P420m took the lead in sequential read activity. The FlashMAX II had an advantage in sequential write operations, which would be useful during replication tasks, and with mixed sequential workloads, the FlashMAX II delivered a convincing win.
The strength of the mixed workload performance was a bright spot for the FlashMAX II, and led to wins in OLTP, Email Server, and File Server workloads, while the P420m leveraged its random read speed to win the Web Server workload. We also noticed a propensity for the FlashMAX II to lead at lower loadings and queue depths. Overall, the FlashMAX II delivered great performance and consistent latency.
The only dark spot on the FlashMAX II is the three-year warranty period, nearly all competitors offer a five-year warranty period. Some might balk at the minimal host system overhead, but for most users the latency and software benefits enabled by the SCM architecture offsets the system requirements. The FlashMAX II features very competitive endurance and has an abundance of comprehensive and easy-to-use management tools.
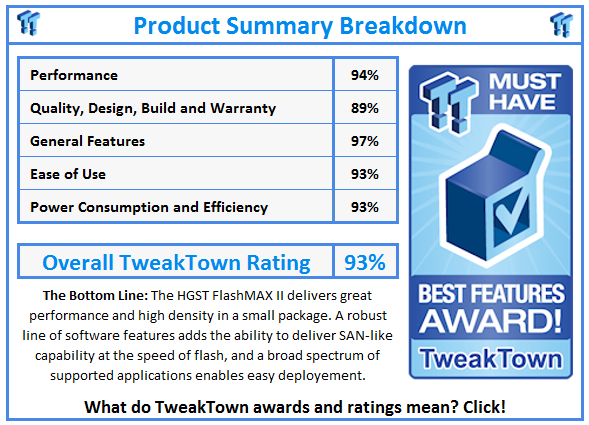
The most impressive aspect of the HGST FlashMAX II is the wealth of software features that allows the FlashMAX to deliver SAN-like capabilities at microsecond latencies. HGST remains fiercely competitive with their fab-enabled competitors through their feature-rich software and management utilities, meriting the TweakTown Best Features Award.

