Introduction
A cursory look at the latest enterprise SSD releases reveals a list of value-oriented storage offerings. As SSDs continue to gain wider acceptance in the datacenter, manufacturers have begun optimizing the price of the speedy storage devices to address mainstream applications.
The early transition to SSDs consisted of utilization of high-end drives in every application. When you have a high-performance hammer, every problem tends to look like a nail. This approach didn't mesh well with customers looking for the best value. Customers also aren't interested in purchasing unneeded performance and endurance. Administrators flocked to client SSDs, which featured less endurance but good-enough performance for the majority of workloads. SSD manufacturers noticed this trend, and customer feedback resulted in a re-thinking of the enterprise SSD product stack.
Enter the first wave of value SSDs. These value offerings merely consisted of cut-down versions of their higher-endurance brethren. Pairing the same controllers with less robust NAND and slimmed down feature sets created a new class of economical SSDs. Unfortunately, in many cases, the price difference between the high-end and mainstream/light-duty SSDs were slight.
As the enterprise SSD market matures, we are witnessing the emergence of true value-class SSDs in the market. This new breed of SSD, typically coming from foundry-enabled companies, is purpose-built from the ground up to fit very specific workloads. The Micron M500DC and Cloudspeed 1000E are good examples of SSDs built and tuned perfectly for read-centric and light workload applications.
After time, some flagship-class SSDs, designed to deliver the ultimate in endurance and performance, fall into a lower price class due to age or aggressive sales strategies. Savvy customers can pick up great deals on SSDs that feature higher endurance ratings and performance than value-class SSDs, but at a similar price.
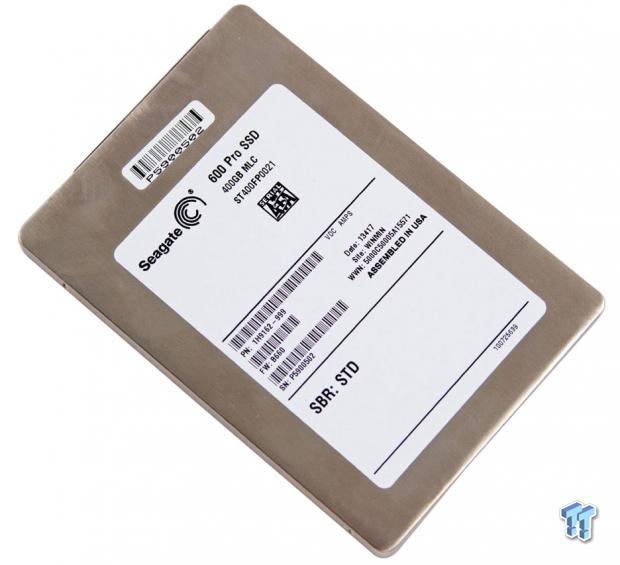
This brings us to the Seagate 600 Pro. We initially evaluated the Seagate 600 Pro in May of last year. The SSD performed well by leveraging a stable and proven platform with its LAMD LM87800AA controller. Custom Seagate firmware tuned the drive for enterprise use, and two distinct sub-classes within the 600 Pro family offered varying levels of endurance and random write performance. The high-endurance versions feature less available capacity, but offer much more endurance.
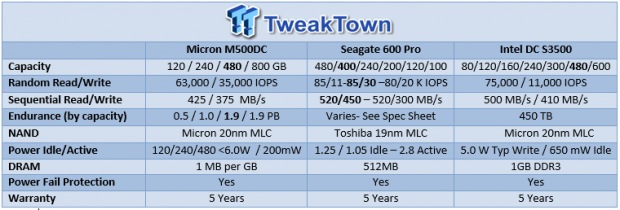
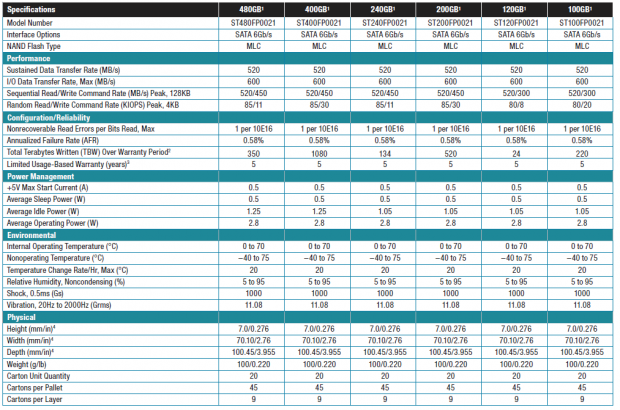
The 400GB Seagate 600 Pro features sustained sequential read/write speeds of 520/450 MB/s, and random read/write performance of 85,000/30,000 IOPS (in the capacity points with extra overprovisioning).
The 400GB version of the SSD sports an endurance rating of 1080TBW, compared to 350TBW of endurance with the 480GB model. The extra overprovisioning also brings random write performance up from 11,000 IOPS to 30,000 IOPS at this capacity. The Seagate 600 Pro also features all of the trimmings of an enterprise SSD, with tantalum capacitors to protect from power loss and a design that focuses on performance efficiency. The Seagate 600 Pro continues to lead as one of the most efficient SSDs on the market with an enviable IOPS-to-watts ratio.
Recently, the price of the 600 Pro series has dropped dramatically, sometimes encroaching upon $0.50/GB for the lower endurance models and $1.29/GB for the beefier versions with more overprovisioning. These low prices drop the 600 Pro series into competition with today's top value-class SSDs, but with the same performance and features that commanded a price with flagship high-endurance SSDs. The aggressive pricing merits a re-consideration of the 600 Pro, and today we will test it against the current crop of value-class SSDs to gauge how it competes in the market.
PRICING: You can find the Seagate 600 Pro for sale below. The prices listed are valid at the time of writing but can change at any time. Click the link to see the very latest pricing for the best deal.
Canada: The Seagate 600 Pro (400GB) retails for CDN$549.99 at Amazon Canada.
Seagate 600 Pro Internals and Specifications
Seagate 600 Pro Internals
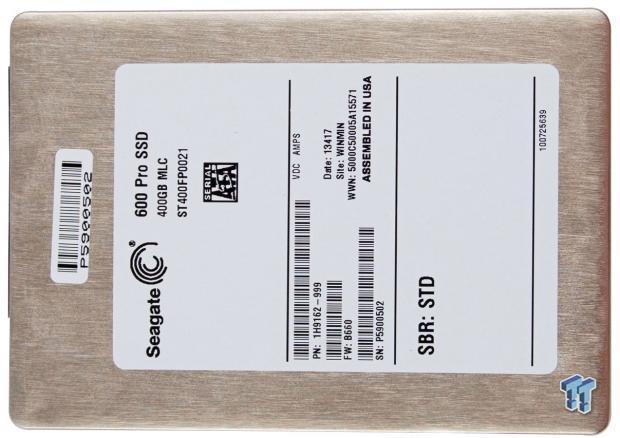
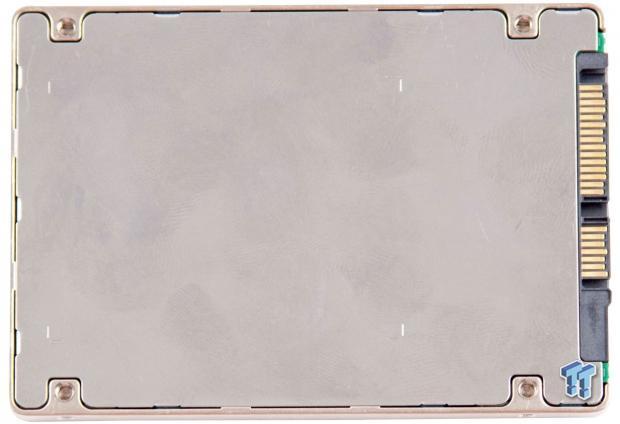
The Seagate 600 Pro comes in a 2.5-inch 7mm metallic casing and features a robust anti-intrusion system, making it nearly impossible to open the SSD without destroying the case.
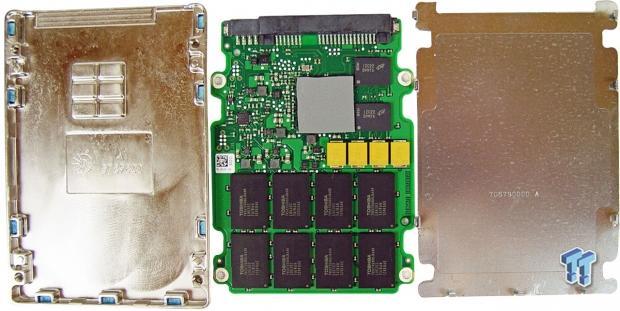
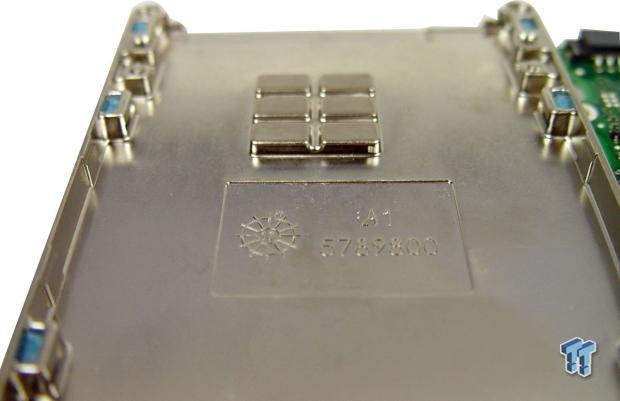
We observe the four yellow tantalum caps underneath the controller, which comes with a thick thermal pad. These provide enough power to flush the DRAM cache and commit all data in-flight down to the NAND. Six metal blocks rise up from the case to rest on the thermal pad and controller, allowing for easy heat dissipation into the thick metallic casing. This provides the SSD with a longer lifespan in high-heat scenarios.
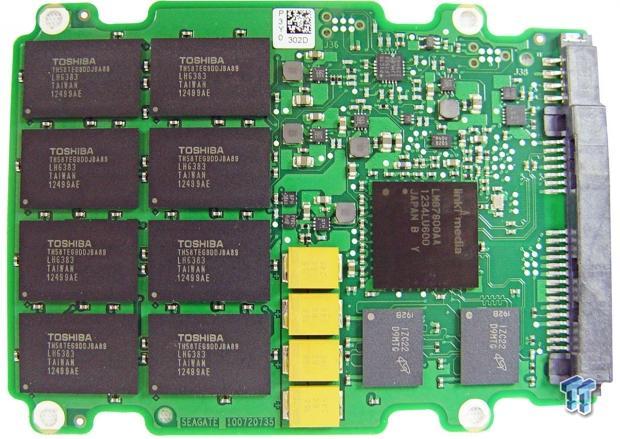
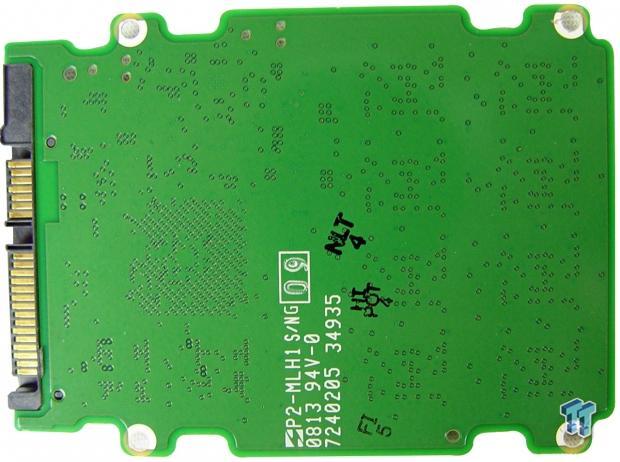
The Seagate 600 Pro has eight packages of Type C Toshiba 19nm MLC NAND. These are 64GB packages with 16k page sizes. Two Micron DRAM chips totaling 512MB of capacity flank the LAMD LM87800 controller.
Seagate 600 Pro Specifications
The Seagate 600 Pro is powered by 19nm Type C Toshiba MLC NAND and the LAMD Amber controller, providing an UBER of 1 per 10^16. Tantalum capacitors provide protection from host power loss issues, and 512MB of cache is used for internal drive management. A wide range of capacity points provides a scalable solution for those seeking different requirements of performance and overprovisioning. The 600 Pro also boasts tremendous IOPS-per-Watt efficiency that leads even the most robust flagship-class SSDs.
Test System and Methodology

Our approach to storage testing targets long-term performance with a high level of granularity. Many testing methods record peak and average measurements during the test period. These average values give a basic understanding of performance, but fall short in providing the clearest view possible of I/O Quality of Service (QoS).
'Average' results do little to indicate performance variability experienced during actual deployment. The degree of variability is especially pertinent as many applications can hang or lag as they wait for I/O requests to complete. This testing methodology illustrates performance variability, and includes average measurements, during the measurement window.
While under load, all storage solutions deliver variable levels of performance. While this fluctuation is normal, the degree of variability is what separates enterprise storage solutions from typical client-side hardware. Providing ongoing measurements from our workloads with one-second reporting intervals illustrates product differentiation in relation to I/O QoS. Scatter charts give readers a basic understanding of I/O latency distribution without directly observing numerous graphs.
Consistent latency is the goal of every storage solution, and measurements such as Maximum Latency only illuminate the single longest I/O received during testing. This can be misleading, as a single 'outlying I/O' can skew the view of an otherwise superb solution. Standard Deviation measurements consider latency distribution, but do not always effectively illustrate I/O distribution with enough granularity to provide a clear picture of system performance. We utilize high-granularity I/O latency charts to illuminate performance during our test runs.
Our testing regimen follows SNIA principles to ensure consistent, repeatable testing. We measure power consumption during precondition runs. This provides measurements in time-based fashion, with results every second, to illuminate the behavior of power consumption in steady state conditions. We also present IOPS-to-Watts measurements to highlight efficiency.
We utilize SSDs with different capacity points for this evaluation. The 400GB Seagate Pro, the 480GB Micron M500DC, and the 480GB Intel DC S3500 are tested over their full LBA ranges to highlight performance at maximum utilization. The first page of results will provide the 'key' to understanding and interpreting our test methodology.
Benchmarks – 4k Random Read/Write
4k Random Read/Write
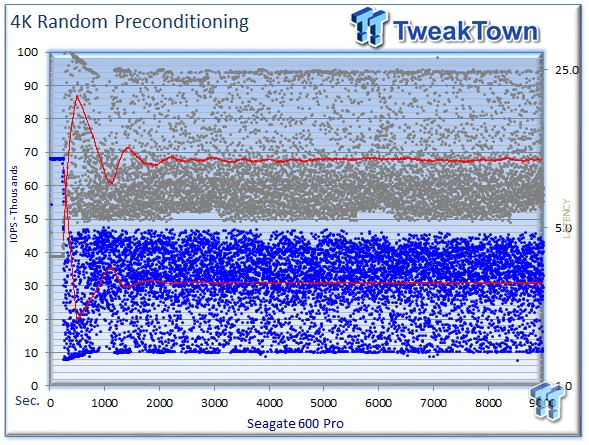
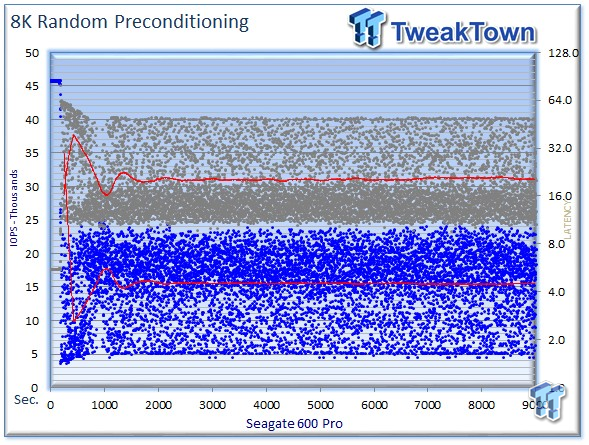
We precondition the 400GB Seagate Pro for 9,000 seconds, or two and a half hours, receiving performance reports every second. We plot this data to illustrate the drive's descent into steady state.
This dual-axis chart consists of 18,000 data points, with the IOPS on the left and the latency on the right. The red dots signify IOPS, and the grey dots are latency measurements during the test. We place latency data in a logarithmic scale to bring it into comparison range. The lines through the data scatter are the average during the test. This type of testing presents standard deviation and maximum/minimum I/O in a visual manner.
Note that the IOPS and latency figures are nearly mirror images of each other. This illustrates that high-granularity testing can give our readers a good feel for latency distribution by viewing IOPS at one-second intervals. This should be in mind when viewing our test results below. This downward slope of performance only occurs during the first few hours of use, and we present precondition results only to confirm steady state convergence.
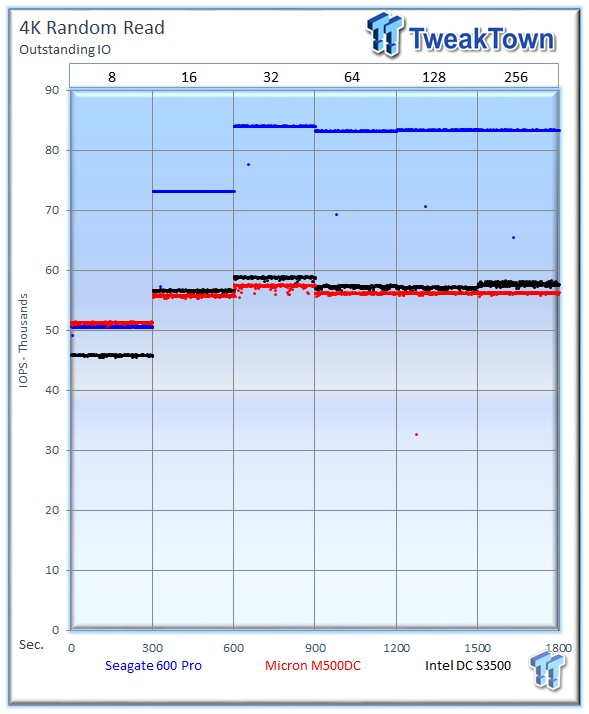
Each level tested includes 300 data points (five minutes of one second reports) to illustrate performance variability. The line for each OIO depth represents the average speed reported during the five-minute interval. 4k random speed measurements are an important metric when comparing drive performance, as the hardest type of file access for any storage solution to master is small-file random. One of the most sought-after performance specifications, 4k random performance is a heavily marketed figure.
The Seagate 600 Pro begins our testing with an outstanding 83,355 IOPS. The Micron M500DC averages 56,259 IOPS at 256 OIO, and the Intel DC S3500 averages 57,769 IOPS.
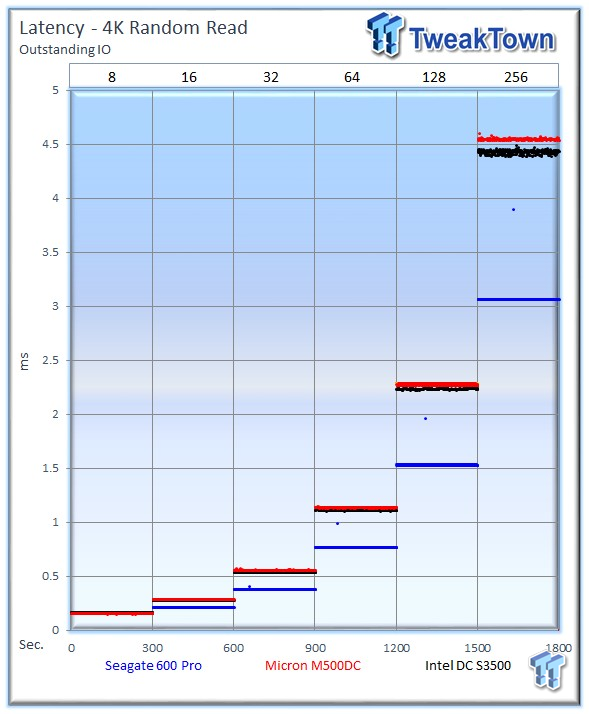
The 600 Pro leverages its terrific 4k random speed to deliver the lowest latency during random read activity.
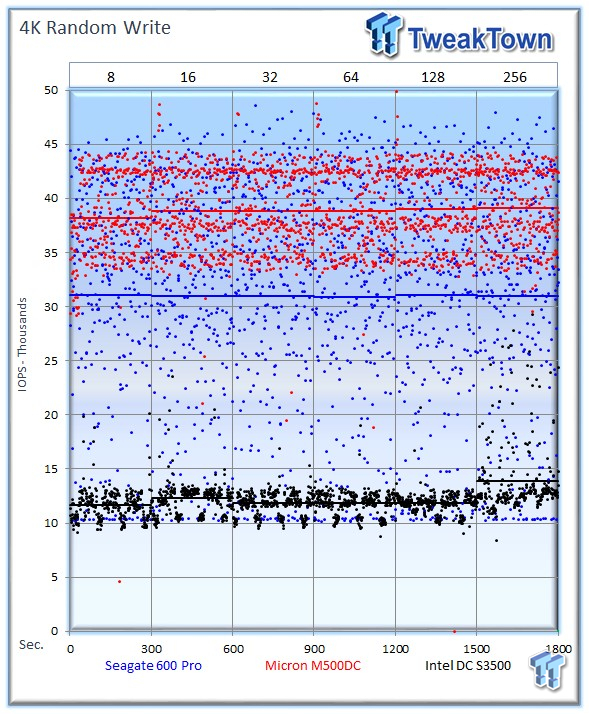
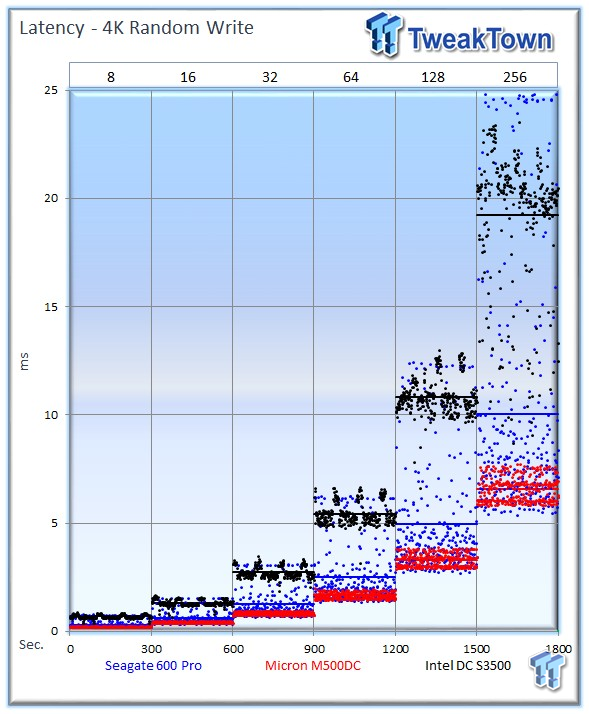
Garbage collection routines are more pronounced in heavy write workloads, leading to performance variability.
The Seagate 600 Pro falls into second place against the M500DC with an average of 30,991 IOPS. The Micron M500DC distances itself from the pack with an outstanding average of 39,089 IOPS, and the Intel DC S3500 averages 13,841 IOPS.
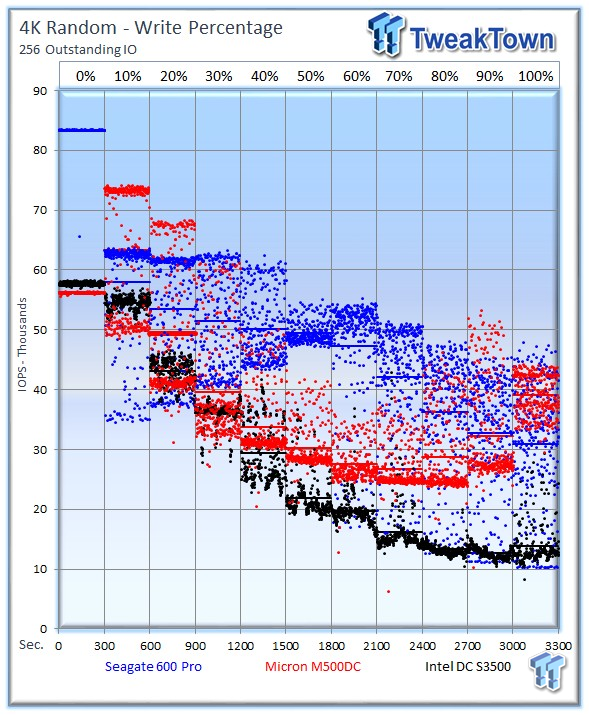
Our write percentage testing illustrates the varying performance of each solution with mixed workloads. The 100% column to the right is a pure write workload of the 4k file size, and 0% represents a pure 4k read workload. Mixed workload testing reveals strengths, and weaknesses, that remain hidden during typical tests. In reality, much of the real-world data is going to feature mixed data.
The Seagate 600 Pro leverages its outstanding read speed to jump to an early lead in the test. As we mix in more write activity, the 600 Pro delivers leading performance until we reach a 90% write mixture. Overall, the 600 Pro scores very well, with its LAMD controller winning nine of 11 tests.
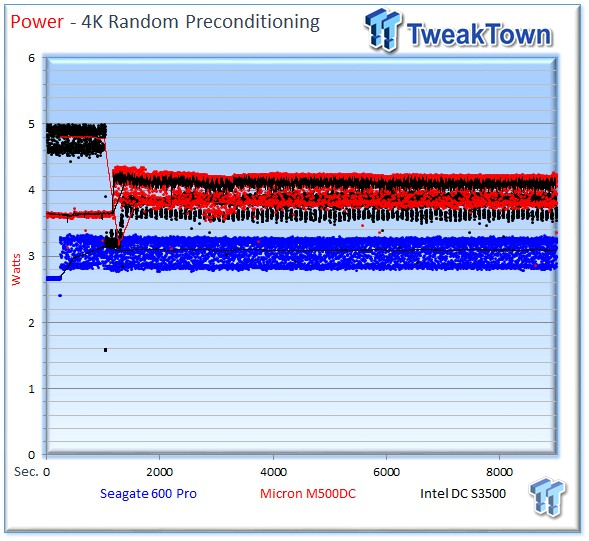
We record the power consumption measurements during our precondition run. We calculate the stated average results during the last five minutes of the test, after the device has settled into steady state.
A particular strength of the 600 Pro is its frugal power consumption, measured during this test at a low 3.2 watts. The M500DC averages 4.09 watts, and the DC S3500 averages 3.8 watts during the measurement window.
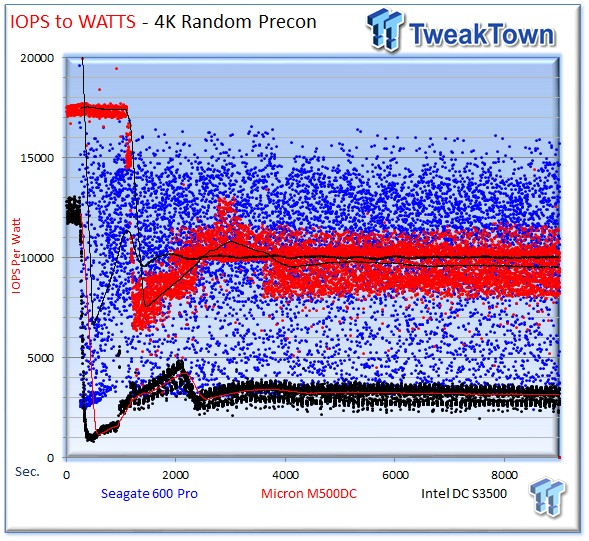
IOPS-to-Watts measurements are generated from data recorded during our precondition run, and the stated average is from the last five minutes of the test. We measure efficiency during write activity, and it is important to note that many SSDs are spec'd with IOPS-to-Watts figures during read activity.
The 600 Pro averages an even 10,000 IOPS-per-Watt, besting the M500DC with its average of 9,545 IOPS-per-Watt; the DC S3500 averages 3,125.
Benchmarks – 8k Random Read/Write
8k Random Read/Write
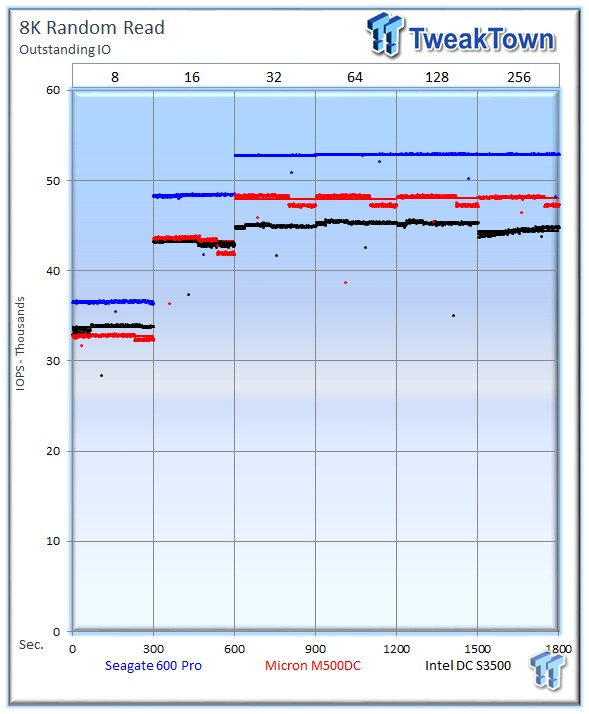
Server workloads rely heavily upon 8k performance, and we include this as a standard with each evaluation. Many of our server workloads also test 8k performance with various mixed read/write workloads.
Once again, the Seagate 600 Pro leads with its excellent random read performance of 52,946 IOPS at 256 OIO. The average 8k random read speed of the Micron M500DC is 48,034 IOPS at 256 OIO, and the Intel DC S3500 measures 44,444 IOPS.
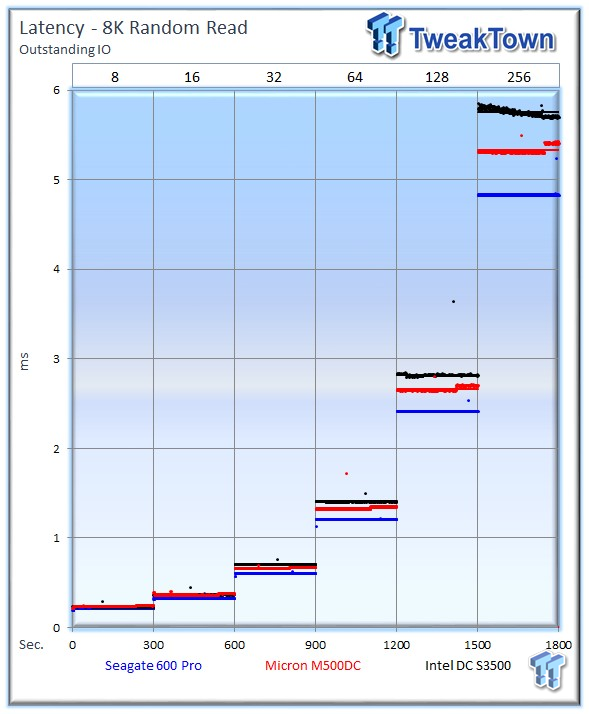
All three SSDs exhibit a tight latency range during the 8k random read test, with the 600 Pro taking a comfortable lead.
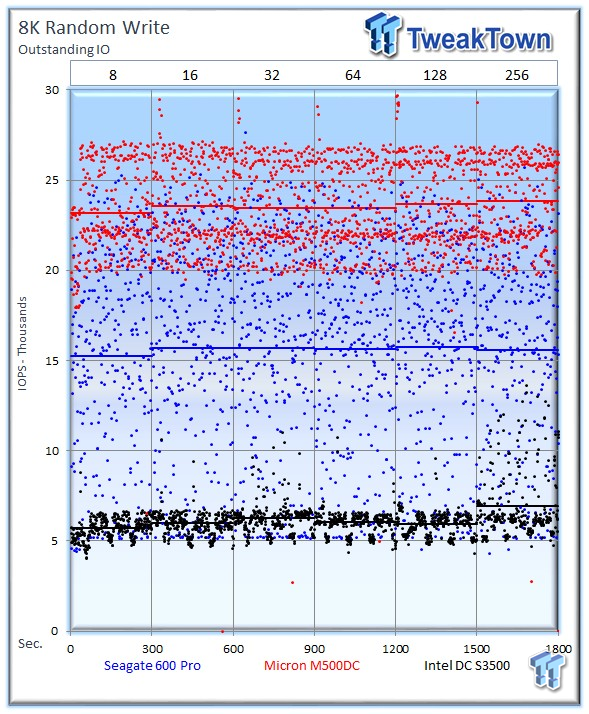
The Seagate 600 Pro averages 15,552 IOPS with 256 OIO, while the M500DC easily leads with an average of 23,852 IOPS. The DC S3500 averages 6,937 IOPS.
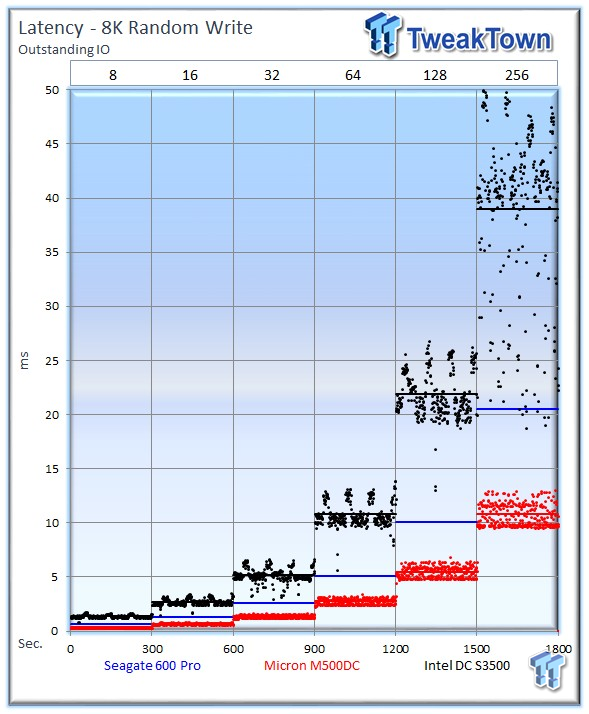
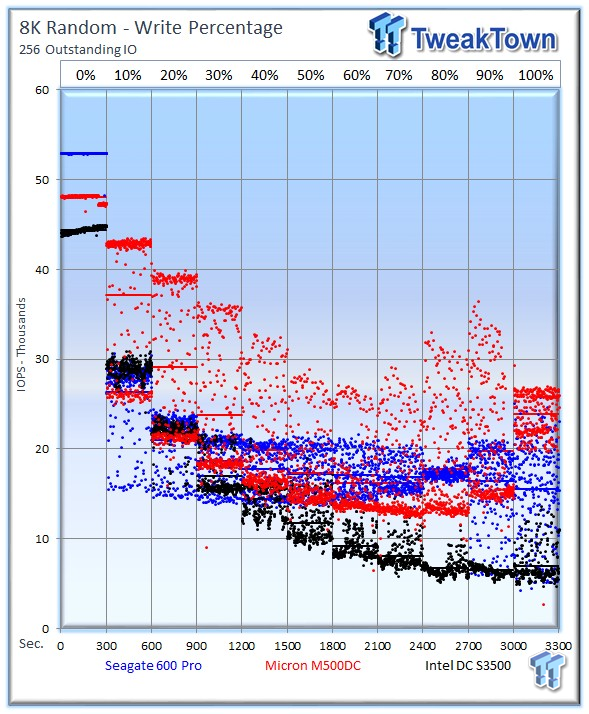
The M500DC leads the 8k mixed workload testing for the majority of the test. The 600 Pro takes the lead from 40-80%, while the DC S3500 has a tighter performance profile; it is well below the M500DC and 600 Pro.
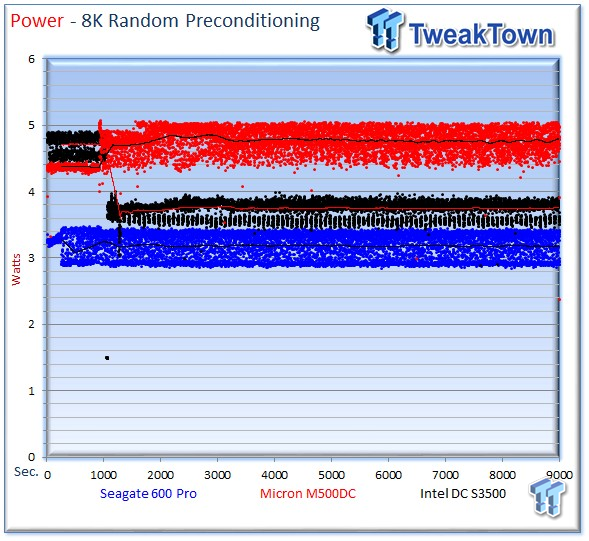
The 600 Pro continues its exceptionally low power consumption with an average of 3.17 watts. The M500DC averages 4.77 watts, and the DC S3500 averages 3.75 watts during the measurement window.
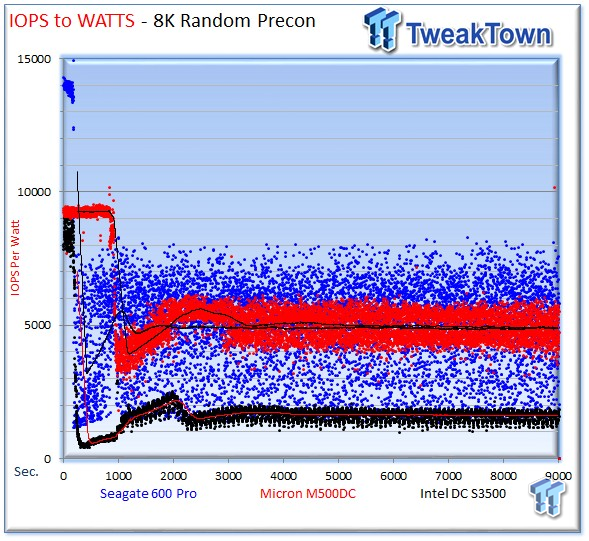
The 600 Pro edges out the competition with an average of 4,896 IOPS-per-Watt. The M500DC trails slightly with 4,877 IOPS-per-Watt, and the DC S3500 averages 1,584 IOPS-per-Watt.
Benchmarks - 128k Sequential Read/Write
128k Sequential Read/Write
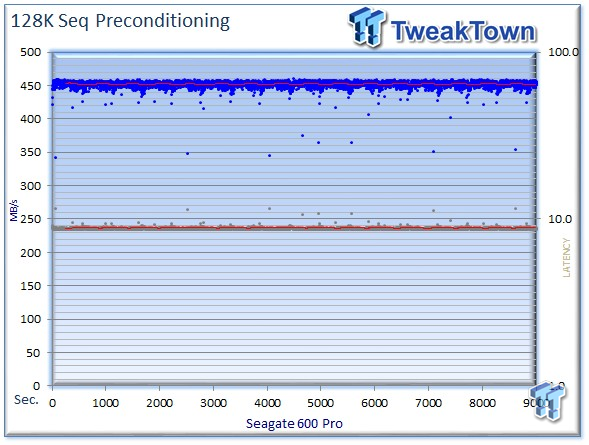
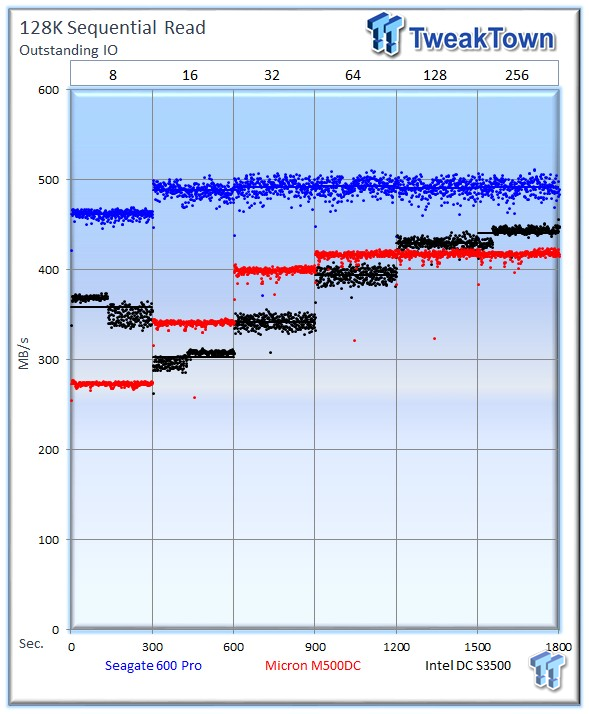
128k sequential speed reflects the maximum sequential throughput of the SSD. The Seagate 600 Pro averages 491 MB/s, but does so even at relatively light loadings. The Micron M500DC averages 417 MB/s at 256 OIO, and the Intel DC S3500 delivers an average of 441 MB/s.
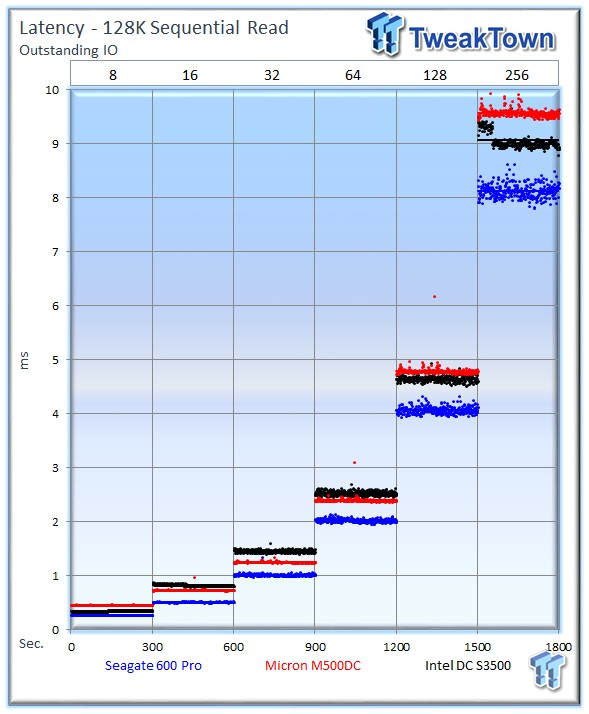
The 600 Pro provides the lowest overall latency.
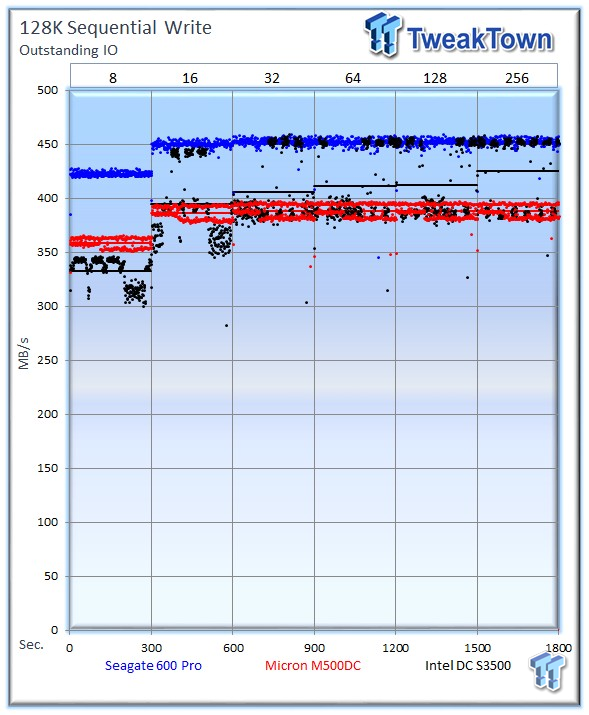
The Seagate 600 Pro provides excellent sequential write speed at 452 MB/s. The M500DC averages 388 MB/s, and the DC S3500 averages 424 MB/s.
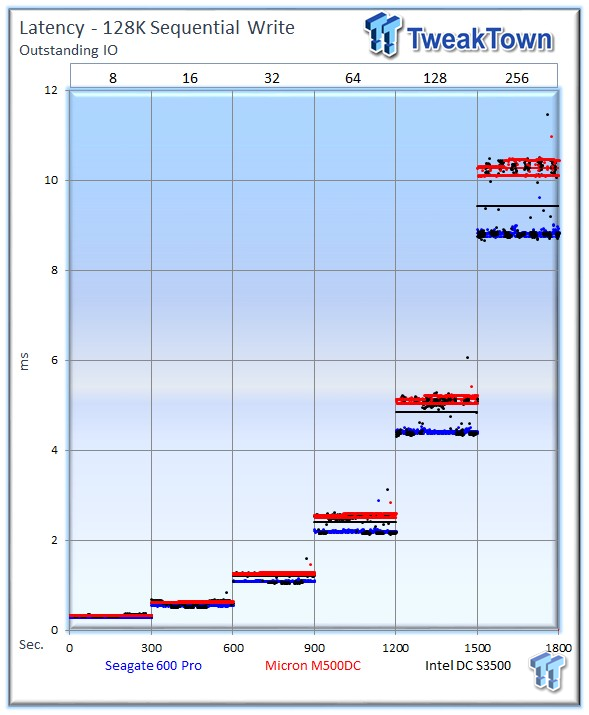
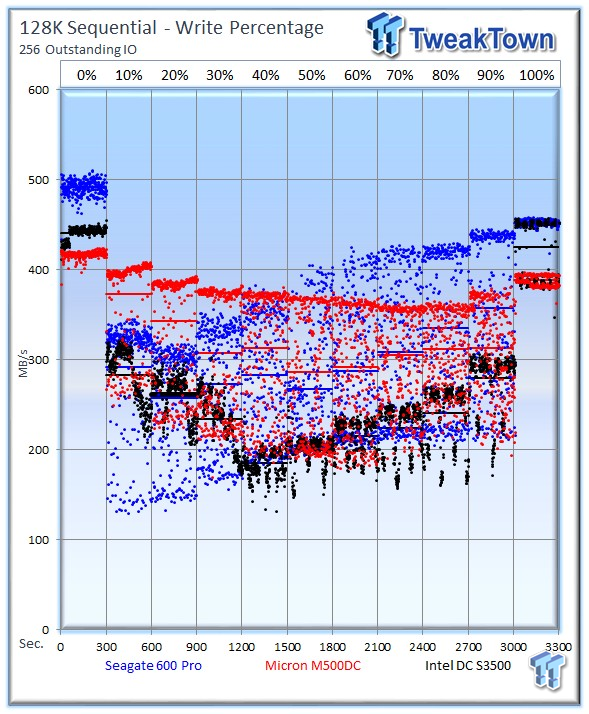
The M500DC exerts its dominance in mixed sequential workloads, winning the majority of the tests.
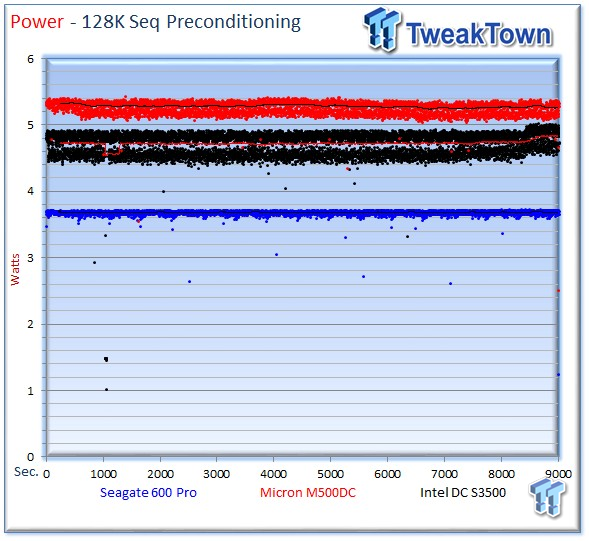
The Seagate 600 Pro averages 3.67 watts, well below the competing SSDs. The M500DC averages 5.24 watts, and the DC S3500 averages 4.83 watts.
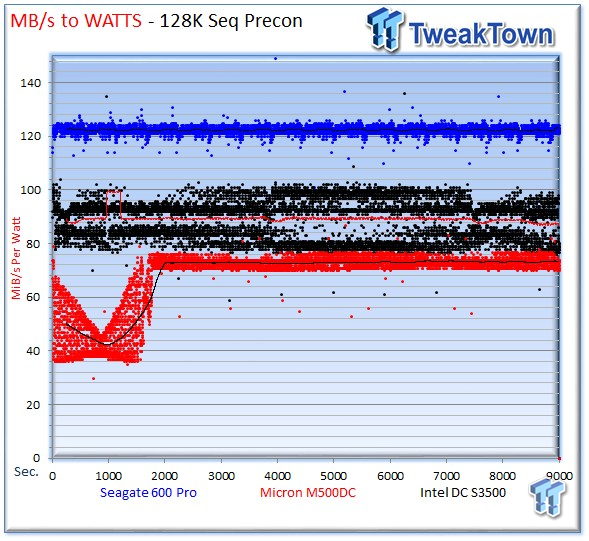
The Seagate 600 Pro averages 122 MB/s per watt. The M500DC averages 73 MB/s per watt, and the DC S3500 averages 87 MB/s per watt.
Benchmarks - Database/OLTP and Web Server
Database/OLTP
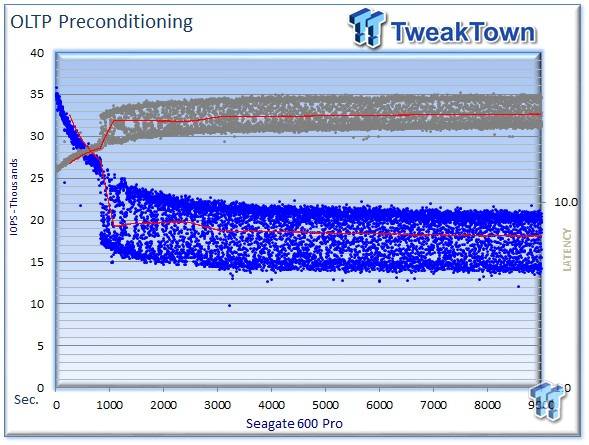
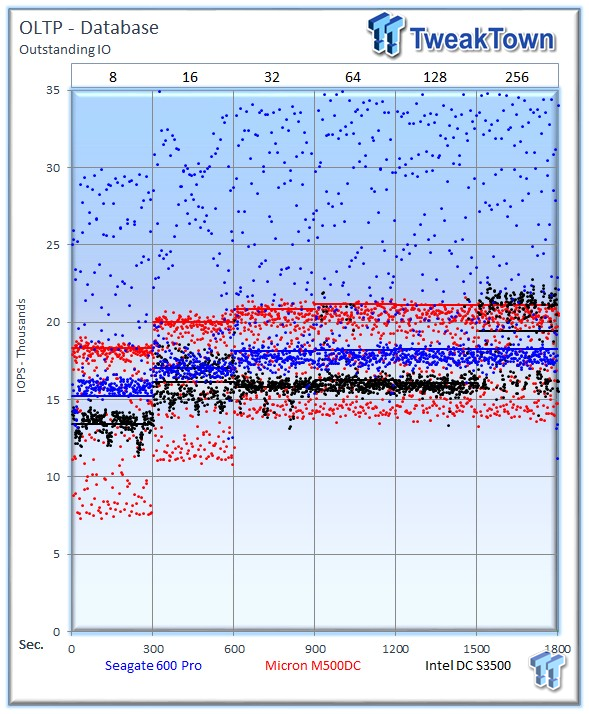
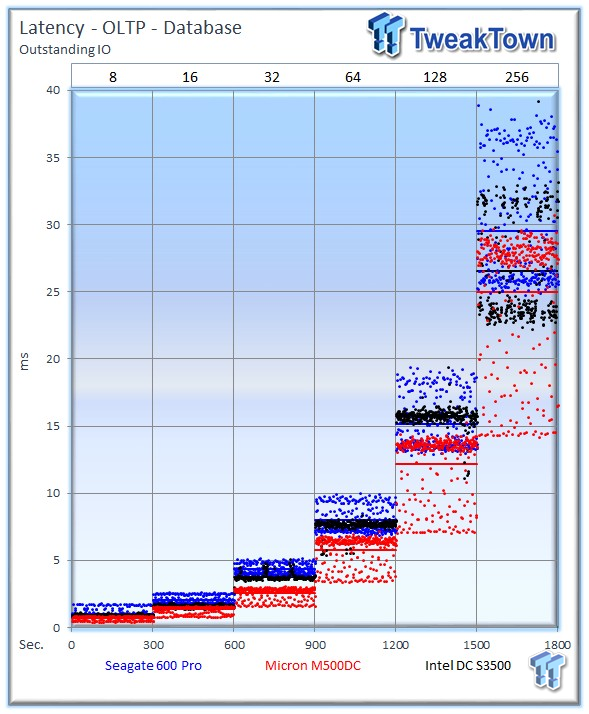
This test emulates Database and On-Line Transaction Processing (OLTP) workloads. OLTP is the processing of transactions such as credit cards and high frequency trading in the financial sector. Databases are the bread and butter of many enterprise deployments. These demanding 8k random workloads with a 66 percent read and 33 percent write distribution bring even the best solutions down to earth.
The Seagate 600 Pro averages 18,278 IOPS. The Micron M500DC tops the chart with an average of 21,133 IOPS, and the Intel DC S3500 averages 19,400 IOPS at 256 OIO. The 600 Pro experiences the largest amount of variability with this workload.
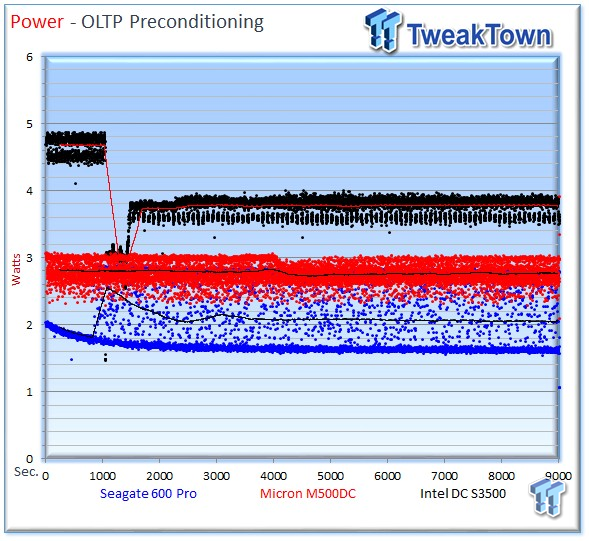
The 600 Pro averages 2.04 watts. The M500DC averages 2.76 watts, and the DC S3500 averages 3.76 watts.
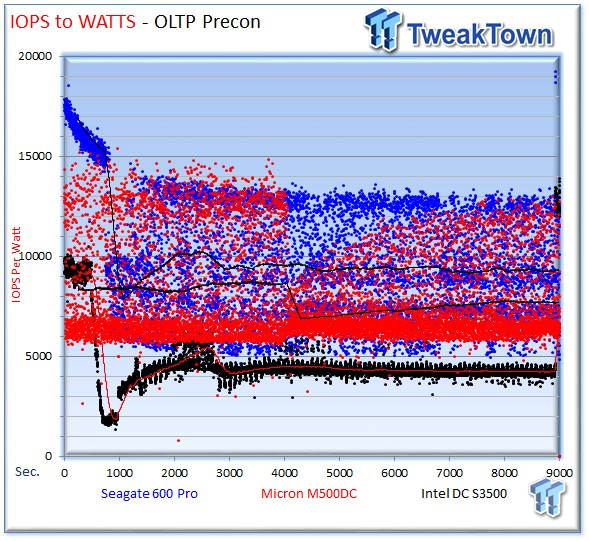
The 600 Pro leads convincingly with 9,286 IOPS-per-Watt. The M500DC averages 7,676 IOPS-per-Watt, and the DC S3500 averages 4,040 IOPS-per-Watt.
Web Server
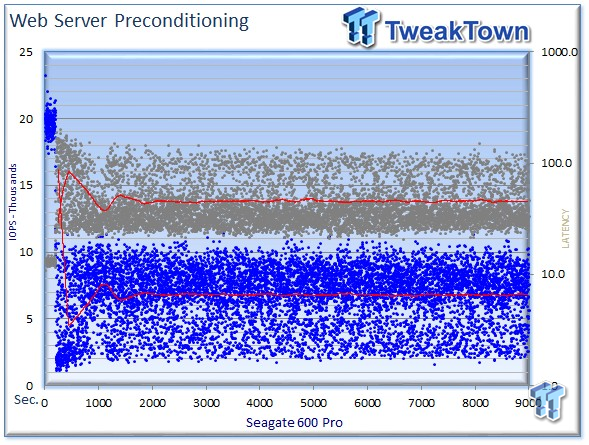
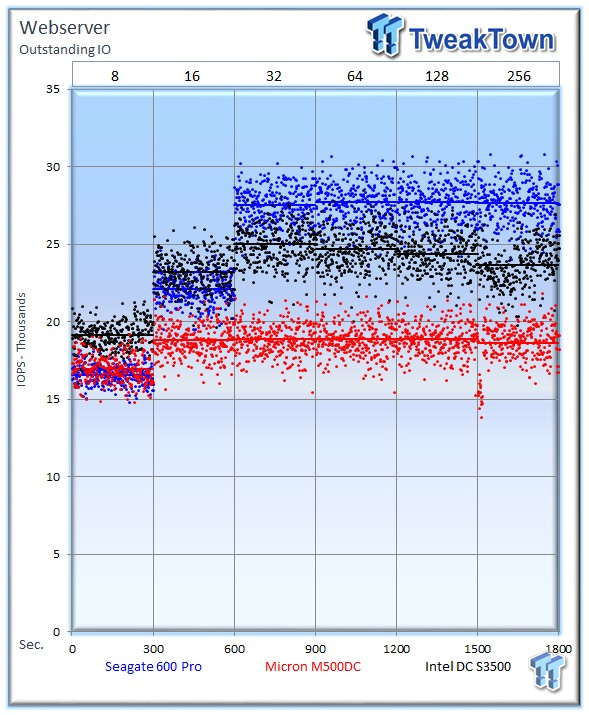
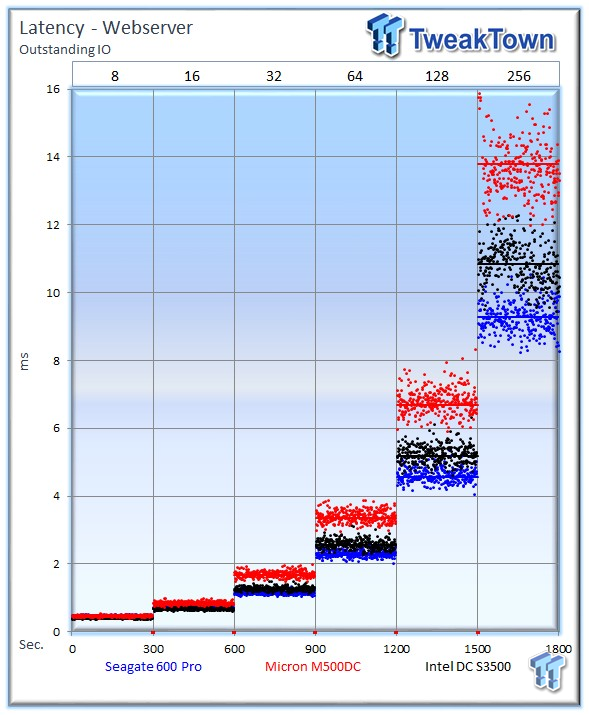
The Web Server profile is a read-only test with a wide range of file sizes. Web servers are responsible for generating content users view over the Internet, much like the very page you are reading. The speed of the underlying storage system has a massive impact on the speed and responsiveness of the server hosting the website.
The Seagate 600 Pro averages 27,669 IOPS. The M500DC doesn't fare nearly as well and averages 18,650 IOPS, falling to the DC S3500's average of 23,664 IOPS.
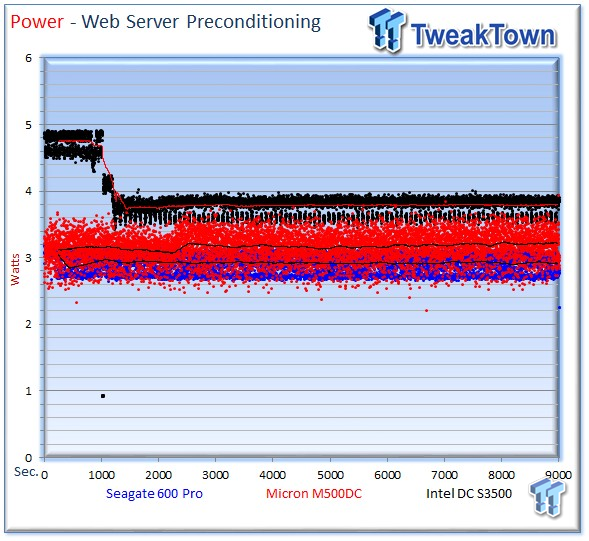
The 600 Pro averages 2.91 watts. The M500DC averages 3.21 watts, and the DC S3500 requires 3.8 watts during the Web Server workload.
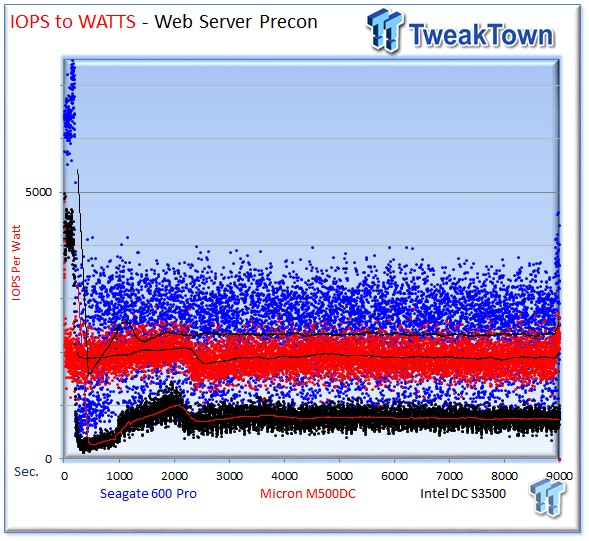
The Seagate 600 Pro averages 2,477 IOPS-per-Watt. The M500DC scores 1,965 IOPS-per-Watt, and the DC S3500 averages 749.
Benchmarks – Email Server
Email Server
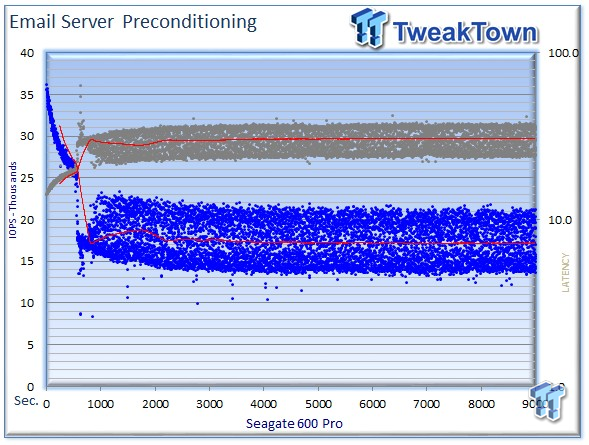
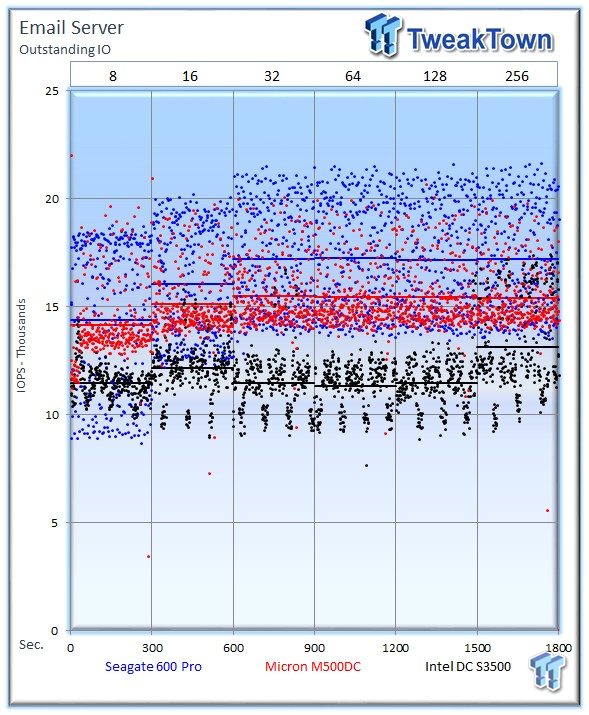
The Email Server profile is a demanding 8k test with a 50% read and 50% write distribution. This application is indicative of the performance in heavy write workloads.
The Seagate 600 Pro averages 17,187 IOPS at 256 OIO. The Micron M500DC averages 15,403 IOPS, and the Intel DC S3500 averages 13,121 IOPS at 256 OIO.
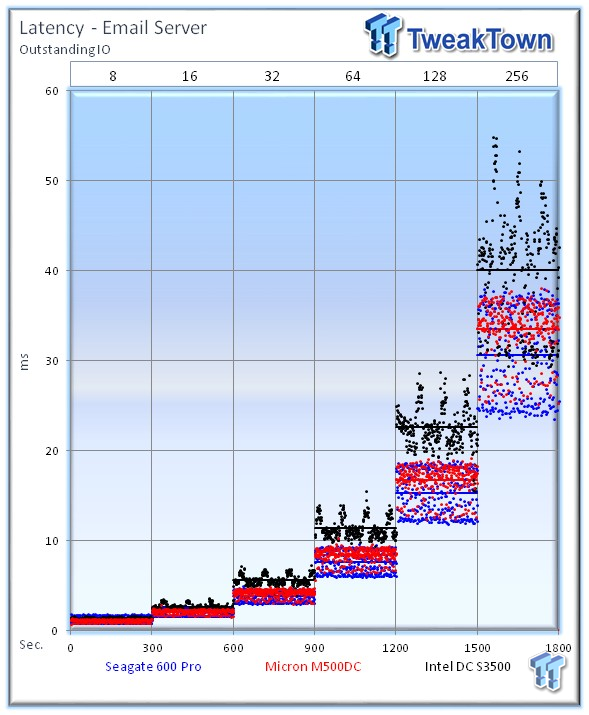
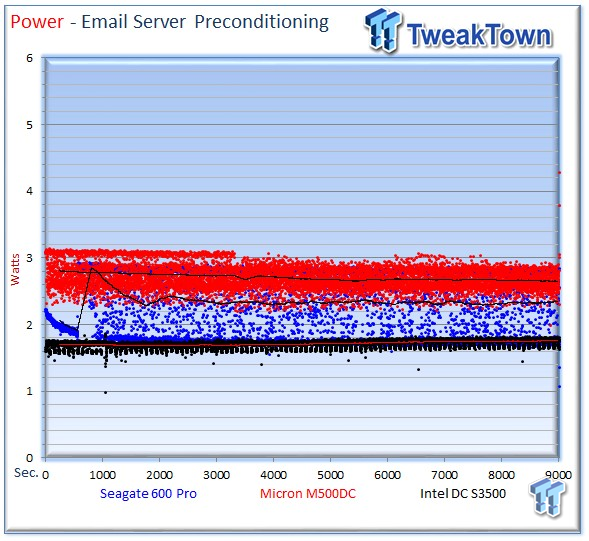
The Seagate 600 Pro averages 2.34 watts. The M500DC averages 2.66 watts, and the DC S3500 averages 1.75 watts.
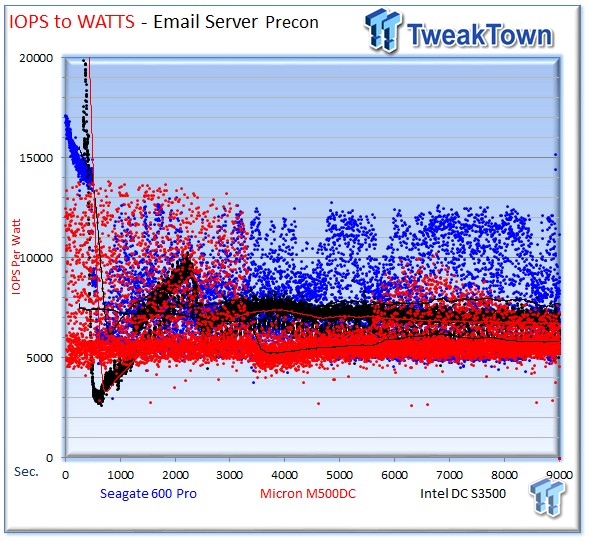
The 600 Pro closes out our testing with 7,689 IOPS-per-Watt. The M500DC averages 5,806 IOPS-per-Watt, and the DC S3500 scores 6,705 IOPS-per-Watt.
Final Thoughts
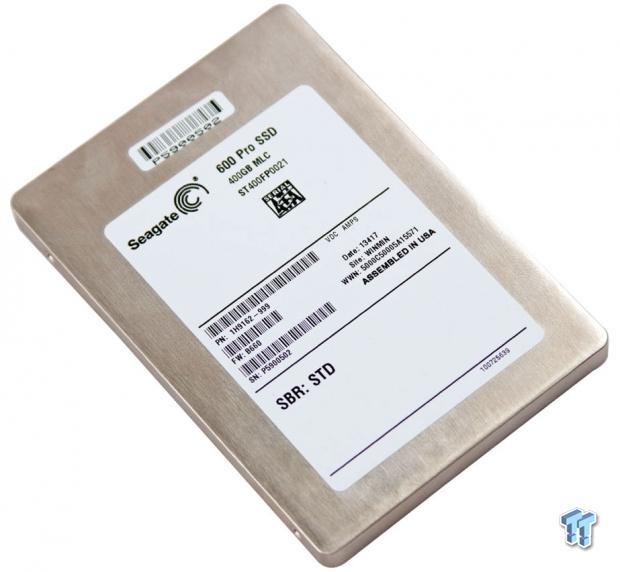
The world of technology moves quickly, and that has been most apparent in the transition to solid state drives. Seagate has continued to leverage third-party LAMD controllers for an extended period to power their enterprise SSD offerings. Seagate and LAMD have enjoyed a long relationship; Seagate actually invested in LAMD during their early development.
Recently, it was announced that Seagate purchased the SandForce controller Flash Controller Division (FCD) and the Nytro Accelerated Solutions Division (ASD) from Avago, though both units originated with LSI prior to their acquisition from Avago. This drastically alters the future of Seagate SSD offerings, and for the better. Bringing the talent in-house from an SSD controller juggernaut such as SandForce is a big win, and the ASD division is currently the world's second largest supplier of PCIe flash solutions.
Pairing these acquisitions with a strategic NAND supply agreement with Samsung gives Seagate a formula for success. Combining the new offerings with Seagate's tremendous sales and distribution channels spells almost certain SSD market expansion for Seagate.
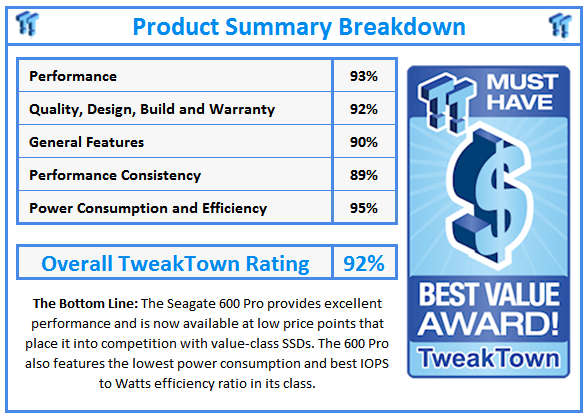
In the interim, Seagate still has solid enterprise SSD offerings. The Seagate 600 Pro is designed to be a flagship-class product, and it offers performance and features that are in line with that expectation. Recently, the price of the 600 Pro has dropped radically, allowing them to compete with value SSDs. Current pricing trends are placing the heavily overprovisioned models at roughly $1.45/GB, and the standard versions of the 600 Pro can be found for as low as $0.60 cents/GB.
The 600 Pro excels in read-centric workloads, easily leading in 4k and 8k random workloads. In pure random write scenarios, the 600 Pro was bested by the Micron M500DC, which has stellar random write performance. In our mixed workload testing, we found the 600 Pro to offer robust performance above competing drives in our test pool, winning nine of 11 tests in the mixed 4k workload.
The Seagate 600 Pro also provides great performance in our server workloads, leading the pack in the Email and Web Server profiles, but trailing the M500DC in the OLTP workload. Sequential performance was impressive, and even under low loadings, the 600 Pro delivered excellent performance. Its performance in mixed sequential was also solid, but scored slightly below the M500DC.
The Seagate 600 Pro really separates itself from the competition when it comes to power consumption and efficiency. Its design is focused on providing the best IOPS-to-Watts ratio on the market, and it delivers in that respect. Its power consumption was regularly lower than competing drives, and the IOPS-to-Watts ratio led the test pool.
The 600 Pro features a robust design and enterprise-class features, such as Tantalum capacitors for power hold up. Overall, the 600 Pro is a sold offering from a trusted company in the storage industry. The five-year warranty of the 600 Pro follows the industry standard, and the new lower price point of the 600 Pro makes it a very competitive solution.
PRICING: You can find the Seagate 600 Pro for sale below. The prices listed are valid at the time of writing but can change at any time. Click the link to see the very latest pricing for the best deal.
Canada: The Seagate 600 Pro (400GB) retails for CDN$549.99 at Amazon Canada.

