


Introduction
Intel has introduced the Intel DC S3700 SSD (DC denotes 'data center' and S 'SATA) into the enterprise with the intentions of revolutionizing the way that end-users evaluate storage performance. With a new proprietary controller at the helm and optimized firmware, Intel has promised to deliver an unrivaled level of performance consistency. The focus on the latency of the SSD, and not maximum speed, promises to provide more predictable and reliable performance over the long term.
Performance variability can rob applications of performance. Individual 'hangs' and lags from outlying I/O can significantly affect application performance simply because applications are forced into waiting for the next I/O to complete. High-end enterprise storage solutions have a reputation for delivering predictable performance, and Intel looks to extend this to the world of enterprise SSDs.
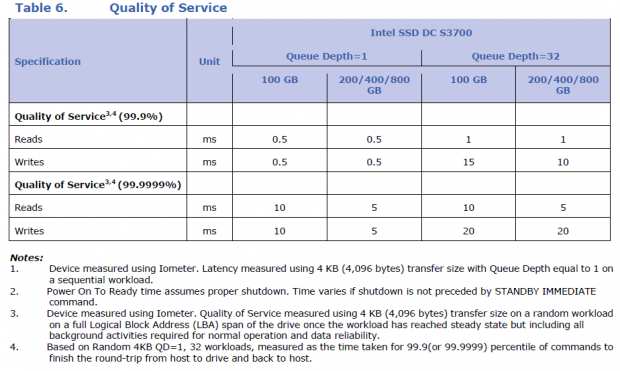
Intel has set forth in their specifications that a QD32 4K random write workload will result in 99.9% of write requests requiring less than 10ms. For a QD1 4k random write workload, Intel also claims that 99.9999% percent of commands will be at, or under, 0.5ms. While the QD1 statistic is not relevant in many enterprise applications, it speaks volumes to the emphasis that Intel placed on ensuring the most efficient data delivery. Intel also notes that IOPS will not vary by more than 10-15% during the life of the SSD.
Intel sacrifices some of the overall speed in order to deliver this consistency, yet still manages to double the read speed and deliver a 15x random write performance increase over the previous generation Intel 710. The 710 also featured the same 25nm HET (High-Endurance Technology) NAND as the DC S3700, so the enhancements in speed and consistency are provided by the new controller and firmware. This lack of significant performance variability makes this SSD uniquely well suited for RAID arrays, where the RAID controller is constrained to the speed of the slowest I/O.
HET-MLC is a key component in the architecture, delivering 10 DWPD (Drive Writes per Day) of endurance for five years. This doubling of endurance from the previous generation SSD equates to 14.6 Petabytes of endurance for the 800GB model and 7.3PB at the 400GB capacity point. This endurance is backed up by a five year warranty.
Dynamically adjusting the NAND over the course of its life and enhanced NAND management techniques help to reduce the wear on the SSD. The DC S3700's endurance rating of 10 DWPD is for worst-case scenarios that consist of full span random writes. In applications with only pseudo-random or sequential data writes, this number can be much higher. The increase in endurance is a critical improvement that will help low-cost SSDs gain wider acceptance among the enterprise crowd.
Prohibitive pricing of SSDs in the past has hampered their mass deployment into datacenters. With each successive SSD generation we have experienced cost reductions, and part of Intel's goal with the DC S3700 to bring the price of datacenter SSDs down to an acceptable price point. As a byproduct, SSDs are getting closer to a level playing field with high-performance HDDs.
Our Latest SSD Review Coverage
- Micron 6600 ION 245.76TB Enterprise SSD Review - Best in Class Programming Speeds
- Memblaze PBlaze 7 7A40 Ocean 61.44TB Enterprise SSD Review - Oceans of QLC at 3.3 million IOPS
- KIOXIA CD9P-R 7.68TB E3.S Review - The Best-In-Class Data Center SSD
- DapuStor Roealsen6 R6060 E1.L 245.76TB SSD Review - Massive Capacity with Fast Retrieval
- Phison Pascari X200P 7.68TB Enterprise SSD Review - Sequential Read Champion
The winning recipe for price reduction comes in the form of the IMFT (Intel/Micron Flash Technologies) joint venture with Micron. Leveraging the lower price points that come with physically creating the NAND allows Intel to undercut competitors that lack foundries on the price front. Intel took a similar path with the Intel 910, which helped to drastically alter the price structure of PCIe application accelerators. The MSRP of the Intel DC S3700 SSDs is a mere $2.35 per GB. This is going to put a squeeze on margins for competitors and spur wider adoption of SSDs into the enterprise.
Intel DC S3700 Architecture
The consistent performance of the DC S3700 is due to the new Intel controller, the PC29AS21CA (an 8-Channel ASIC) and the firmware being designed for low latency optimization.
Part of the improved performance results are from the firmware employing a new type of indirection table. Intel switched from utilizing a compressed binary tree system to a fully uncompressed 1:1 mapping of the NAND flash. This eliminates the need for defragmentation of the mapping table and reduces associated I/O latency concerns. In order to access such a large indirection table quickly, Intel keeps this 'map' located in the 1GB of ECC DDR3-1333 DRAM (on the 800GB model). The large tables do necessitate more cache for the SSD, with varying capacities of DRAM on each model.
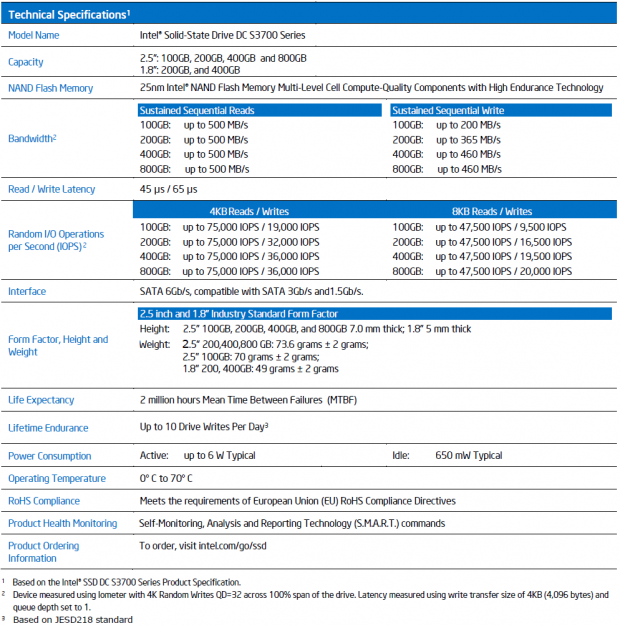
The 6Gb/s controller provides sequential read and write speeds of 500/460 MB/s, respectively, for the 800GB model. The SSD also features 75,000 random read IOPS and 36,000 random write IOPS. The write speeds do scale with various capacity points.
The SSD comes in both 1.8" and 2.5" 7mm form factors, with the 1.8" devices intended for high-density blade and micro-server applications. Power consumption is slated at up to 6W (typ) and an idle of 650mW. The 2.5" SSDs can pull power from either 5V and 12V rails, or both simultaneously. This is a new approach that we have not seen from prior Intel SSDs. The 1.8-inch model only utilizes the 3.3V rail.
Enhanced power protection comes in the form of two radial electrolytic capacitors (rated for 105C at 3.5V/47uF) that take a unique approach of placement into a cutout section of the PCB. These capacitors flush data in-transit to the NAND in the event of a host power-loss issue. The SSD features self-diagnostics of the capacitor, and upon failure of the capacitor will automatically switch the SSD into write-through mode. Users can also monitor the capacitor via SMART data.
Protecting data is job number one and Intel has taken several steps to protect user data, with CRC (Cyclic Redundancy Checks), firmware and logical block address verification built into the firmware. CRC consists of a hash tag used to validate data and identify data corruption. This protects the data from its original issuance, through the various levels of internal cache (SRAM and DRAM), and down to the NAND. AES-256 bit encryption support rounds out the feature set.
We are also including Intel's new QoS specifications, which are a first for an Intel SSD. Suggested retail prices are as follows:
2.5-inch form factor
$235 - 100GB
$470 - 200GB
$940 - 400GB
$1,880 - 800GB
(based on 1,000-unit quantities)
1.8-inch form factor
$495 - 200GB
$965 - 400GB
(based on 1,000-unit quantities)
Intel DC S3700 Internals
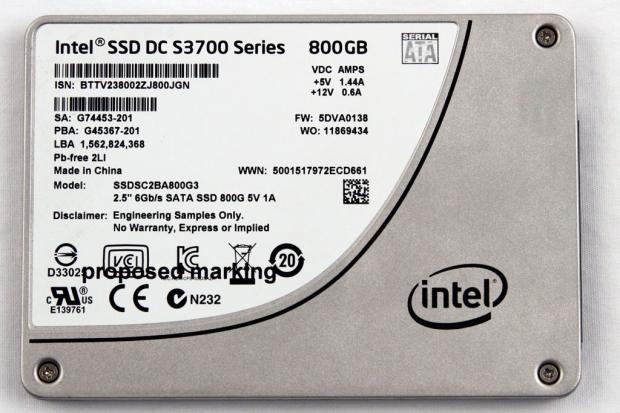
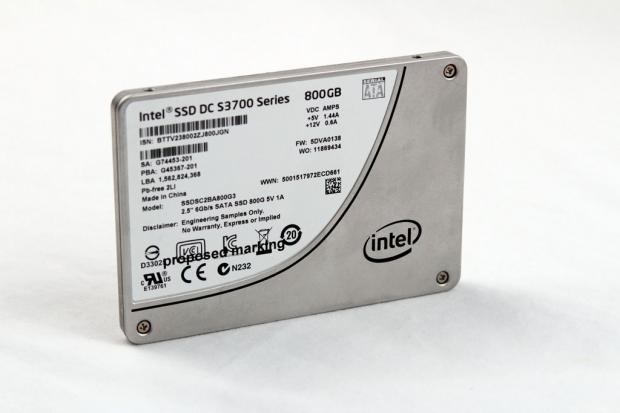
The Intel DC S3700 SSD comes in a 7.5 mm Z-height metal alloy casing with the relevant branding information on the front. This 7.5mm form factor lends itself well to installation into slim applications, and for those applications which demand even slimmer installations Intel offers 1.8" DC S3700's.
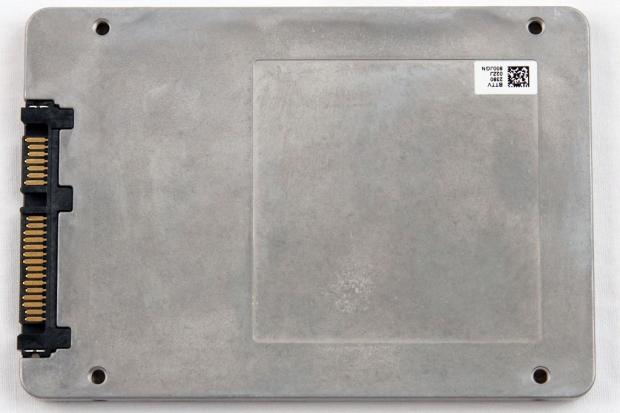
The rear of the SSD is unpolished, but we can observe the SATA 6Gb/s connection. SATA does not feature some of the advanced features of SAS, but Intel's partnership with HGST will likely bring about a SAS SSD with this same controller technology.
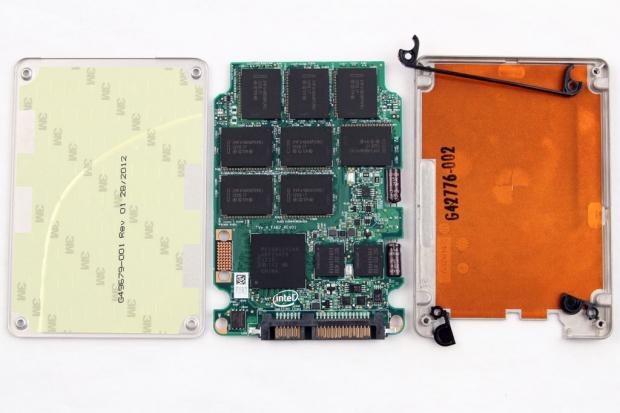
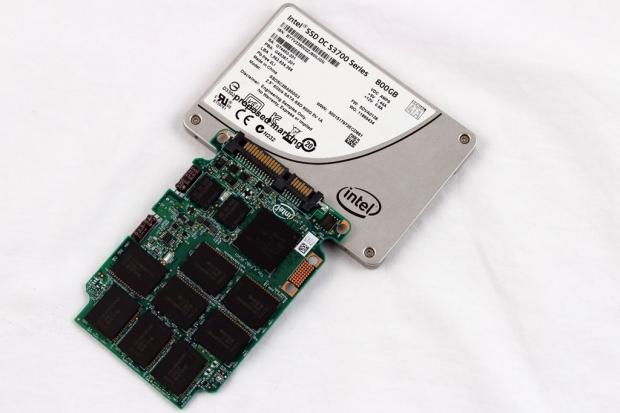
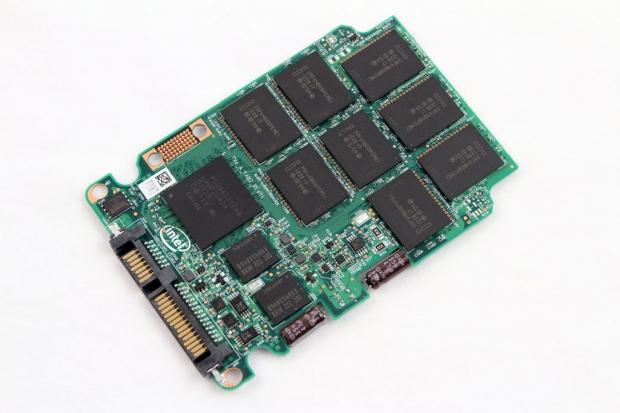
Once dissembled, we can observe that the case has plastic spacers that help to keep the PCB snug in the case. One readily noticeable characteristic is that Intel has gone to BGA mounting for all components on the PCB.
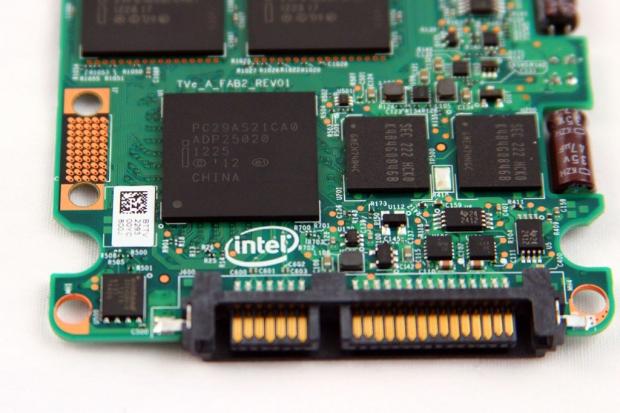
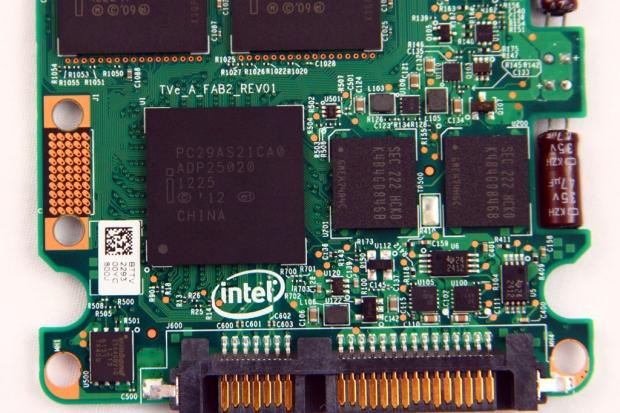
The proprietary PC29AS21CA controller is a departure from Intel's previous enterprise-class SSDs, with an 8-channel architecture as opposed to the old 10-channel design.
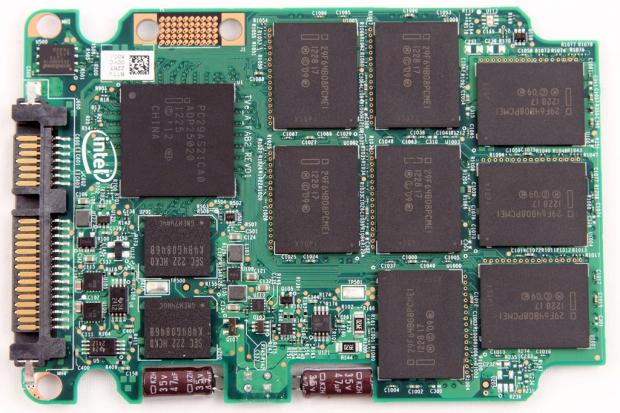
The controller is flanked by two Micron DDR3-1333 DRAM packages. These are used for caching of the indirection table and not user data. The large amount of cache (1GB for 800GB model) provides ample room for the 1:1 mapping scheme employed by Intel with this new generation of SSDs.
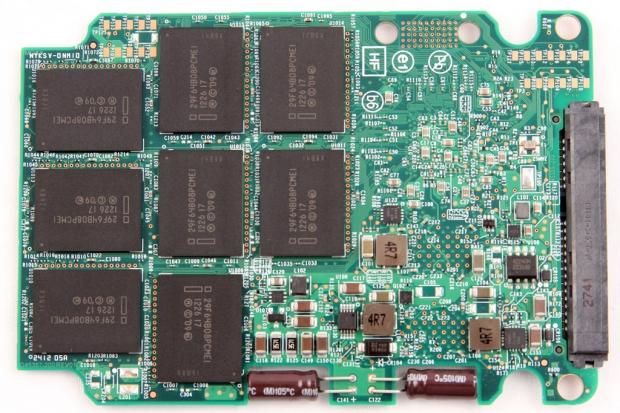
The 25nm lithography 29F64B08PCMEI HET-MLC consists of 8 packages for each side of the PCB. With 8 x 8GB dice in each package, there is a total of 64 GB per package. This brings us to 1024GB of raw NAND, of which 800GB is user addressable.
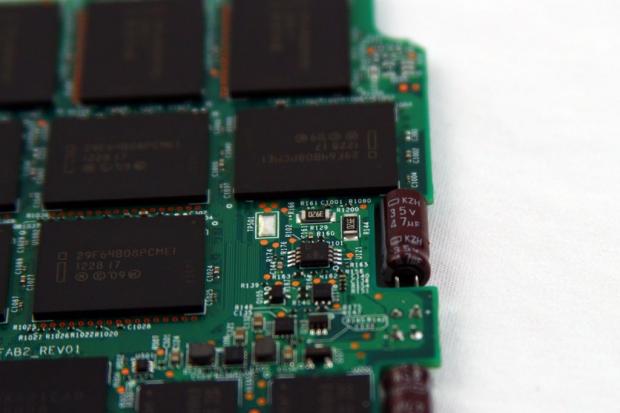
The two capacitors occupy a cutout on the side of the PCB. This is a unique deployment of capacitors, with previous applications featuring capacitors mounted to the PCB itself. The 37V/47uF capacitors are rated for temperatures up to 105C, and will flush data to the NAND in the event of a power loss issue.
Test System and Methodology
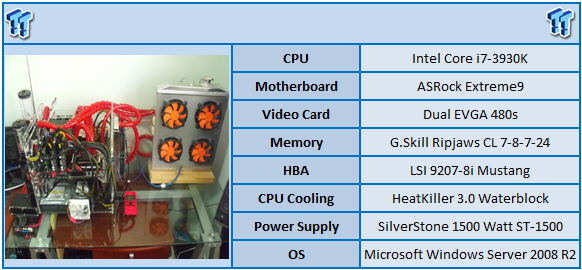
We utilize a new approach to HDD and SSD storage testing for our Enterprise Test Bench, designed specifically to target the long-term performance of solid state with a high level of granularity.
Many forms of testing involve utilizing peak and average measurements over a given time period. While these average values can give a basic understanding of the performance of the storage solution, they fall short in providing the clearest view possible of the QOS (Quality Of Service) of the I/O.
The problem with average results is that they do little to indicate the performance variability experienced during the actual deployment of the device. The degree of variability is especially pertinent, as many applications can hang or lag as they wait for one I/O to complete. This type of testing illustrates the performance variability expected in these types of scenarios, including the average measurements, during the measurement window.
In reality, while under load all storage solutions deliver variable levels of performance that are subject to constant change. While this fluctuation is normal, the degree of fluctuation is what separates enterprise storage solutions from typical client-side hardware. By providing ongoing measurements from our workloads with one-second reporting intervals, we can illustrate the difference between different products in relation to the purity of the QOS. By utilizing scatter charts readers can gain a basic understanding of the latency distribution of the I/O stream without directly observing numerous graphs.
Consistent latency is the goal of every storage solution, and measurements such as Maximum Latency only illuminate the single longest I/O received during testing. This can be misleading, as a single 'outlying I/O' can skew the view of an otherwise superb solution. Standard Deviation measurements take the average distribution of the I/O into consideration, but do not always effectively illustrate the entire I/O distribution with enough granularity to provide a clear picture of system performance. We use histograms to illuminate the latency of every single I/O issued during our test runs.
Our testing regimen follows SNIA principles to ensure consistent, repeatable testing. We attain steady state convergence through a process that brings the device within a performance level that does not range more than 20% from the average speed measured during the measurement window. Forcing the device to perform a read-write-modify procedure for new I/O triggers all garbage collection and housekeeping algorithms, highlighting the real performance of the solution.
We only test below QD32 to illustrate the scaling of the device. However, low QD testing with enterprise-class storage solutions is a frivolous activity if not presented with higher QD results as well. The explosion of virtualization into the datacenter places focus on the high QD performance of the storage solution as the most important metric.
We have also begun expanded power testing with a measurement of the power consumption during each of our precondition runs. This provides measurements in time-based fashion, measured every second, that illuminate the behavior of the power consumption in steady state conditions. The power consumption of storage devices can cost more over the life of the device than the actual up-front costs of the drive itself. This significantly affects the TCO of the storage solution.
The first page of results will provide the 'key' to understanding and interpreting our new test methodology.
4K Random Read/Write
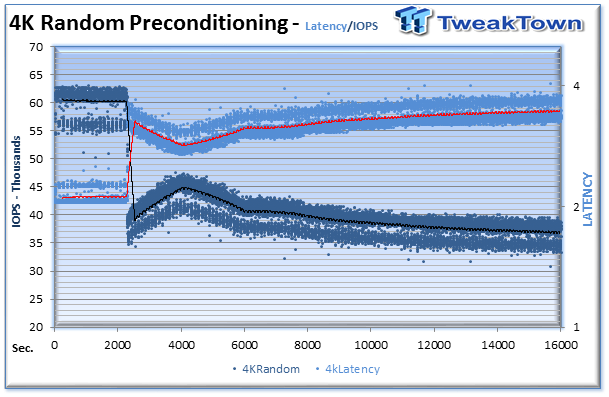
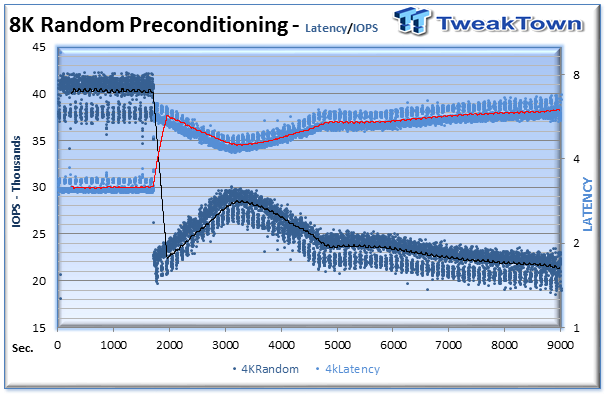
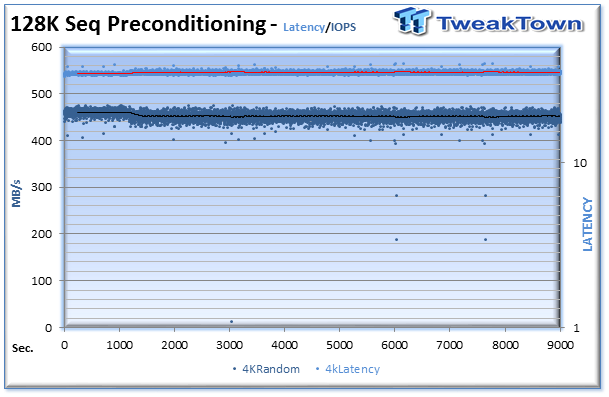
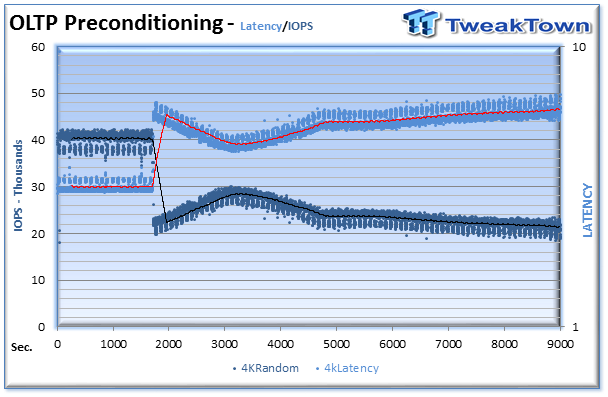
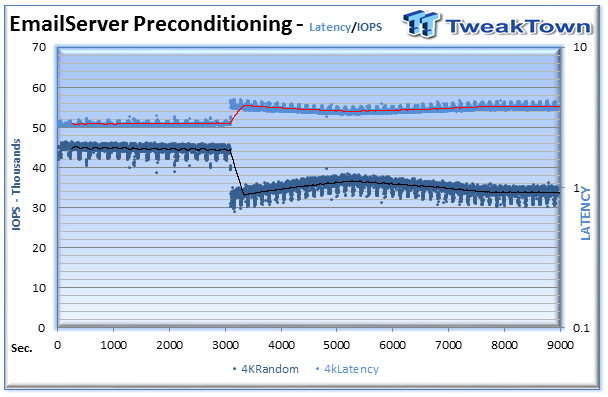
We preconditioned the Intel DC S3700 for 18,000 seconds or five hours. Every second we are receiving reports on several parameters of the workload performance. We then plot this data to illustrate the drives' descent into steady state.
This chart consists of 36,000 data points. The dark blue dots signify the IOPS during the test, and the light blue dots are the latency encountered during the test period. We place the latency data in a logarithmic scale to bring it into comparison range. This is a dual-axis chart with the IOPS on the left and the latency on the right. The lines through the data scatter are a moving average during the test. This type of testing presents standard deviation and maximum/minimum I/O in a visual manner.
Note that the IOPS and Latency figures are nearly mirror images of each other. This illustrates the point that high-granularity testing can give our readers a good feel for the latency distribution by viewing IOPS at one-second intervals. This should be in mind when viewing our test results below.
We provide histograms to provide further latency granularity below. This preconditioning slope of performance happens very few times in the lifetime of the device, and we present these test results for the tested device only to confirm the attainment of steady state convergence.
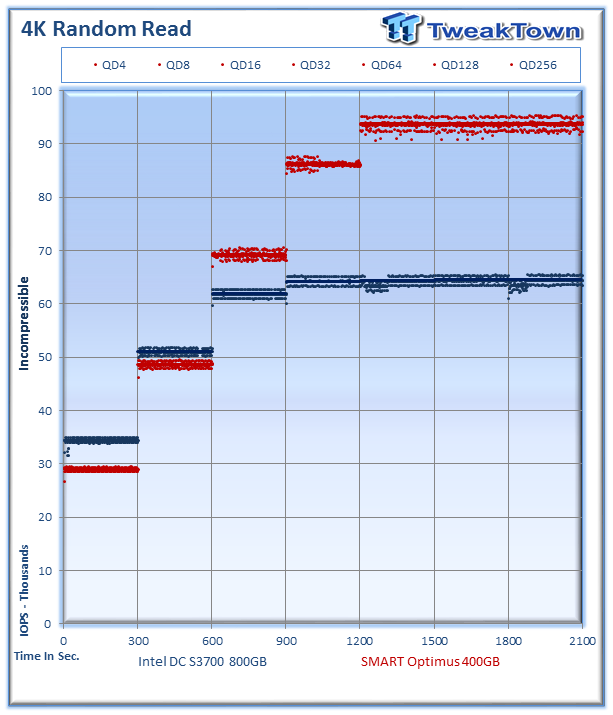
Each QD for every parameter tested includes 300 data points (five minutes of one second reports) to illustrate the degree of performance variability. The line for each QD represents the average speed reported during the five-minute interval.
4K random speed measurements are an important metric when comparing drive performance, as the hardest type of file access for any storage solution to master is small-file random. One of the most sought-after performance specifications, 4K random performance is a heavily marketed figure.
The Intel DC S3700 does provide very tight groupings of performance, much like the SMART Optimus. Intel's optimizations to their new QoS standard are more prevalent in the write tests below. We can see several dips in performance with the Intel SSD in the QD64 and QD256 range. These are indicative of the new approach with the Garbage Collection algorithms that Intel is utilizing for this SSD. This pattern is more pronounced in the write testing results.
The Intel DC S3700 does deliver an average speed of 64,533 IOPS at QD256 in steady state, with a little variability encountered during garbage collection routines. The SMART Optimus, with its native SAS connection, provides an average read speed of 93,860 IOPS at QD256.
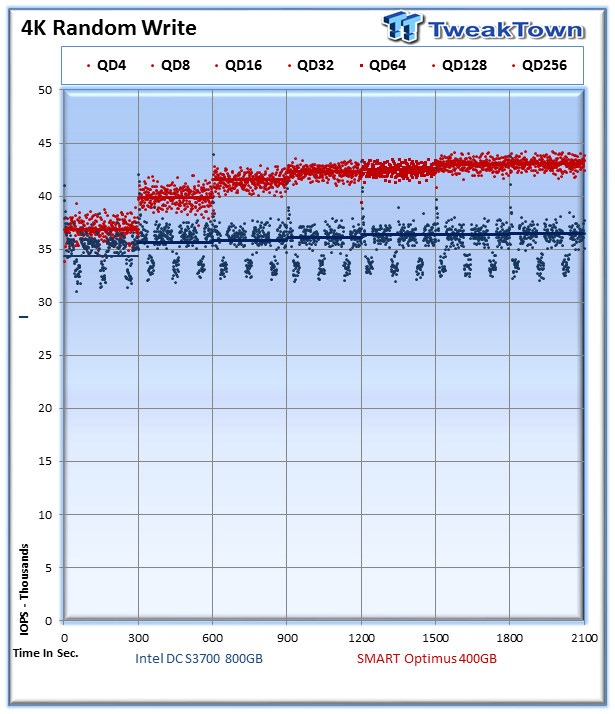
The Intel DC S3700 garbage collection mechanisms routines are more pronounced in heavy write workloads. Much of the latency optimization seems to focus around the garbage collection routines triggering at steady intervals of 90-100 seconds. This does provide very steady performance within a nice tightly defined range, but the SMART Optimus also exhibits much the same characteristic with less variability. The scale of this chart should be taken into consideration, with the Intel varying only 5,000 IOPS from minimum to maximum. This is admirable, but a characteristic also shared by many other enterprise storage solutions.
The Intel DC S3700 averages 36,428 IOPS, while the SMART Optimus averages 43,081 IOPS at QD 256.
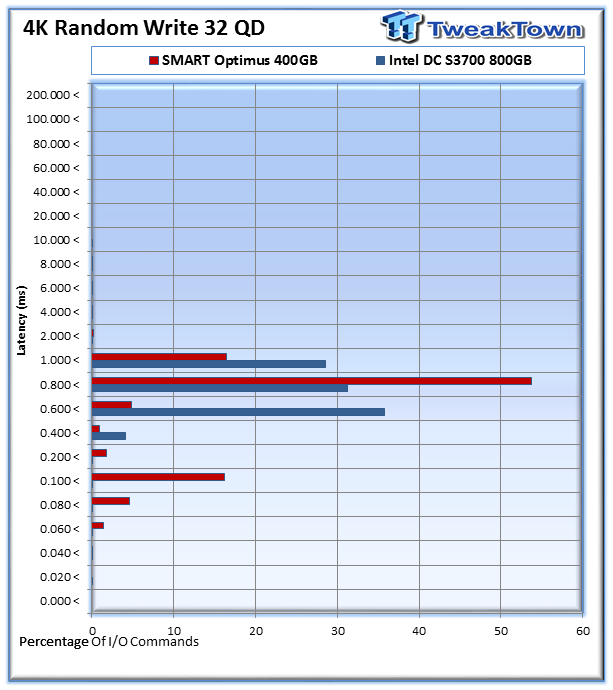
The histogram results are especially relevant due to the Intel SSD featuring tightly defined definitions of latency performance. We typically only publish our results from the 256QD range. We will include those below. Taking the Intel specified latency ranges with 4K random write activity into consideration at QD32 we included those results to ascertain the veracity of their latency specifications.
The Intel specification (page 2) states that the 800GB model we are testing will deliver 99.9% of I/O within 10ms, and 99.9999% of I/O within 20ms. The chart above reveals the results of every single I/O issued during our test run, and portrays them as percentages.
The Intel, with 4K QD32 random write access, gave 439,050 I/Os (or 4%) in the .4 - .6ms range, 3,796,071 I/Os (35.7%) in the .6 - .8ms range, 3,319,112 I/Os (31%) in the .8 - 1.0ms range, and 3,040,731 (28.6%) within the 1-2ms range. There was a smattering of I/O in the higher ranges, but with 6,636 I/Os in the 10-20ms range, accounting for .0624% of the total I/O.
In short, Intel met their QoS specifications for 99.9% of I/O. There was 1 solitary I/O delivered in the 20-40ms range, but the percentage is lower than our tool can calculate. It is safe to say that Intel also met their QoS specification for 99.9999% of operations conducted within 20ms. Interestingly enough the SMART Optimus also met these specifications, but within a tighter range. There were no I/Os from the Optimus over the 8-10ms range. Overall both SSDs perform beautifully in this test, but the SMART Optimus features overall lower latency.
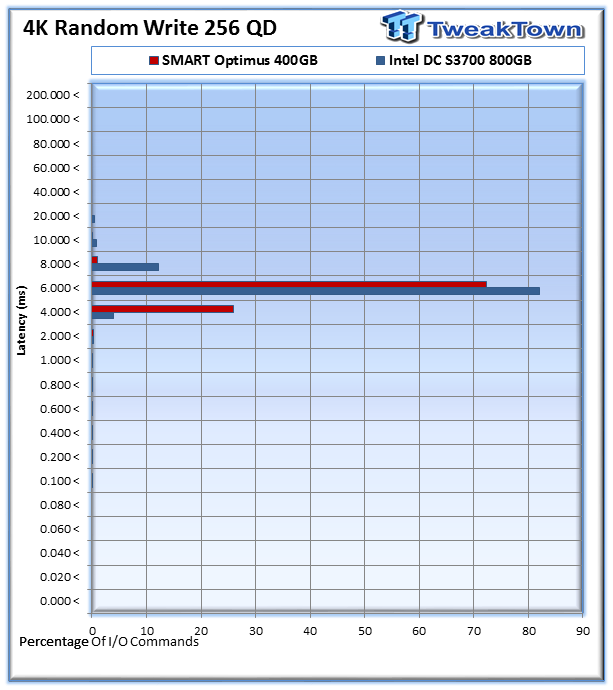
The performance in the higher-load 4K QD256 test was similar to the results at QD32, with the Optimus beating the Intel by a slim margin. The Intel had 425,253 I/O (3.9%) in the 4-6ms range, 8,766,022 I/O (82.1%) in the 6-8ms range, and 1,307,699 (12.2%) within the 8-10ms range.
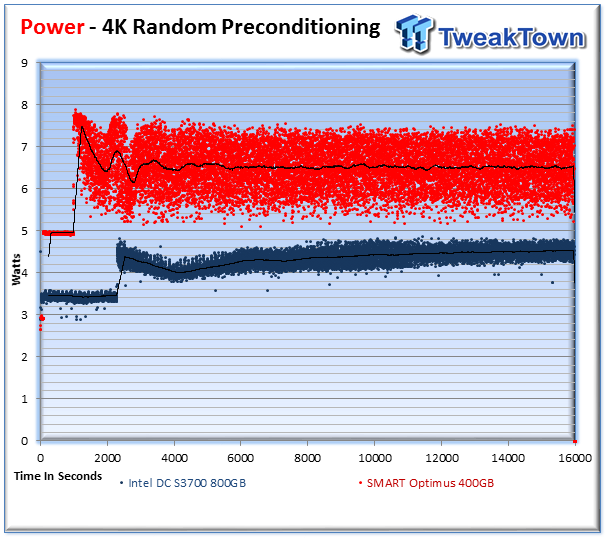
The power consumption measurements, taken during our precondition run, for SMART Optimus are higher than the DC S3700, averaging 6.51 Watts compared to the Intel's average of 4.36 Watts. Some of this higher power requirement is due to the SAS interface.
The Intel scored 8,336 4K write IOPS per Watt, and the Optimus scored 6,617 IOPS per Watt.
8K Random Read/Write
8K random read and write speed is a metric that is not tested for consumer use, but for enterprise environments this is an important aspect of performance. With several different workloads relying heavily upon 8K performance, we include this as a standard with each evaluation. Many of our Server Emulations below will also test 8K performance with various mixed read/write workloads.
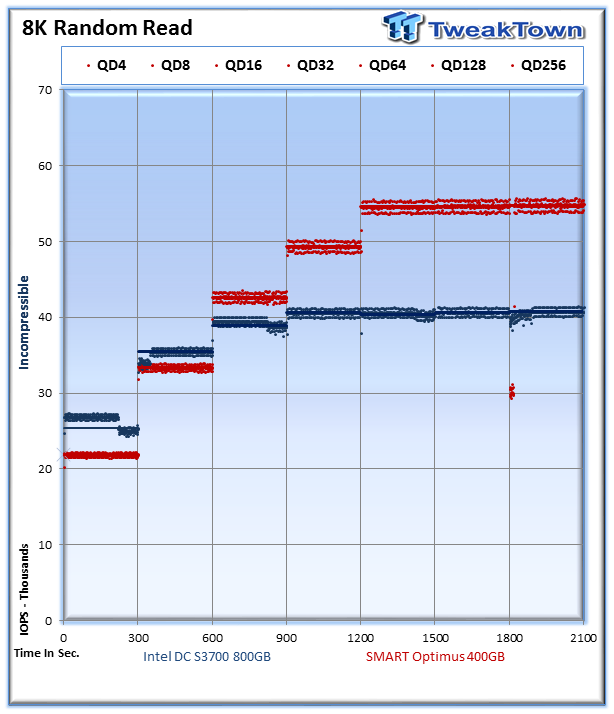
The average 8K random read speed of the DC S3700 at QD256 was 40,766 IOPS compared to 54,767 IOPS for the Optimus.
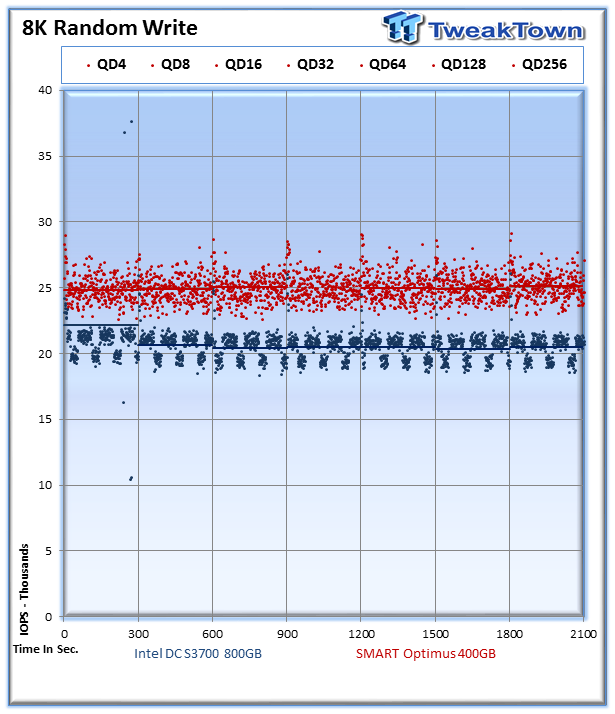
The average 8K random write speed of the DC S3700 at QD256 was 20,475 IOPS compared to 25,096 for the Optimus.

The Intel provides 96% of the QD256 8K random write I/Os during the test (5,902,234) in the 10-20ms range. The Optimus provides lower latency, dipping as low as 4ms.
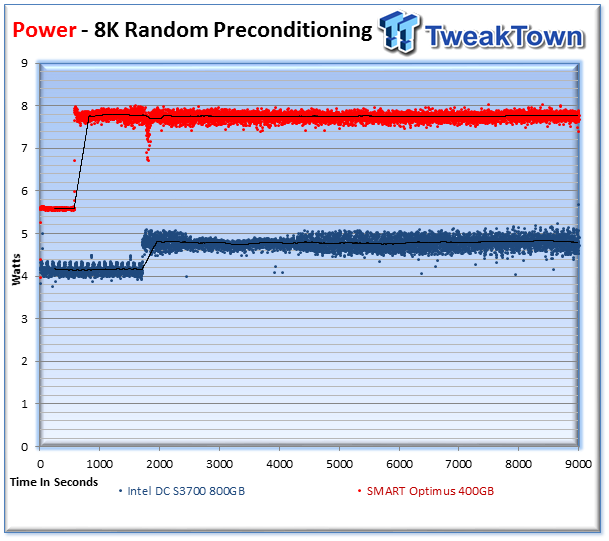
The power for the Intel during the precondition run averaged 4.81 Watts, and the Optimus averaged 7.7 Watts. This gives the Intel 4,252 write IOPS per Watt compared to the Optimus with 3,228 IOPS.
128K Sequential Read/Write
The 128K sequential speeds reflect the maximum sequential throughput of the SSD using a realistic file size actually encountered in an enterprise scenario.
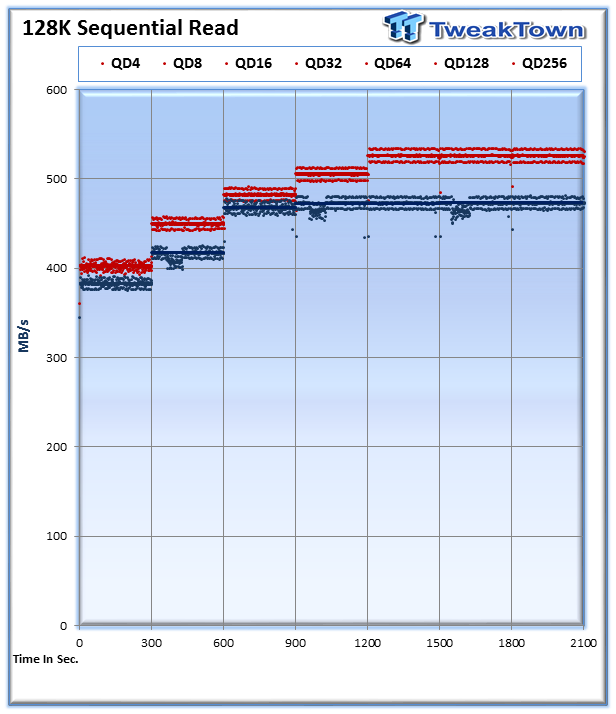
The Intel DC S3700 averaged 473MB/s in sequential read speed at QD256, and the Optimus averaged 526MB/s. Both SSDs exhibit very good consistent performance in the read testing, though the Intel tends to slip back into its garbage collection mode intermittently.
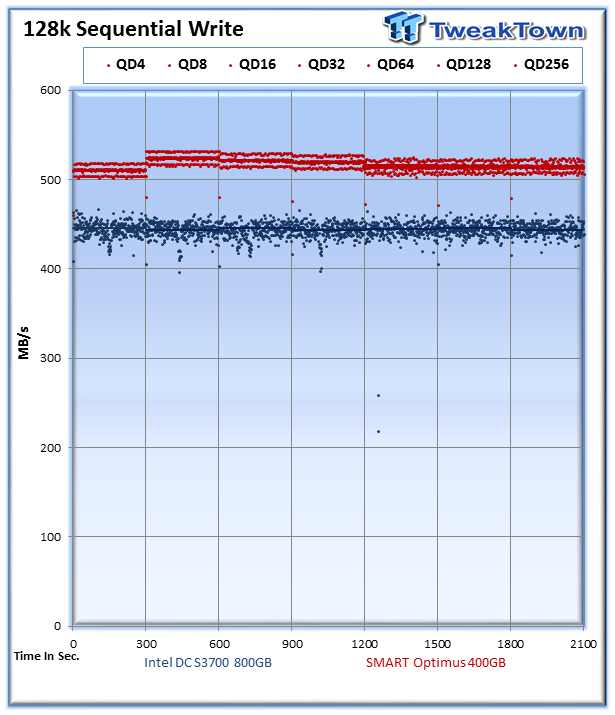
The DC S3700 averages 444MB/s in 128K sequential write speed, and the Optimus weighs in at 514MB/s.
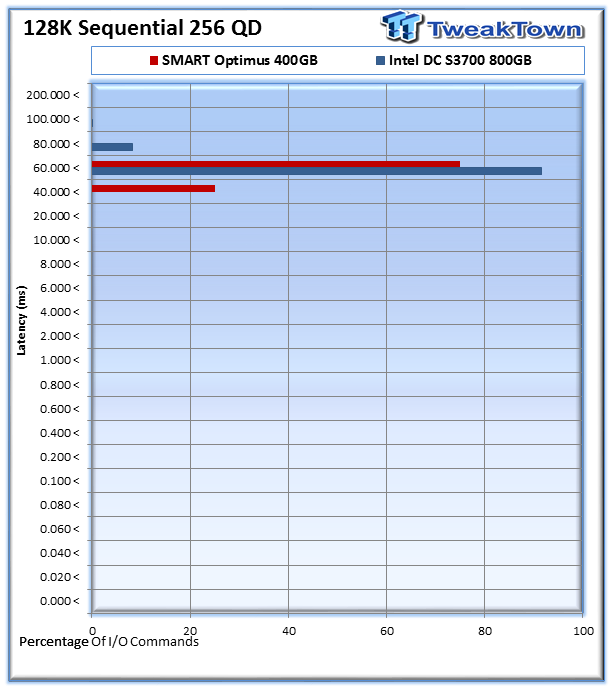
The DC S3700 delivers 91.6% of the I/O (974,914) in the 60-80ms range, and 8.2% (86,986) at 80-100ms. The Optimus again exhibits lower latency characteristics.
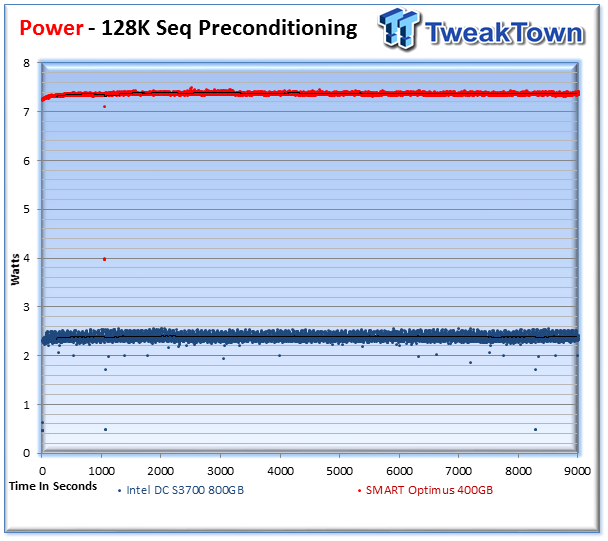
The Intel averages 2.39 Watts, and the Optimus averages 7.37 Watts. The DC S3700 gives 185MB/s per Watt compared to the Optimus with 69MB/s per Watt.
OLTP and Webserver
OLTP
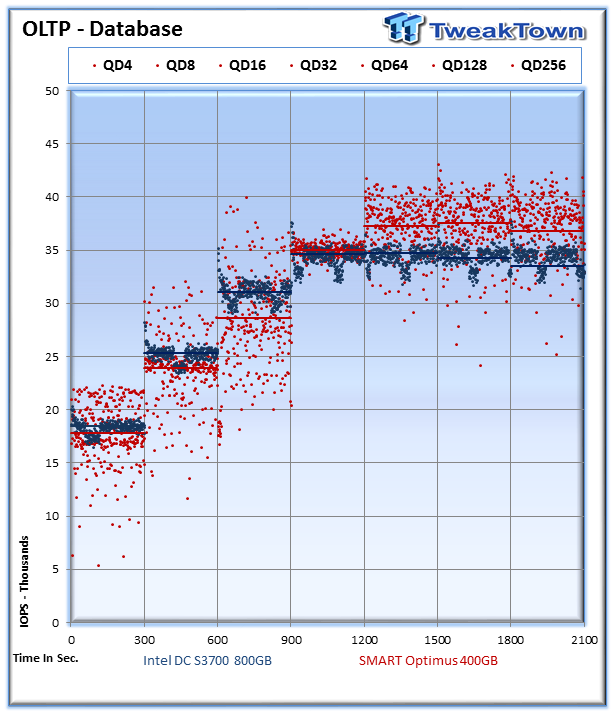
This test emulates Database and On-Line Transaction Processing (OLTP) workloads. OLTP is in essence the processing of transactions such as credit cards and high frequency trading in the financial sector. Enterprise SSDs are uniquely well suited for the financial sector with their low latency and high random workload performance. Databases are the bread and butter of many enterprise deployments. These are demanding 8K random workloads with a 66% read and 33% write distribution that can bring even the highest performing solutions down to earth.
The Intel retains its clustered performance with the mixed read/write workload, while the Optimus does begin to show signs of increased variability under this type of workload. Numerous instances fall well below the Intel's range, even though the majority of the I/O is above the Intel performance. This type of workload is well suited to Intel's latency consistency approach.
The DC S3700 averages 33,546 IOPS in contrast to the 36,837 IOPS from the Optimus.
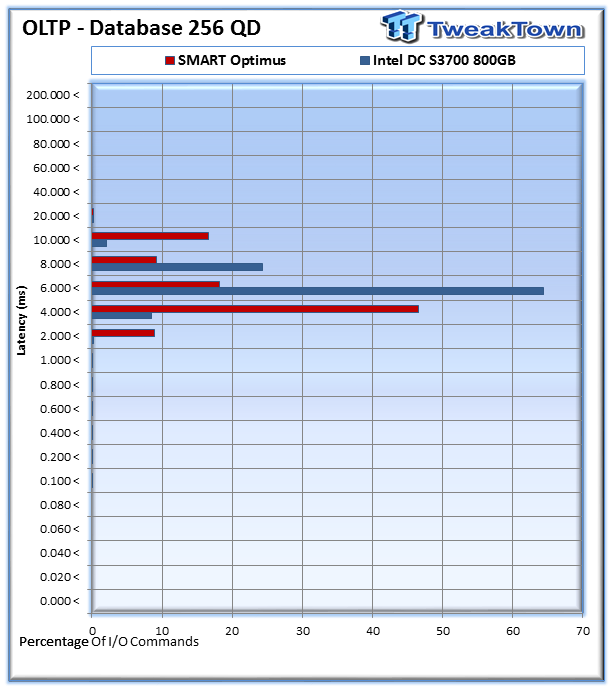
The Intel delivers 8% of I/Os (871,837) in the 4-6ms range, 64% of I/Os (6,607,063) in the 6-8ms range, and 24% (2,501,265) in the 8-10 range. The Intel provides better overall latency in this test, winning in the 10-20ms range with only 2.1% of commands occupying this space.
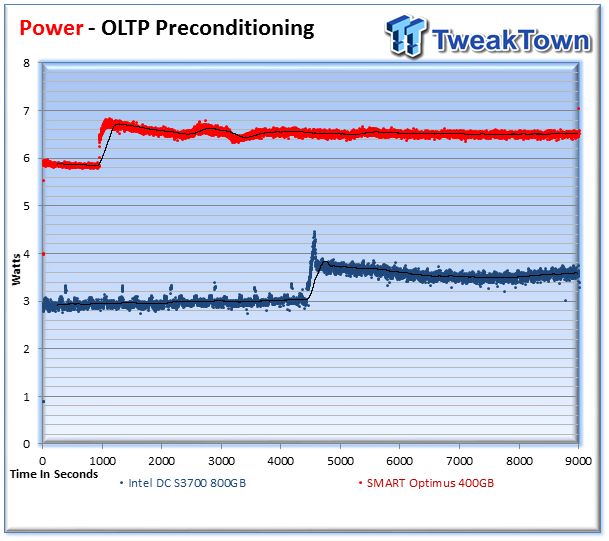
The Intel averages 3.56 Watts in contrast to the Optimus with 6.5 Watts. This gives the Intel 9,418 IOPS per Watt with this workload, and the Optimus 5,659 IOPS per Watt.
Webserver
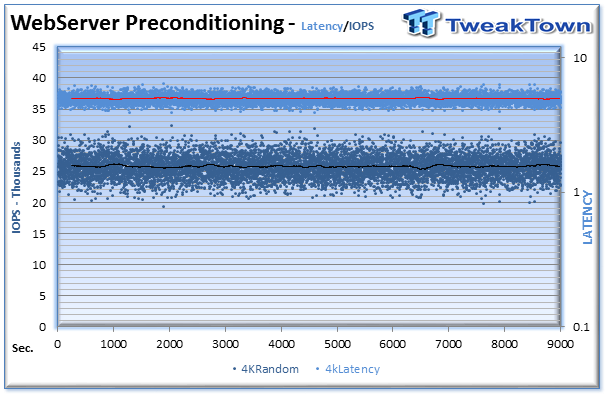
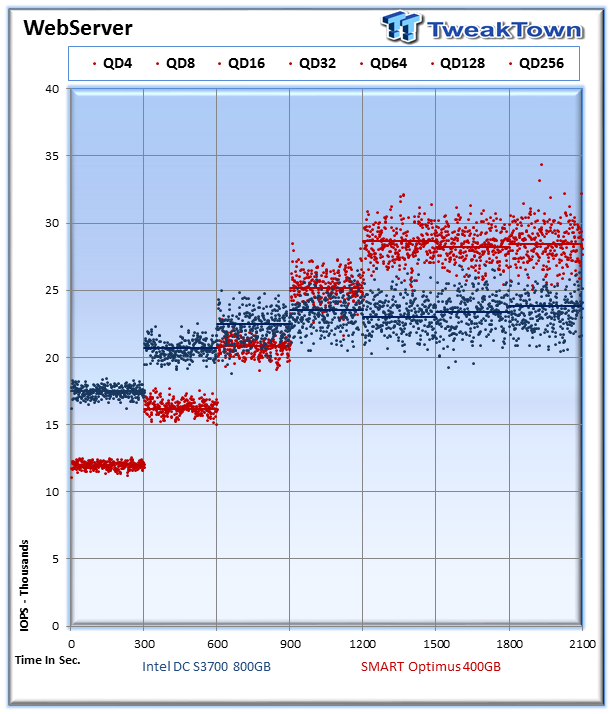
The Webserver profile is a read-only test with a wide range of file sizes. Web servers are responsible for generating content for users to view over the internet, much like the very page you are reading. The speed of the underlying storage system has a massive impact on the speed and responsiveness of the server that is hosting the websites, and thus the end user experience.
The Intel averages 33,546 IOPS at QD256, and the Optimus averages 36,837 IOPS. Both SSDs exhibit some variance, but taking into consideration the scale of the graph it is minimal. The Intel apparently abandons its Garbage Collection cadence during this test, while the Optimus again pulls ahead in overall speed.
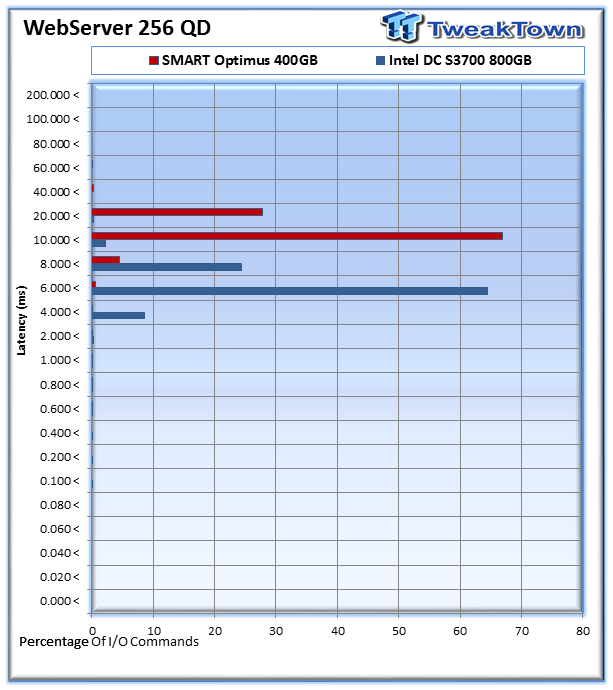
Though the Optimus exhibited better overall speed the Intel managed to pull off better latency during the duration of the test. The DC S3700 gave 64% of I/Os (6,607,603) in the 6-8ms range, and 24% (2,501,265) in the 8-10ms range.
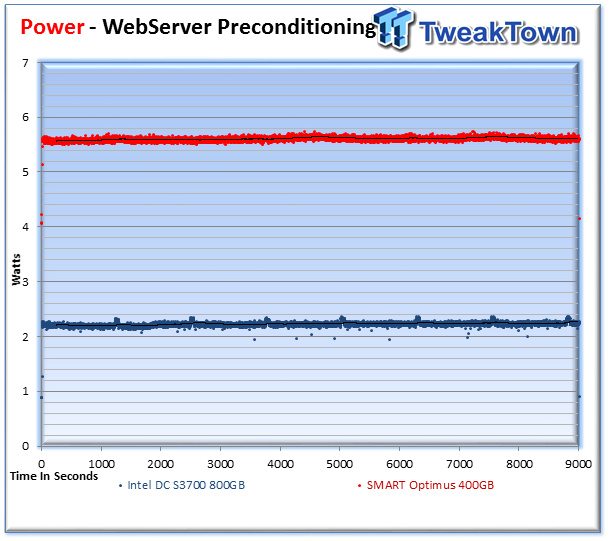
The Intel averages 2.24 Watts, and the Optimus averages 5.61 Watts. This gives the Intel an average of 10,600 IOPS per Watt in this test, and the Optimus 5,071 IOPS per Watt.
Fileserver and Emailserver
Fileserver
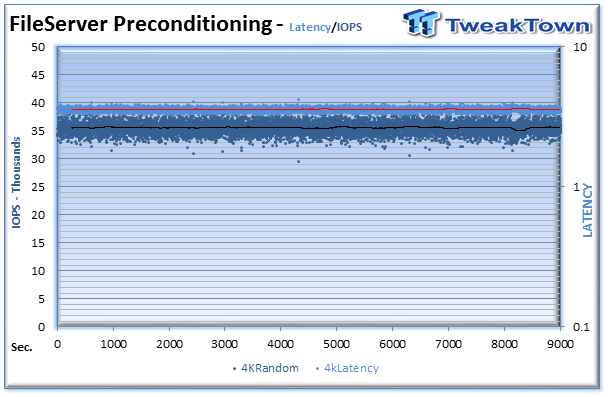

The File Server profile represents typical file server workloads. This profile tests across a wide variety of different file sizes simultaneously, with an 80% read and 20% write distribution.
Both SSDs fit within a tight performance range in this testing, thought the Optimus pulls ahead in overall speed. The DC S3700 averages 30,888 IOPS at QD2565, and the Optimus averages 39,434 IOPS.
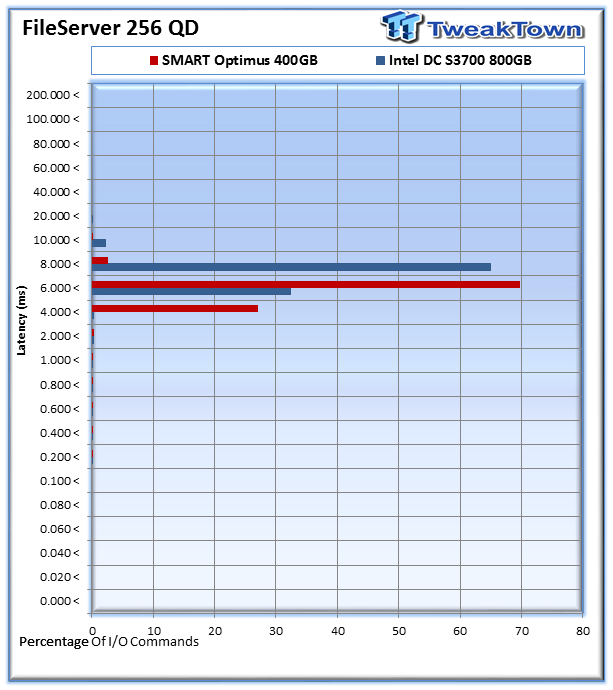
The Optimus wins the latency test in this scenario, with overall lower latency. The Intel provides 32% (2,964,148) of I/O within the 6-8ms range, and 64% (5,941,948) of I/Os in the 8-10ms range.
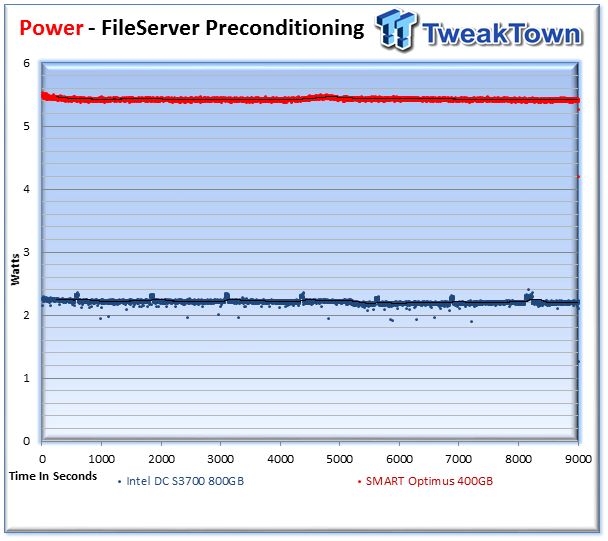
The Intel averages 2.2 Watts, and the Optimus averages 5.41 Watts. The Intel provides 14,040 IOPS per Watt, and the Optimus weighs in at 7,276 IOPS per Watt.
Emailserver
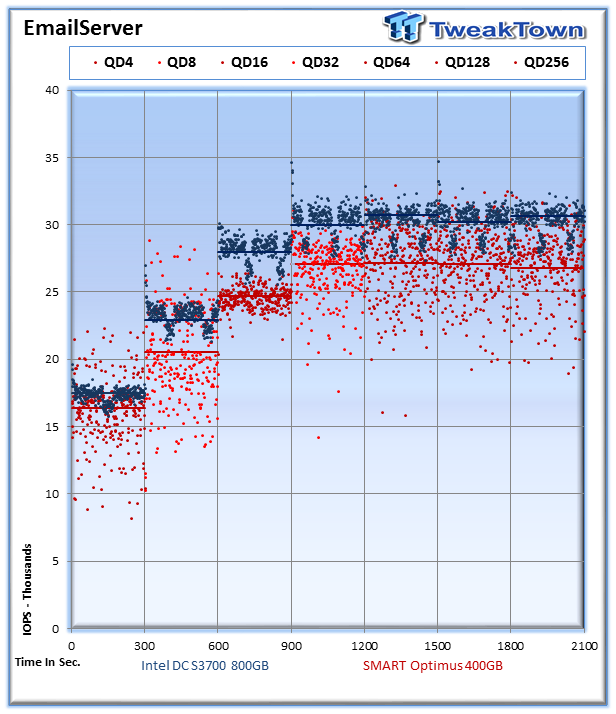
The Emailserver profile is very demanding 8K test with a 50% read and 50% write distribution. This application is indicative of the performance of the solution in heavy write workloads.
The Optimus ruled the performance charts for many of the tests, but with this heavy mixed read/write workload, the Intel shines. The tight latency distribution helps to push the Intel above the Optimus in this test. The Intel averages 30,632 IOPS at QD256, while the Optimus averages 26,762 IOPS.
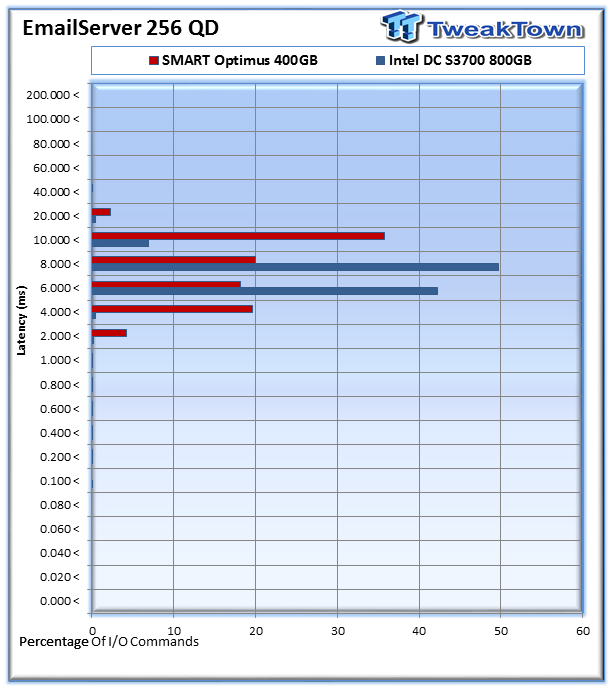
The Intel also provides lower latency in this workload, with 42% (3,830,955) of I/Os falling into the 6-8ms range, and 49% (4,508,543) of I/Os falling into the 8-10ms range.
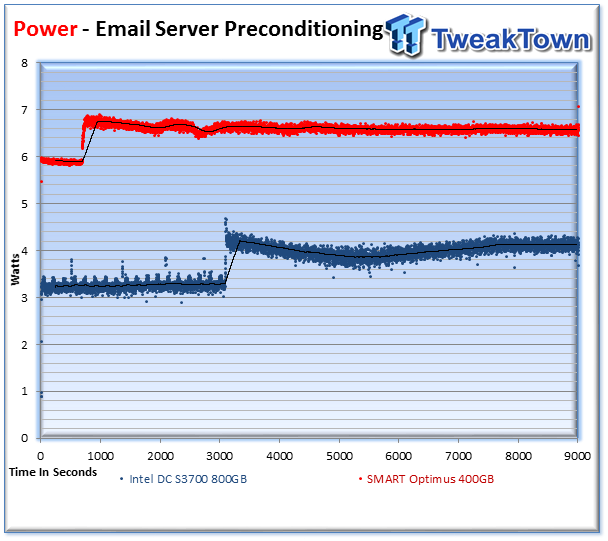
The Intel DC S3700 averaged 4.12 Watts compared to the 6.58 Watts from the Optimus. This averages out to 7,425 IOPS per Watt for the Intel and 4,066 IOPS per Watt for the Optimus.
Final Thoughts
Intel has taken large strides into the enterprise space in recent months by delivering new SSDs that are destined to alter the datacenter landscape. Much of the changes from Intel are not coming from groundbreaking performance. With both the Intel 910 and this SSD, it is clear that they aren't the fastest solutions available in their respective classes. There are faster PCIe SSDs and traditional form factor SSDs as well.
Intel has heavily marketed the new QoS and latency specifications as enabling superior performance. In an enterprise market dominated by solutions that already deliver similar, and in some cases better consistency, there need to be other ways for Intel to differentiate their product.
The majority of performance enhancements seem to stem from the routine cadence of the garbage collection and housekeeping algorithms. This does provide excellent latency characteristics in conjunction with the new 1:1 indirection table mapping. The excellent latency performance brings Intel into the same class as other SSDs with current generation controllers.
The DC S3700 excels at its IOPS to Watts metrics with very frugal power requirements. This is especially important in mass deployments, where every extra watt can affect TCO. The endurance of the DC S3700 is an important key as well, with 10 DWPD guarantying sufficient endurance for most scenarios. Intel is using endurance-increasing techniques to challenge flash industry stalwarts who have already developed their own techniques. The Optimus also provides 10 DWPD, and several solutions from STEC have impressive endurance as well.
The SATA connection for the DC S3700 will enable it's deployment into many varied situations, but also eliminate it as a contender in certain scenarios. SAS provides enhanced functionality from its full duplex operation, compared to the half-duplex of SATA. SAS also provides dual port, multipath and failover ability. These are important characteristics in mission-critical and high-load situations. Intel has a strategic collaboration with HGST for controller development, and we expect to see SAS SSDs from HGST with this new controller in the future.
The consistent performance should deliver enhanced performance in arrays due to RAID arrays limitations to the slowest I/O. The lack of the SCSI command set does impair management of the SSD behind most RAID controllers.
The most important change from Intel is bringing the price of solid-state solutions down to acceptable price points. The price of SSDs is falling rapidly, making them viable solutions for the datacenter. It is in Intel's best interest for SSDs from all manufacturers to gain wider acceptance into the enterprise space, simply because enabling parallel multi-threaded computing through increased storage throughput and reduced latency requires bigger, faster processors.
Bringing the price of the DC S3700 down to $2.35 per GB is going to force other competitors to lower their pricing into a similar range for similar products. In the SATA space, it is going to be very hard for existing solutions to match the pricing, performance and endurance of the Intel DC S3700. Throwing in the five year warranty only sweetens the deal.

 Micron 6600 ION 245.76TB Enterprise SSD Review - Best in Class Programming Speeds
 Memblaze PBlaze 7 7A40 Ocean 61.44TB Enterprise SSD Review - Oceans of QLC at 3.3 million IOPS
 KIOXIA CD9P-R 7.68TB E3.S Review - The Best-In-Class Data Center SSD
 DapuStor Roealsen6 R6060 E1.L 245.76TB SSD Review - Massive Capacity with Fast Retrieval
 Phison Pascari X200P 7.68TB Enterprise SSD Review - Sequential Read Champion
 Xbox testing smart client to boost game download speeds
 NVIDIA CEO Jensen Huang joins X with post backing open-weight AI
 Roku raised prices by up to 60%, citing a memory shortage, despite the CEO calling it great for business just two months ago
 Amazon Gaming boss says next-gen consoles crossing $1,000 is good news
 SignalRGB is giving away a Steam Machine clone covered in 36 RAM sticks
 Giveaway: Win an ADATA SE880 2TB Portable External SSD
 Rockstar co-founder doesn't care about the physical vs digital debate, says companies should give players what they want
 God of War Laufey gets a release date and Kratos is making a return
 GTA 6 trailer 3 expected to arrive within two weeks, according to insider
 Thrustmaster T.Flight HOTAS 5 MSFS Edition Review
 SteelSeries Arctis Nova Pro Omni Wireless Headset Review - One Headset to Rule Them All
 SteelSeries Arctis Nova 7 Wireless Gen 2 Headset Review - New and Improved, But Is It Enough?
 AMD Ryzen 7 7700X3D Review - Days of Future Past
 Samsung 990 2TB SSD Review - Ninth Gen QLC at PCIe Gen4 Speeds
 ASUS ExpertBook Ultra (Panther Lake) 14" Business Laptop Review
 ASUS ROG Raikiri II Xbox Wireless Controller Review - Ready to Take Control
 MOZA FMP18 Panel Bundle Review: authentic F/A-18 Hornet cockpit controls for flight sims
 MOZA MA3F EFCM Flight Control Module Review: authentic Airbus A320 autopilot panel for simulators
 Printer Not Working in Windows? How to fix detection, print queues and drivers
 The Ultimate Guide to Personalizing Your Windows 11 Taskbar
 How to Turn Your Windows Laptop Into a Second Monitor with Miracast and Wireless Display in Minutes
 6 Mistakes to Avoid When Buying a Windows Laptop
 I capped Windows Update's bandwidth with Delivery Optimization, and my downloads stopped choking
 I use this decade-old free tool that finds files faster than Windows Search does
 I install and update most of my apps with this Windows command now, and I stopped downloading sketchy installers
 Hisense U6SF 65-inch MiniLED TV: High Performance Meets Leisurely Convenience
 I stopped digging through Windows menus after I set up this one folder
 Don't sell your Windows laptop until you do these things