
Introduction

Just yesterday, we went into a long and winded intro that covered all of the bases. Let's do a short recap for those just joining us today for the Samsung 840 250GB.
840 is the first consumer SSD to use TLC (triple-level cell) NAND flash. The flash has a 1K P/E cycle, but the triple-core controller does a very good job keeping the NAND in-line with one core dedicated to flash management and background tasks.
The 840 is a solid step forward from the 830 Series and uses a faster controller, higher capacity yet lower voltage DRAM and being a value product has a lower cost. In our testing yesterday we learned the 840 500GB (user capacity with 512GB total) removed the write latency issue we found on our 830 128GB sample.

Unlike last year when Samsung only released the 830 Series, the company has taken to a traditional two-product approach with the 840 filling the value sector of the market and the 840 Pro, with MLC flash, covering the enthusiast, prosumer and power user markets. Both new SSDs use Samsungs new 21nm NAND flash.?
Specifications, Pricing and Availability

Samsung lists quite a bit of information on their spec sheets. Each capacity size has its own list. Yesterday we reviewed the 840 500GB with 530MB/s sequential read performance and 330MB/s sequential write speed.
The 250GB 840 keeps the same 530MB/s sequential read speed, but the sequential write speed dips down to 240MB/s. This is a bit of an issue because at 250GB of capacity, the Samsung 840 has to compete with a number of products that perform best in this capacity size.
The Samsung 840 500GB looked much better because the Team SandForce 480/512GB drives lose a lot of performance at the largest capacity. The Team SandForce drives are optimized for performance at 240/256GB and that may turn into a problem for Samsung.
Newegg lists the Samsung 840 250GB at $189.99 and $209.99 depending on the accessory kit. Both accessory kits are very good, but the upgrade bundle includes a desktop adapter bracket, key for Norton Ghost (Data Migration Software), SATA power and data cables.
Both kits include Samsung's Magician Software to secure erase, firmware update and other functions.?
Packaging

Samsung put together a nice retail package for the 840. The front of the package is fairly bare, but we did find performance claims on the back of the package.

The performance data on the back of the package makes it easy for potential buyers to tell the difference between products in a retail store. In the 500GB 840 review we covered the Data Migration Software issue we found.
Samsung lists Data Migration Software on the back of the bare drive package, but we found out in testing the software is only a 30 day trial of Norton Ghost and not the full licensed version.

The inner package is well put together with the drive in the middle of a plastic tray and the manuals, software and stickers tucked in behind the drive on the other side of the tray.?
Samsung 840 250GB SSD

Here we get our first look at the actual SSD. Samsung uses an all metal case with the 840 and not the plastic case used on the 830. Visually the two cases are nearly identical, but Samsung did move the orange square from the lower left to the lower middle.

The capacity size, model and serial numbers are located on the bottom of the drive. The bottom mounting points are located where they should be.

The Samsung 840 and 840 Pro are both 7mm z-height drives so you can use them in ultrabooks as well as notebooks and desktops (with an adapter bracket, supplied with the full bundle kit).

The SATA power and data cable connectors are offset and where they should be.

Inside we found the Samsung MDX controller, a single DRAM cache buffer chip and eight Samsung 21nm TLC flash chips.

The DRAM cache is a new low voltage chip and it's located very close to the controller to reduce latency.

Samsung is currently the only SSD manufacturer shipping a product with TLC NAND flash on a consumer product.?
Benchmarks - Test System Setup and ATTO Baseline Performance
Desktop Test System

Lenovo W530 - Mobile Workstation
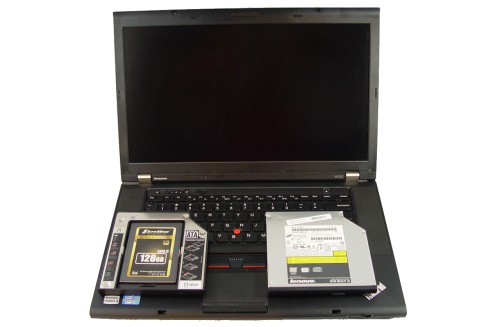
We use two systems for SSD testing. The desktop runs a majority of the tests and the Lenovo W530 runs the notebook power tests as well as the real-world file transfer benchmark.
ATTO Baseline Performance
Version and / or Patch Used: 2.34
ATTO is used by many disk manufacturers to determine the read and write speeds that will be presented to customers.

In ATTO where we test maximum performance with a queue depth of 4 we measured reads at just over 560MB/s. This is a very good rating and one of the highest we're recorded to date.
The write speed of the 840 250GB was nearly 260MB/s. The low write speed may become an issue further in the review when we get to the real-world tests.?
Benchmarks - Sequential Performance
HD Tune Pro
Version and / or Patch Used: 4.00
Developer Homepage: http://www.efdsoftware.com
Product Homepage: http://www.hdtune.com
HD Tune is a Hard Disk utility which has the following functions:
Benchmark: measures the performance
Info: shows detailed information
Health: checks the health status by using SMART
Error Scan: scans the surface for errors
Temperature display
HD Tune Pro gives us accurate read, write and access time results and for the last couple of years has gained popularity amongst reviewers. It is now considered a must have application for storage device testing.
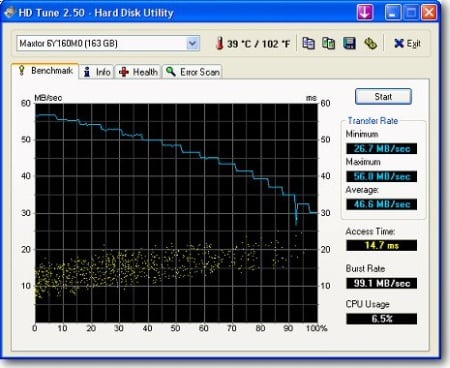

In our chart filled with 240/250GB drives the Samsung 840 250GB delivers superior sequential read performance. We measured a steady 463MB/s average. As you can see in the chart, this is a full 40MB/s faster than the highest SandForce drive on the list, the Intel 335 SSD.

Just like the 500GB 840, the 250GB writes data much slower than it reads it. The 250GB model is even slower than the 500GB though, and that's a bit of an issue when drives costing much less manage to write data faster.
We measured the sequential write speed with 64KB at just under 250MB/s average.?
Benchmarks - AIDA64 Random Access Time
AIDA64 Random Access Time
Version and / or Patch Used: 1.60
Developer Homepage: http://www.aida64.com
Product Homepage: http://www.aida64.com
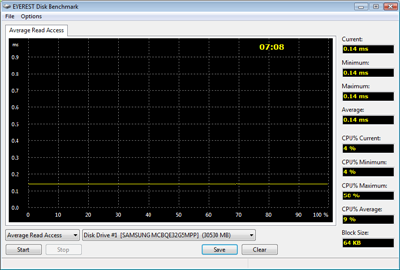
AIDA64 offers several different benchmarks for testing and optimizing your system or network. The Random Access test is one of very few if not only that will measure hard drives random access times in hundredths of milliseconds as oppose to tens of milliseconds.
Drives with only one or two tests displayed in the write test mean that they have failed the test and their Maximum and possibly their Average Scores were very high after the cache fills. This usually happens only with controllers manufactured by JMicron and Toshiba.

Read access time was a straight solid line across the graph with a steady .07ms time.

The only 830 drive we tested was the 128GB capacity size and it had latency spikes all over the place in our write latency test. The 840 took care of the issue and the write latency graph had a fairly smooth line across the screen. The average write latency measured at .17ms, also with 64KB.?
Benchmarks - CrystalDiskMark
CrystalDiskMark
Version and / or Patch Used: 3.0 Technical Preview
Developer Homepage: http://crystalmark.info
Product Homepage: http://crystalmark.info/software/CrystalDiskMark/index-e.html
Download here: http://crystaldew.info/category/software/crystaldiskmark
CrystalDiskMark is a disk benchmark software that allows us to benchmark 4K and 4K queue depths with accuracy.
Key Features:-
* Sequential reads/writes
* Random 4KB/512KB reads/writes
* Text copy
* Change dialog design
* internationalization (i18n)
Note: Crystal Disk Mark 3.0 Technical Preview was used for these tests since it offers the ability to measure native command queuing at 4 and 32.

In CDM we're looking at 4K performance. The Samsung 840 250GB delivers nearly 33MB/s in the QD1 4K test. This is a high result that matches some of the fastest drives on the market today. The 840 scales well too achieving nearly 110MB/s at QD4 and 387MB/s at QD32.

The Samsung 840 250GB doesn't deliver the big sequential write performance found on some of the other drives, but it does dazzle us with 4K low queue depth performance.
In this set of tests we're using incompressible data for the first time in the review and get to see the how the 840 compares to the Team SandForce drives (Intel 335 and OCZ Vertex 3 Max IOPS).The two orange lines show sequential performance. The 840 250GB manages to split the 335 and Max IOPS in incompressible sequential data.?
Benchmarks - PCMark Vantage Hard Disk Tests
PCMark Vantage - Hard Disk Tests
Version and / or Patch Used: 1.0.0
Developer Homepage: http://www.futuremark.com
Product Homepage: http://www.futuremark.com/benchmarks/pcmark-vantage/

PCMark Vantage is the first objective hardware performance benchmark for PCs running 32 and 64 bit versions of Microsoft Windows Vista. PCMark Vantage is perfectly suited for benchmarking any type of Microsoft Windows Vista PC from multimedia home entertainment systems and laptops to dedicated workstations and high-end gaming rigs. Regardless of whether the benchmarker is an artist or an IT Professional, PCMark Vantage shows the user where their system soars or falls flat, and how to get the most performance possible out of their hardware. PCMark Vantage is easy enough for even the most casual enthusiast to use yet supports in-depth, professional industry grade testing.
FutureMark has developed a good set of hard disk tests for their PCMark Vantage Suite. Windows users can count on Vantage to show them how a drive will perform in normal day to day usage scenarios. For most users these are the tests that matter since many of the old hat ways to measure performance have become ineffective to measure true Windows performance.

HDD1 - Windows Defender
HDD2 - Gaming
HDD3 - Windows Photo Gallery
HDD4 - Vista Startup
HDD5 - Windows Movie Maker
HDD6 - Windows Media Center
HDD7 - Windows Media Player
HDD8 - Application Loading
PCMark Vantage gives us a good indication of performance in daily use desktop tasks. The charts really speak for themselves since higher is better across the board. The 840 250GB has difficulties during a few of the tests and they are the big ones like Application loading.?
Benchmarks - PCMark Vantage - Drives with Data Testing
For a complete breakdown on the Drives with Data Testing please read this article. You will be able to perform this test at home with the files provided in the article - full instructions are included.
- Brief Methodology
SSDs perform differently when used for a period of time and when data is already present on the drive. The purpose of the Drives with Data testing is to show how a drive performs in these 'dirty' states. SSDs also need time to recover, either with TRIM or onboard garbage collection methods.
Drives with Data Testing - 25%, 50%, 75% Full States and Dirty / Empty Test
Files needed for 60 (64GB), 120 (128GB), 240 (256GB)
60GB Fill - 15GB, 30GB, 45GB
120GB Fill - 30GB, 60GB, 90GB
240GB Fill - 60GB, 120GB, 160GB
Empty but Dirty - a test run just after the fill tests and shows if a drive needs time to recover or if performance is instantly restored.

Here we see the performance drop off when data exists on the flash.
The Samsung 840 does better than some, but is far from the best. The real issue is the price vs. performance when looking at some of the drives that are faster than the 840 250GB - more on this in the final thoughts.?
Benchmarks - Anvil Storage Utilities
Anvil Storage Utilities
Version and / or Patch Used: RC5
So what is Anvil Storage Utilities? First of all, it's a storage benchmark for SSDs and HDDs where you can check and monitor your performance. The Standard Storage Benchmark performs a series of tests, you can run a full test or just the read or the write test or you can run a single test, i.e. 4K DQ16.
Anvil Storage Utilities is not officially available yet but we've been playing with the beta for several months now. The author, Anvil on several international forums has been updating the software steadily and is adding new features every couple of months.
The software is used several different ways and to show different aspects for each drive. We've chosen to use this software to show the performance of a drive with two different data sets. The first is with compressible data and the second data set is incompressible data. Several users have requested this data in our SSD reviews.
Fill Compressible Data

Incompressible Data

When testing compressible vs. incompressible data performance we didn't see any variation. The Samsung 840 doesn't slow down when working with incompressible data.
QD32 Random Read

Our random read performance with 4K data and a queue depth of 32 was 96K IOPS.
QD32 Random Write

Our random write IOPS test under the same perimeters recorded 57K IOPS.?
Benchmarks - BootRacer
BootRacer - System Boot Time
Version and / or Patch Used: 4.0
Developer Homepage: Greatis
Product Homepage: BootRacer
Download here: http://www.greatis.com/bootracer/download.htm
Note: In this test we use the Lenovo W530 Mobile Workstation loaded with an operating system and several program files. The data on the drive at the time of the test is 45GB. The second test, 50GB Free, was ran with the drives filled with block data until only 50GB of free capacity remained.

The Time to Desktop boot speed in our Lenovo W530 is very close with all of these SSDs and there is little variation when booting with the drive 75% full of data.?
Benchmarks - DiskBench
DiskBench - Directory Copy
Version and / or Patch Used: 2.6.2.0
Developer Homepage: Nodesoft
Product Homepage: DiskBench
Download here: http://www.nodesoft.com/diskbench/download
Note: In this test we use the Lenovo W530 Mobile Workstation and a SuperSSpeed S301 SLC 128GB SSD to move a 15GB block of data to and from the target drive. This is part of our real world test regiment. Roughly 45GB of data resides on the target drive before the '15GB Block' is transfer. The 15GB Block is the same data we built for the Data on Disk Testing and is a mix of compressible and incompressible data.
Directory Copy

Transferring mixed mode data from the Samsung 840 the performance is very good, nearly as fast as the Plextor M5 Pro and SuperSSpeed S301 SLC. Writing data to the Samsung 840 through was not as good and the 840 scored the lowest on the chart.?
Benchmarks - Power Testing
Bapco MobileMark 2012 1.5
Version and / or Patch Used: 2012 1.5
Developer Homepage: http://www.bapco.com
Test Homepage: http://www.bapco.com
MobileMark 2012 1.5 is an application-based benchmark that reflects usage patterns of business users in the areas of office productivity, media creation and media consumption. Unlike benchmarks that only measure battery life, MobileMark 2012 measures battery life and performance simultaneously, showing how well a system design addresses the inherent tradeoffs between performance and power management.

This is where the Samsung 840 kicks ass. The drive uses very little power and allows our notebook to run for nearly 290 minutes. This is the second best result we've tested to date.
PCMark Vantage HDD Test - Power Draw

Here we see how the Samsung 840 does so well in our power test. The 840 250GB drive is the hot pink line on the chart and you can find it at the very bottom in half of the chart. The 840 has very low idle time power draw and the small blimps just off the idle time power are reads. The power kicks up a bit when writing data and the tall spikes are random data writes.?
Final Thoughts

I love Samsung's marketing image of the Cadillac turned into a Porsche GT when viewed through the 840 SSD. I love it so much I had to use it again in the 250GB review. What the advertisement is staying is true. My Lenovo T61p that I've had for at least five years is faster than any new notebook with spinner and the T61p is only SATA 1.5. The problem is I don't need a Samsung 840 to make an old computer feel new or fast. It's still really good marketing and a cool advertisement.
The Samsung 840 is a revolutionary SSD that pairs a cutting edge, low power controller with the latest NAND flash manufacturing process that holds more data per cell than anything else on the market today. Eventually TLC flash will displace MLC in mainstream consumer SSDs. TLC will also increase data capacity in solid state drives - bring on the 1TB models please! Still though, is the 840 the SSD we want today?
I guess it really depends on what you do with your computer. If you are a notebook user, the Samsung 840 offers excellent battery life and since you'll have all of the C-States on you're not going to notice the lower write speed because all ultra high performance SSDs like those in our charts will write at a reduced speed. So, notebook or ultrabook user working off the battery most of the time, you are good.
So what about everyone else? The Samsun 840 250GB offers very good sequential read performance, I would call it superior to everything else on the market sans the 840 Pro that we haven't tested yet. Then we have the write performance and I'd have to say it is the total opposite, one of the worst modern day write speeds of next-gen SSDs. You may wonder how a product that's so good can also be so bad. Well, you have a really good controller that can read from bottom of the barrel flash really quickly, but at the same time, without storing user data in the DRAM buffer, can't overcome TLC's low write performance.
The 500GB version had much better write speed because of parallelism, more die per package and apparently the controller can handle it. The 500GB model also had another advantage; most other 480/512GB drives are slower than the 240/256GB drives. That goes double for LSI SandForce drives because of their DRAM-less design. The same controller used in the SF 240GB drives is the same in the 480GB drives, but the controller has to handle twice the mapping data with the same size buffers (that are internal). So, the Samsung 840 250GB with slower performance has to take on the fastest SandForce controllers.
With the performance out of the way we have to focus on price. SSD pricing is a lot more complicated than it seems. I don't want to go into the full OCZ story, but let's take a very brief run at it. OCZ drove SSD prices down to unprofitable levels. They did this on mainstream drives and even enthusiast / prosumer/ power user products. Enjoy your low cost SSDs now because those days are coming to an end and it started with Vector just a couple of days ago. Still, some SSD manufacturers will keep prices low going into CES and at that point LAMD controllers should pop up from more than just Corsair and they will all cost at least $1 per GB. At the time of writing and going into the holiday season, finding drives for 40 and 50 cents per GB will be pretty common. LSI SandForce controllers will be in most of them and we all know they are pretty damn fast in the same capacity size we're comparing the Samsung 840 to today.
So, Samsung 840 250GB at the time of writing costs $189.99 to $209.99 depending on the accessory package. That's a fair price, but also as the same time the OCZ Vertex 3 Max IOPS with 5K P/E cycle 32nm Toshiba Toggle flash costs $139.99 after a $20 mail-in rebate. Both drives have nearly equal incompressible write speeds, but the advantage goes to Team SandForce since it has a lower price and the boost in compressible data performance. The OCZ drive comes with a desktop adapter bracket too, something desktop users will want.

 United
States: Find other tech and computer products like this
over at
United
States: Find other tech and computer products like this
over at  United
Kingdom: Find other tech and computer products like this
over at
United
Kingdom: Find other tech and computer products like this
over at  Australia:
Find other tech and computer products like this over at
Australia:
Find other tech and computer products like this over at  Canada:
Find other tech and computer products like this over at
Canada:
Find other tech and computer products like this over at  Deutschland:
Finde andere Technik- und Computerprodukte wie dieses auf
Deutschland:
Finde andere Technik- und Computerprodukte wie dieses auf  N64 Recompiled is like RTX Remix for console games, run them natively on PC with ray-tracing
 Microsoft officially bakes in another advertisement into Windows 11
 Samsung is preparing to create the world's first petabyte SSD
 NASA reveals plans to build levitating robots on the surface of the Moon
 Corsair 6500X Mid-Tower Dual Chamber Chassis Review
 Corsair MP700 Pro SE 4TB SSD Review - As Fast as They Come
 Corsair MP600 Mini 2024 Edition 1TB SSD Review - Fastest Tiny Drive on the Planet
 Lexar SL500 1TB Portable SSD Review - The best of native USB
 Corsair Platform:6 Elevate Modular Desk Review
 4K Blu-ray Review") True Lies (1997) 4K Blu-ray Review
True Lies (1997) 4K Blu-ray Review Fractal Design North XL Full-Tower Chassis Review
 Western Digital WD Gold 24TB HDD Review - High-Capacity Masterpiece
 AOC U27G3X 27-inch Gaming Monitor Review - 4K 160Hz for $500
 MSI Vector GP68HX Gaming Laptop Review
 Building the Ultimate Home Entertainment Server with an ASUSTOR NAS and Viper Gaming NVMe SSDs
 Everything you need to know about the latest ASUS NUC Mini PCs - NUC 14 Pro and ROG NUC
 How to Overclock Your GPU and Boost Your PC Gaming with ASUS GPU Tweak III
 ASUS's AMD Radeon RX 7000 Series GPU lineup has something for every gamer
 ASUS OLED Premium Care defends the ROG Swift OLED PG32UCDM gaming monitor from burn-in