
The Bottom Line
Introduction, Specifications, Pricing & Availability
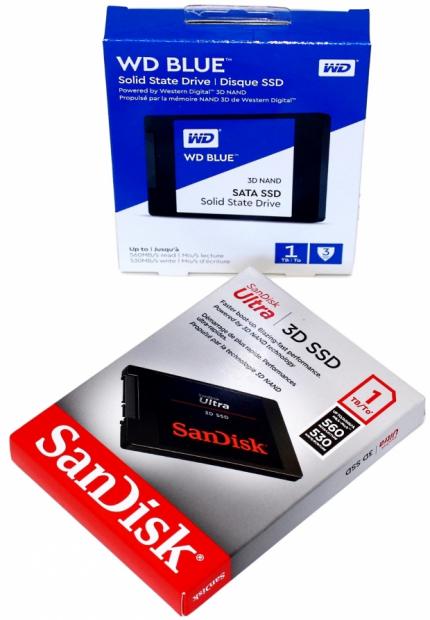
For years, we've been hoping for legitimate competition to challenge the supremacy of Samsung's mighty 850 series SATA III SSDs. To date, nothing powered by TLC flash has been to step up to the table. In-fact, really nothing that is MLC powered has been able to outperform Samsung's 850 EVO series, except for the 850 Pro and even then, it is questionable which is the faster drive. The closest we've come so far with a TLC powered SSD is Intel's 545s which is powered by Intel's second generation 64-layer 3D TLC flash.
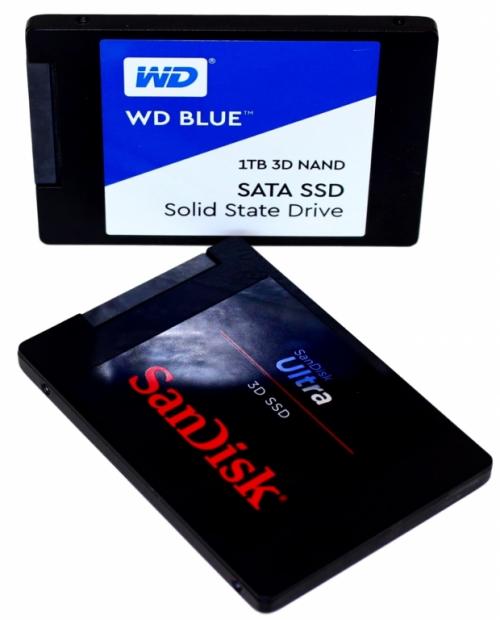
Western Digital became the parent company of SanDisk after wholly acquiring SanDisk back in May of 2016. Western Digital wanted fab-level access to flash and acquiring SanDisk gives them that. Today, Western Digital is taking a stab at the SATA III performance crown with the release of their WD Blue 3D and SanDisk Ultra 3D 1TB SATA III SSDs. The Blue 3D and the Ultra 3D, like their names suggest, are both powered by 3D flash. These are the first 3D flash powered SSDs to hit retail channels from either company, or the same company depending on how you want to look at it.
The similarities run deep between the two SSDs we have on the bench today. In-fact the only difference between the two is the manufacturer's label. Both the Blue 3D and the Ultra 3D, are powered by the same BiCS 3 64-layer 3D flash. As the hardware goes, they are indeed identical. Same controller, same flash array, and the same performance specifications. Even the firmware seems to be identical. Both SSDs are powered by Marvell's hugely popular 88SS1074 4-channel controller.
The inherent properties of 3D flash, give these 3D-flash powered SSDs many advantages over their planar siblings - including higher sustained write performance, increased endurance, and lower power consumption. Western Digital states that both the Blue 3D and Ultra 3D SSDs feature 25% less active power draw than their planar-based predecessors. With less power used you're able to work longer before having to recharge your laptop or other portable devices.
The WD Blue 3D and the SanDisk Ultra 3D 1TB SSDs both have excellent performance specifications and excellent price points. They are both priced well below their 850 EVO equivalent. It seems Samsung has taken notice of this and responded by dropping the price of their 850 EVO series SSDs. However, as it stands currently, the 850 EVO 1TB will cost you about 10% more than a 1TB Blue 3D or Ultra 3D, according to Newegg pricing ($330 vs. $300).
As stated earlier, we have been waiting for years for a TLC-based contender to rise and challenge Samsung's venerable 850 EVO in terms of performance. Is that day finally upon us? Let's dive in and see for ourselves.
Factory Specifications
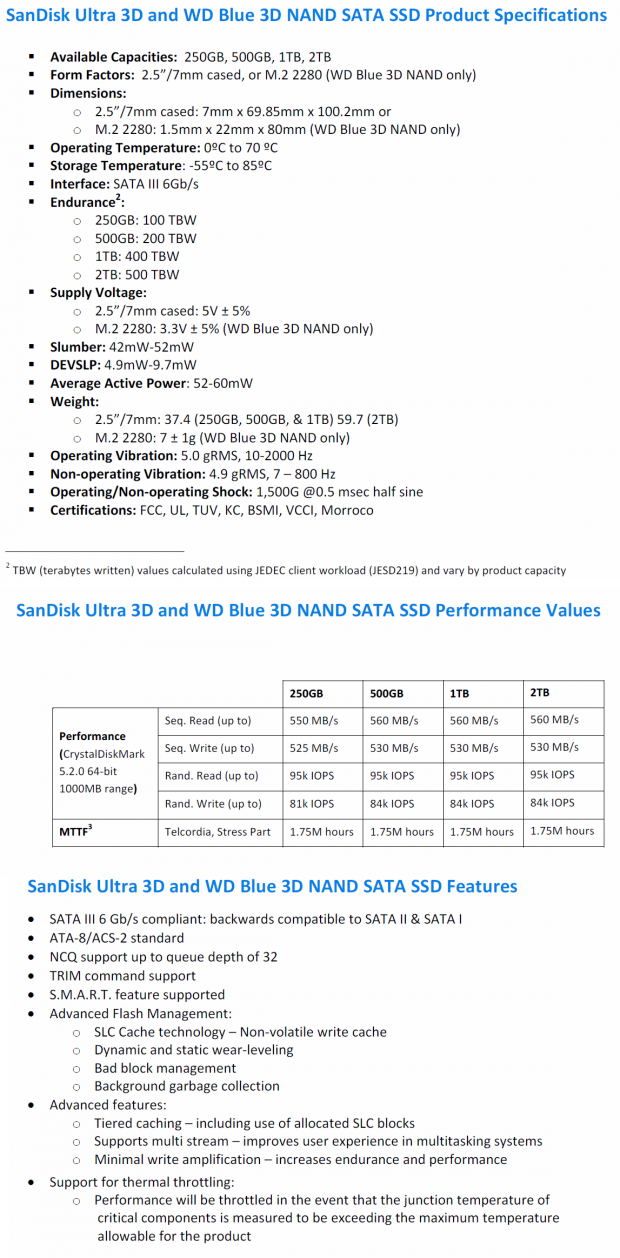
The two 1TB models we have on the bench today sport the following specifications:
- Sequential Read: up to 560 MB/s
- Sequential Write: up to 530 MB/s
- Max 4K Random Read Speed: up to 95,000 IOPS
- Max 4K Random Write Speed: up to 84,000 IOPS
- Endurance: 400TBW
- MTTF: 1.75 Million Hours
- Warranty: 3-Year Limited Warranty
- Avg. Active Power: 52-60mW
- DEVSLP 4.9-9.7mW
- ECC
- SMART
- TRIM
- Garbage Collection
- Software: SSD Toolbox, Acronis Migration Software
Availability: Currently selling at retail outlets.
Both the WD Blue 3D and the SanDisk Ultra 3D are available in capacities ranging from 250GB on up to 2TB. The WD Blue 3D is available in an M.2 x 2280 form factor as well as the conventional 2.5" x 7mm SATA III form factor. The SanDisk Ultra 3D is only available as a 2.5" form factor SSD. Looking at the spec sheet provided to us, we see that performance doesn't drop off by much at the smaller 250GB capacity point; which is encouraging to see.
Drive Details
Western Digital Blue 3D & SanDisk Ultra 3D 1TB SATA III SSDs
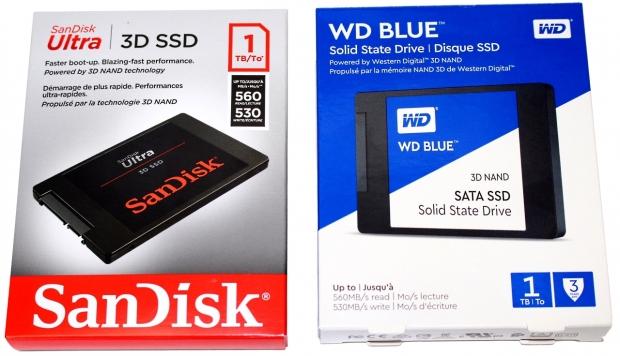
Both SSDs ship in familiar packaging. The Ultra 3D in familiar red and gray and the Blue 3D in the familiar blue and white themed packaging. An image of the enclosed SSD is featured on the front. The drive's sequential read/write performance is advertised here as well. The Blue's 3-year limited warranty is advertised on the front of its packaging.
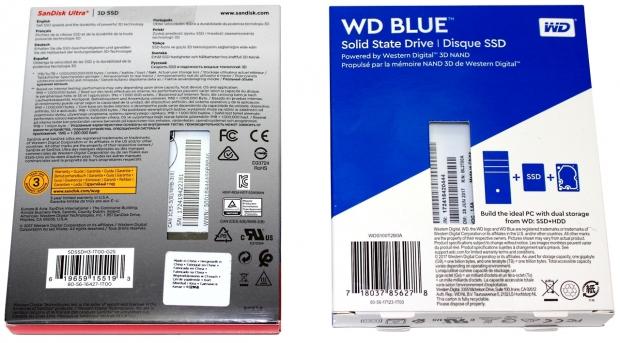
The rear of the Ultra's packaging advertises the drives 3-year limited warranty. The rear of the Blue's packaging suggests that the ideal PC can be built with dual storage from WD: SSD+HDD.
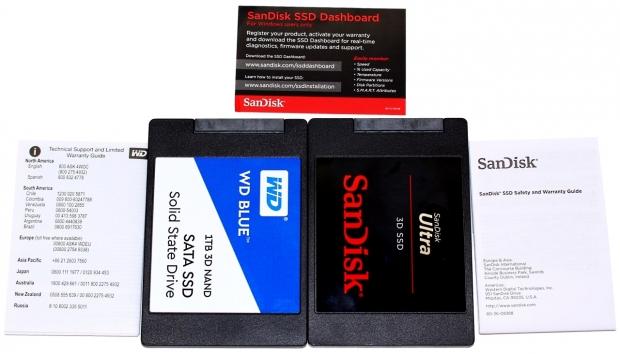
Both drives ship with printed support and warranty guides. The Ultra ships with a printed leaflet that tells you where you can download the SanDisk SSD Dashboard SSD toolbox. WD offers a similar downloadable toolbox but leaves it up to the buyer to figure out where to get it. You can get it HERE You can also download Acronis True Image WD Edition software on the same page. With Acronis, you can easily migrate your current system disk over to your new WD SSD.
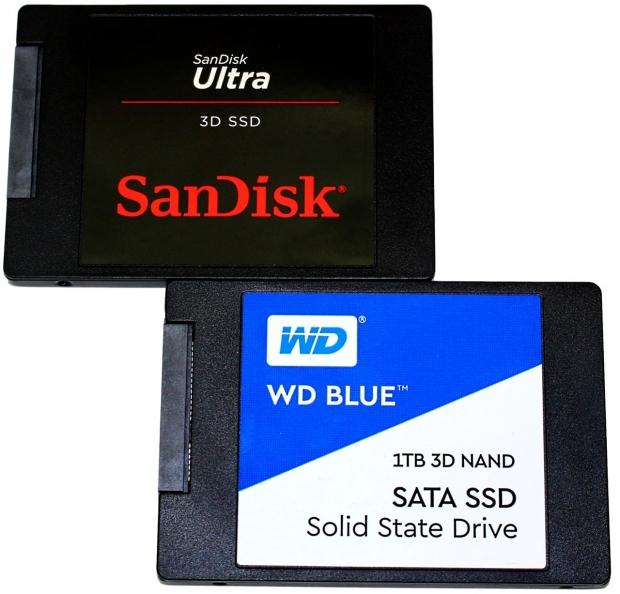
The top of the drive's enclosure is made from plastic.
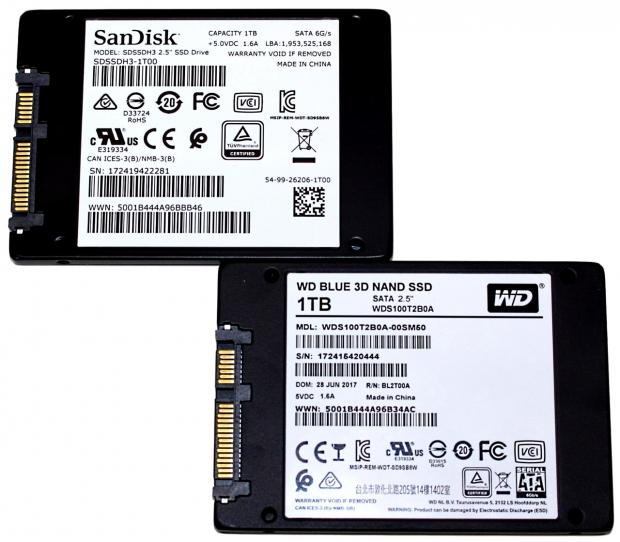
The bottom and sides of the drive enclosure are formed from sheet aluminum. There is a manufacturers' label that lists the particulars of the SSD.
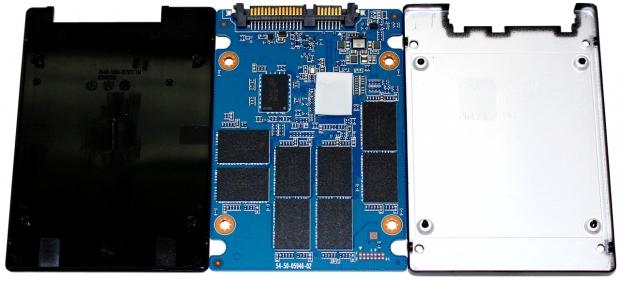
Because both SSDs are identical other than the manufacturers' sticker, we are only opening one of them. The enclosure is held together with four screws that are located under the label on the back of the drive's enclosure. There is a thermal pad placed on the drive's controller.
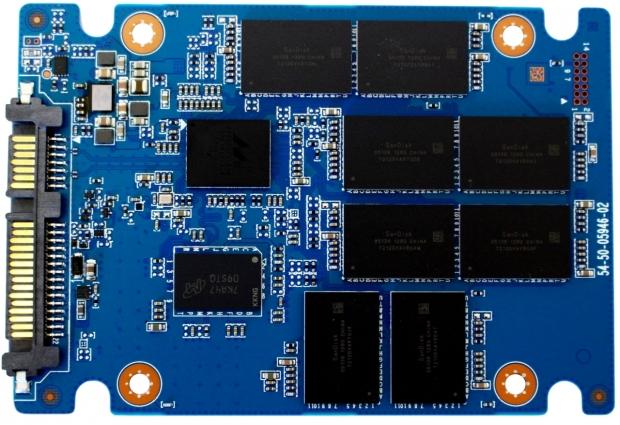
The drive features a full-length PCB that is populated with a Marvell 88SS1074 4-channel controller, eight 128GB 3D NAND packages and one 1024MB Micron DDR DRAM package.
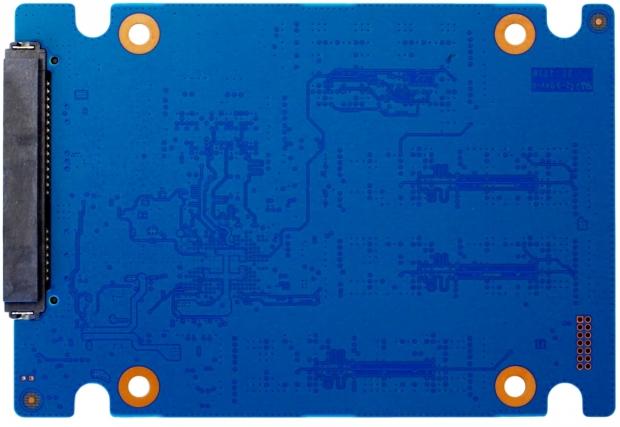
The back half of the blue PCB is devoid of components.
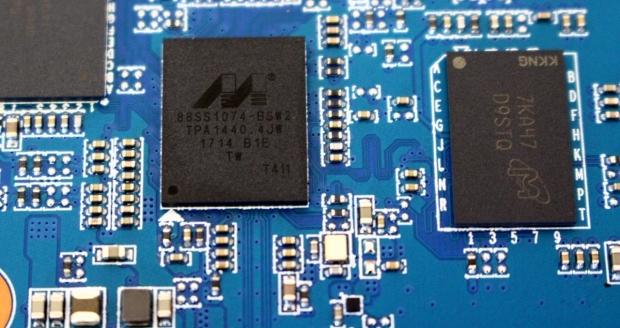
A close-in view of the drive's Marvell 88SS1074 controller and Micron DRAM package.
Test System Setup and Properties
Jon's Consumer SSD Review Test System Specifications
- Motherboard: ASRock Extreme9 Z97 - Buy from Amazon
- CPU: Intel Core i7 4790K @ 4.8GHz - Buy from Amazon / Read our review
- Cooler: Swiftech H2O-320 Edge - Buy from Amazon / Read our review
- Memory: Corsair Dominator DDR3 32GB 2400MHz - Buy from Amazon
- Video Card: Onboard Video
- Case: IN WIN X-Frame - Buy from Amazon / Read our review
- Power Supply: Seasonic Platinum 1000 Watt Modular - Buy from Amazon / Read our review
- OS: Microsoft Windows 10 Professional 64-bit - Buy from Amazon
- Drivers: Intel RAID option ROM version 13.0.0.2075 and Intel RST driver version 14.8.0.1042
We would like to thank ASRock, Crucial, Intel, Corsair, RamCity, IN WIN, and Seasonic for making our test system possible.
Drive Properties
Western Digital Blue 3D 1TB OS Disk 75% Full
SanDisk Ultra 3D OS Disk 75% Full
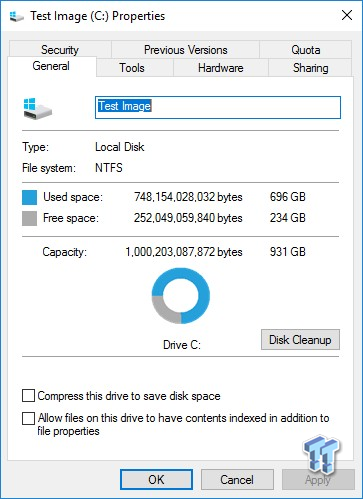
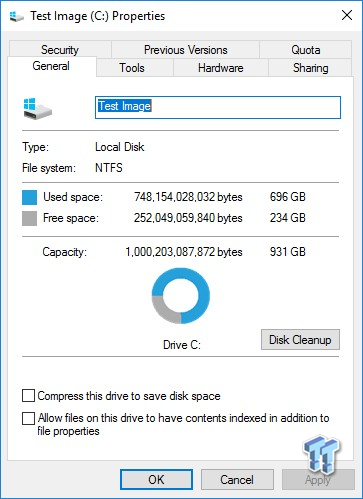
The majority of our testing is performed with our test drive as our boot volume. Our boot volume is 75% full for all OS Disk "C" drive testing to replicate a typical consumer OS volume implementation. We feel that most of you will be utilizing your SSDs for your boot volume and that presenting you with results from an OS volume is more relevant than presenting you with empty secondary volume results. We are utilizing Windows 10 Pro 64-bit OS for all of our testing. Empty Windows 10 benchmark screenshots are shown on our MOP (Maxed-Out Performance) page.
System settings: Cstates and Speed Stepping are both disabled in our systems BIOS. Windows High-Performance power plan is enabled. Windows write caching is enabled, and Windows buffer flushing is disabled.
Please note: When comparing our results to those of other review sites, look at page 10 Maxed Out Performance-Windows 10 which is done with the disk empty.
WD Blue 3D benchmark screenshots will be shown first - followed by the SanDisk Ultra 3D throughout the review.
Synthetic Benchmarks – ATTO & Anvil's
ATTO
Version and / or Patch Used: 2.47
ATTO is a timeless benchmark used to provide manufacturers with data used for marketing storage products. With ATTO, we are looking at maximum sequential performance with compressible data as well as the performance curve.
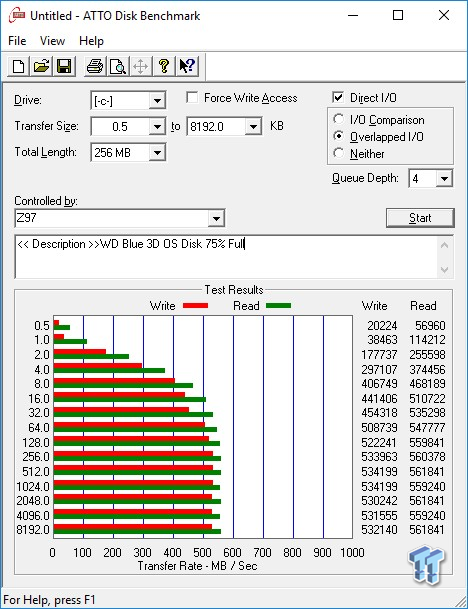
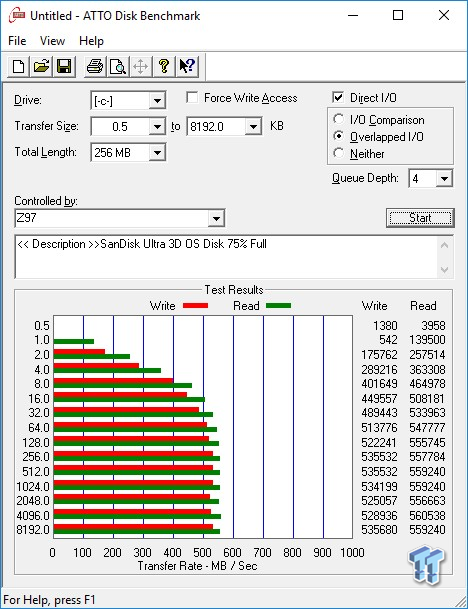
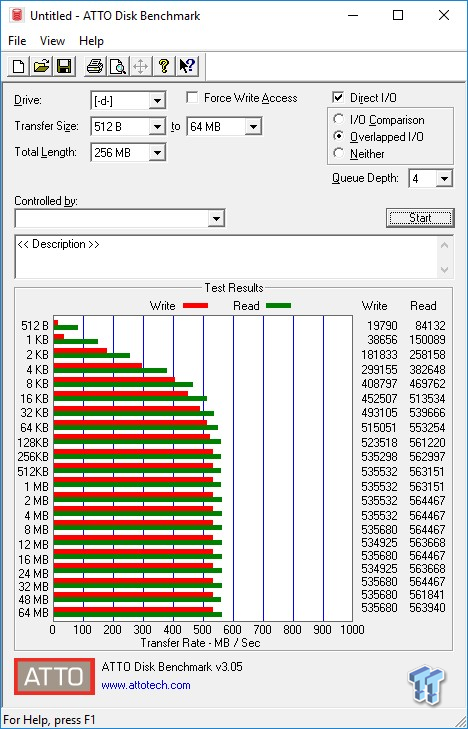
Compressible sequential read/write transfers max out at 560/535 MB/s. Both figures meet or exceed factory specs. Keep in mind this is our OS volume, and it is filled to 75% of its total capacity.
Sequential Write
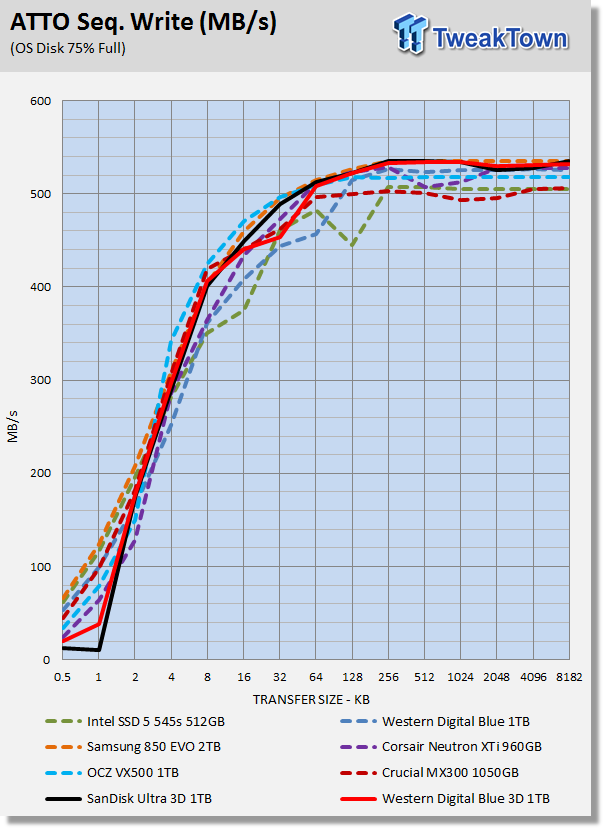
Both SSDs perform almost identically which is to be expected because they are identical hardware configurations. Any deviation from one another is by chance more than anything else. At a 64KB or larger transfer size, both drives are running at the top of the pack. Compared to the planar-flash based WD Blue, the new 3D model delivers significantly better sequential write performance.
Sequential Read
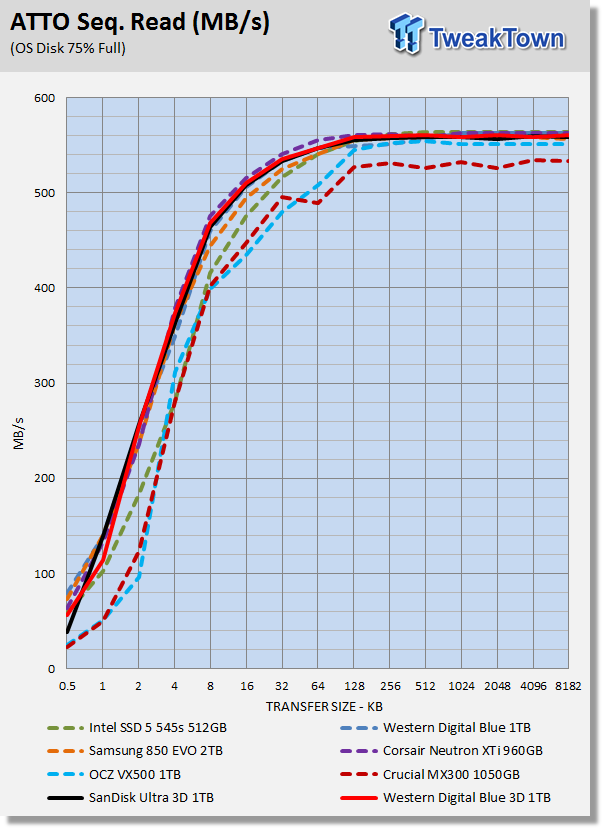
We are looking for a nice smooth performance curve and good small-file performance. Both drives give us what we are looking for.
Anvil Storage Utilities
Version and / or Patch Used: 1.1.0
Anvil's Storage Utilities is a storage benchmark designed to measure the storage performance of SSDs. The Standard Storage Benchmark performs a series of tests; you can run a full test or just the read or write test, or you can run a single test, i.e., 4k QD16. With Anvil's, we are focused on the total score.
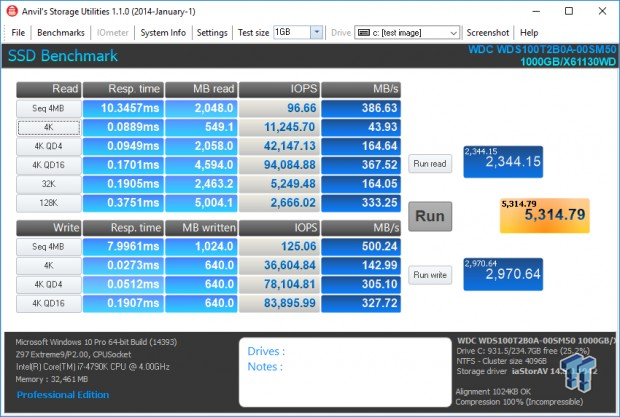
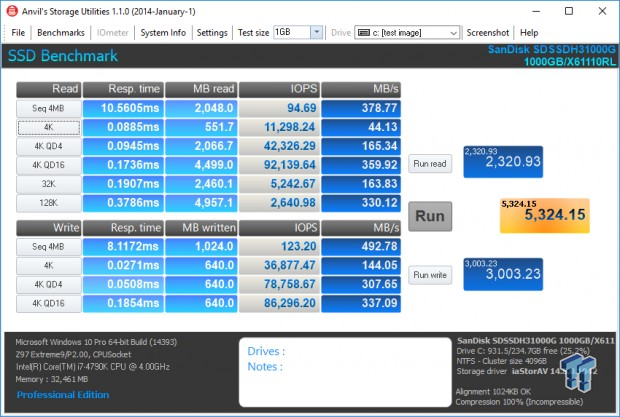
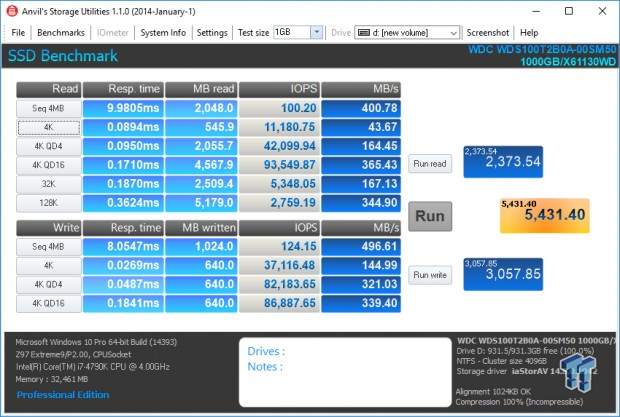
We consider 10K IOPS at QD1 random read a milestone that very few SSDs are capable of delivering. Only the best can do it, and both drives have no problem doing so.
Scoring
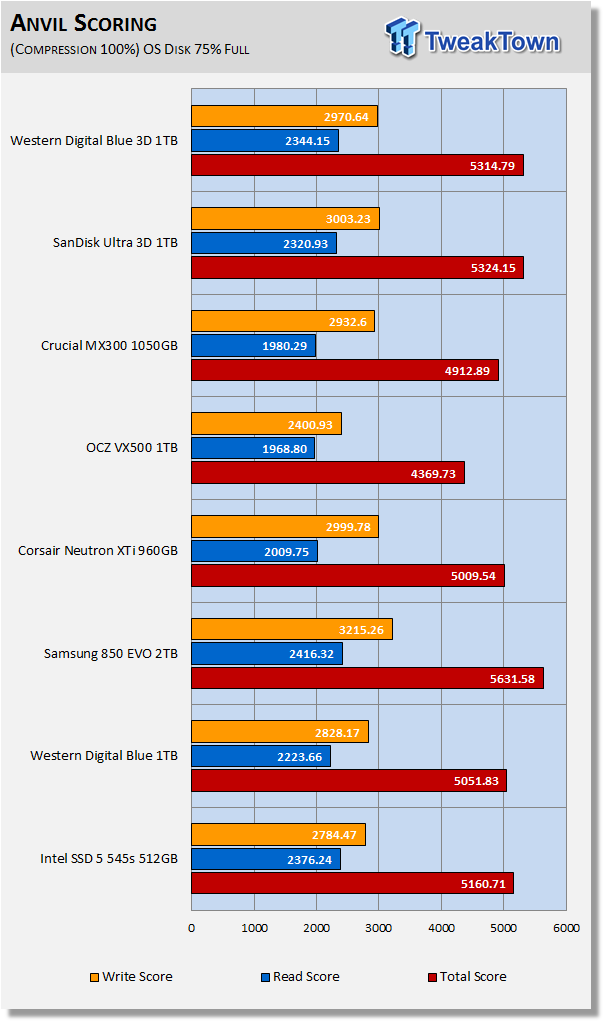
Anvil's scoring typically provides us with a good indication of a drive's overall synthetic performance. Whenever we get a score of over 5,000, we take notice. Both the Ultra 3D and the Blue 3D give us something to take notice of - and then some. Of the drives in our test pool, only the 850 EVO does better. The scoring of both of our test subjects would be significantly higher if the sequential read performance was better. This seems to be an anomaly with Anvil's benchmark.
(Anvil) Read IOPS through Queue Depth Scale
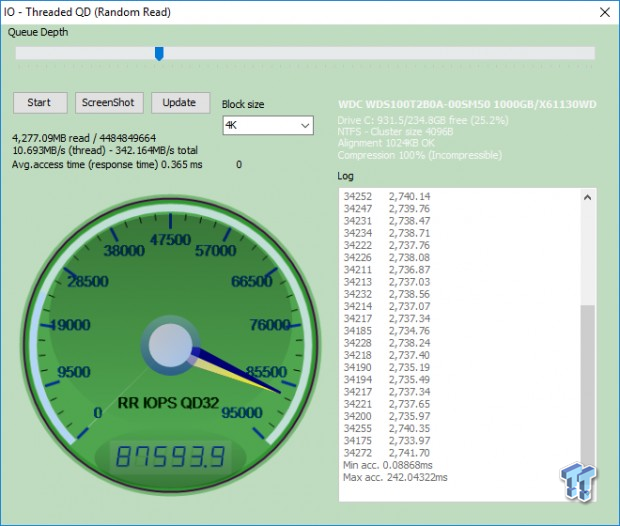
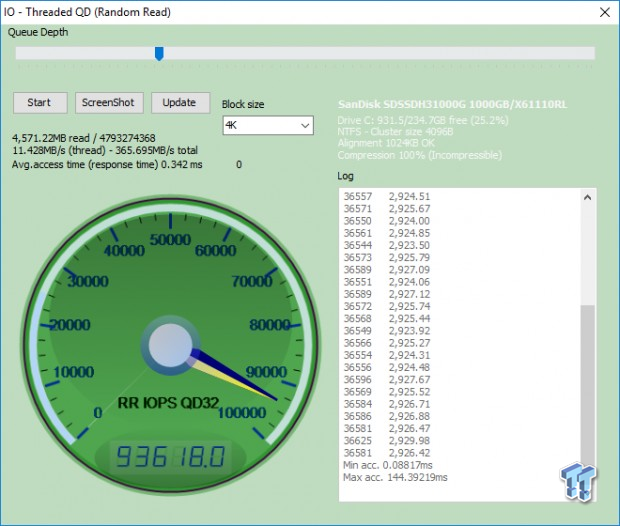
With a partition on the drives and 75% full, neither the Blue 3D or the Ultra 3D are able to hit factory max random read specs. Close enough though.
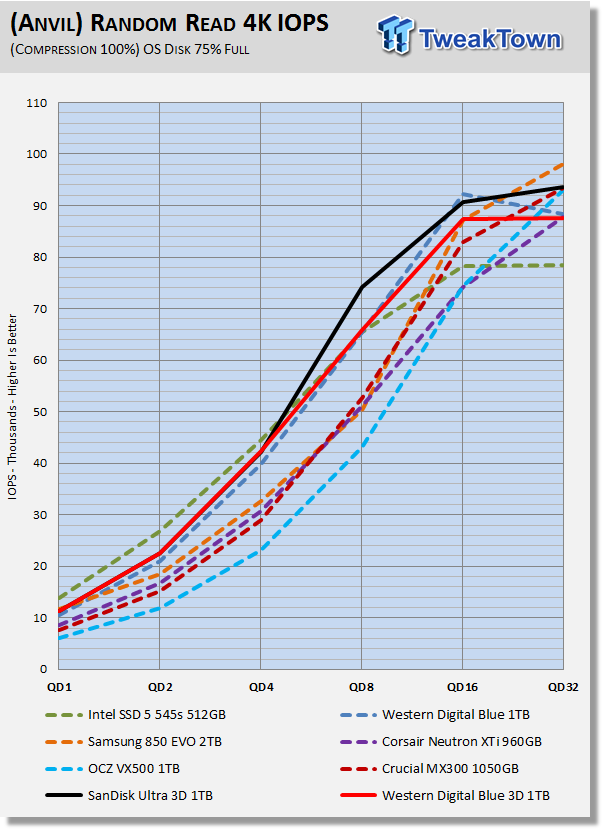
Intel's 545s delivers better random read performance at low queue depths. Overall though, both the Ultra 3D and the Blue 3D deliver stellar performance that is as good or better than any of the SSDs in our test pool.
(Anvil) Write IOPS through Queue Scale
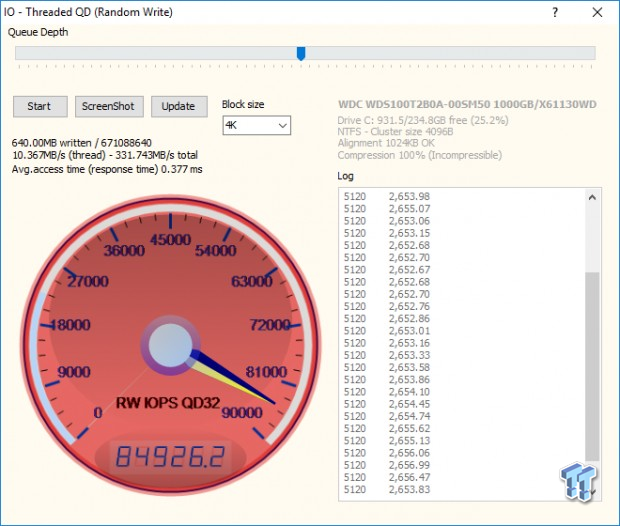
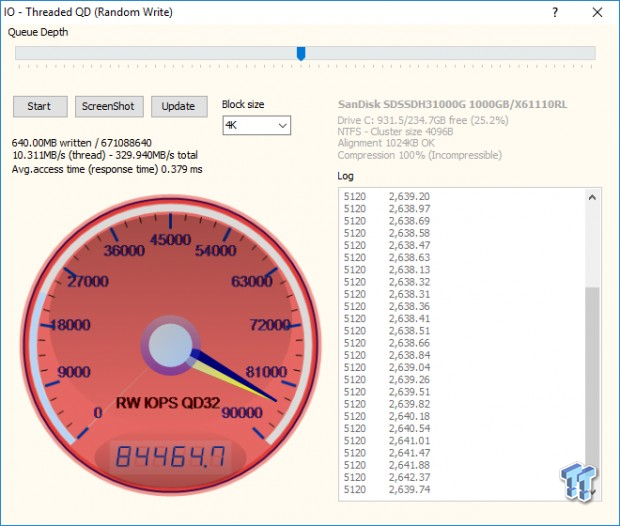
We are able to hit factory max random write specs (84K IOPS at QD32) even when the drives are 75% full.
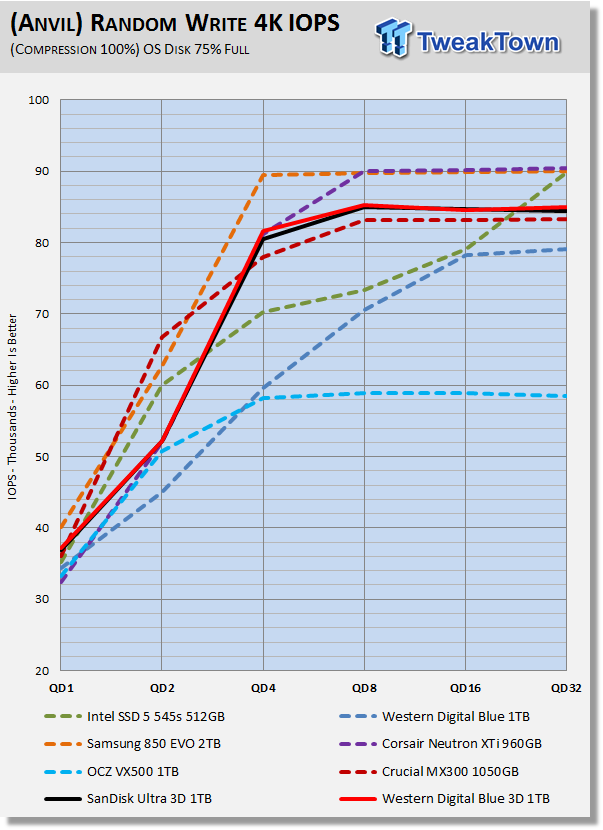
The Blue 3D and Ultra 3D both deliver a huge performance increase over their planar sibling; the WD Blue. In terms of performance against the contenders in our test pool, the Blue 3D and the Ultra 3D deliver middle of the road random write performance.
Synthetic Benchmarks – CDM & AS SSD
CrystalDiskMark
Version and / or Patch Used: 3.0 Technical Preview
CrystalDiskMark is disk benchmark software that allows us to benchmark 4k and 4k queue depths with accuracy. Note: Crystal Disk Mark 3.0 Technical Preview was used for these tests since it offers the ability to measure native command queuing at QD4. With this version of CDM, we are focused on 4K random performance at QD1 and QD4.
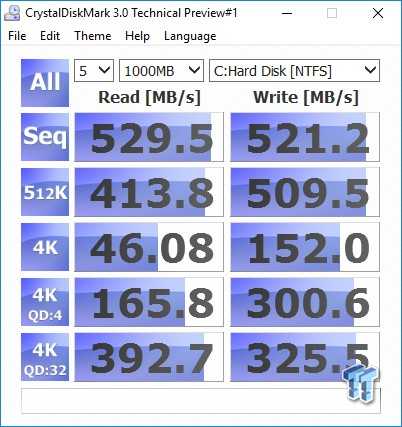
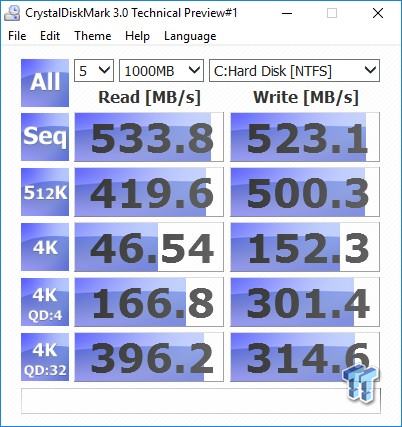
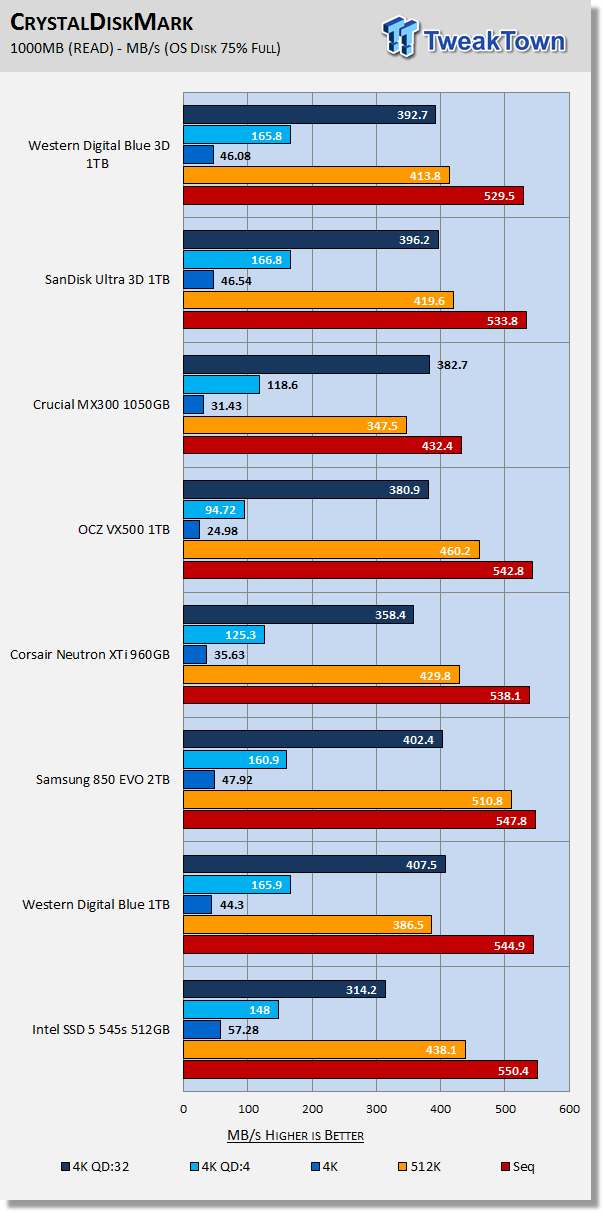
Focusing in on 4K QD1 and 4K QD4, we are getting very strong performance from both the Blue 3D and Ultra 3D. At QD4, both drives lead the field. At QD1 only the 850 EVO and the Intel 545s deliver better performance.
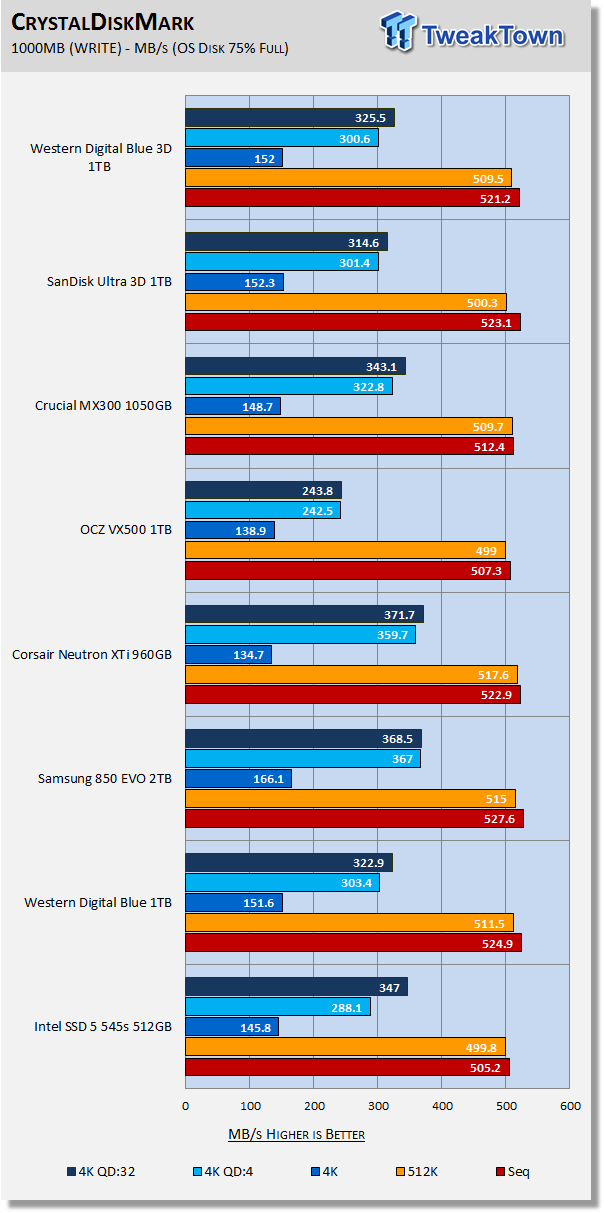
The Blue 3D and Ultra 3D both deliver exceptionally strong random write performance at QD1. This is where it matters most, and this is where both drives deliver the goods. The 850 EVO is once again proving to be very hard to match in terms of sheer performance.
AS SSD
Version and / or Patch Used: 1.8.5611.39791
AS SSD determines the performance of SSDs. The tool contains four synthetic as well as three practice tests. The synthetic tests are to determine the sequential and random read and write performance of the SSD. We focus on the total score when evaluating AS SSD results.
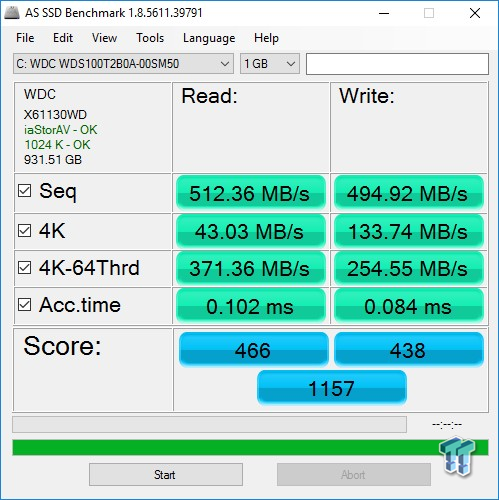
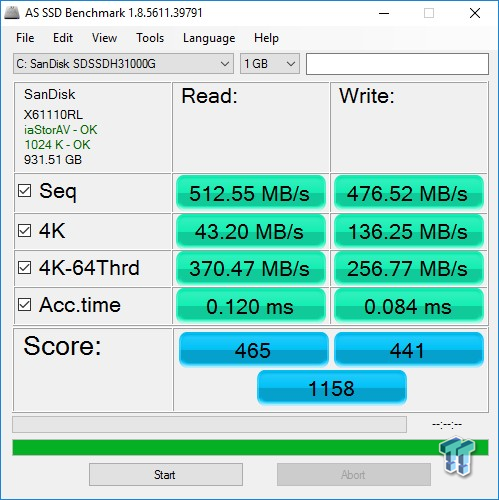
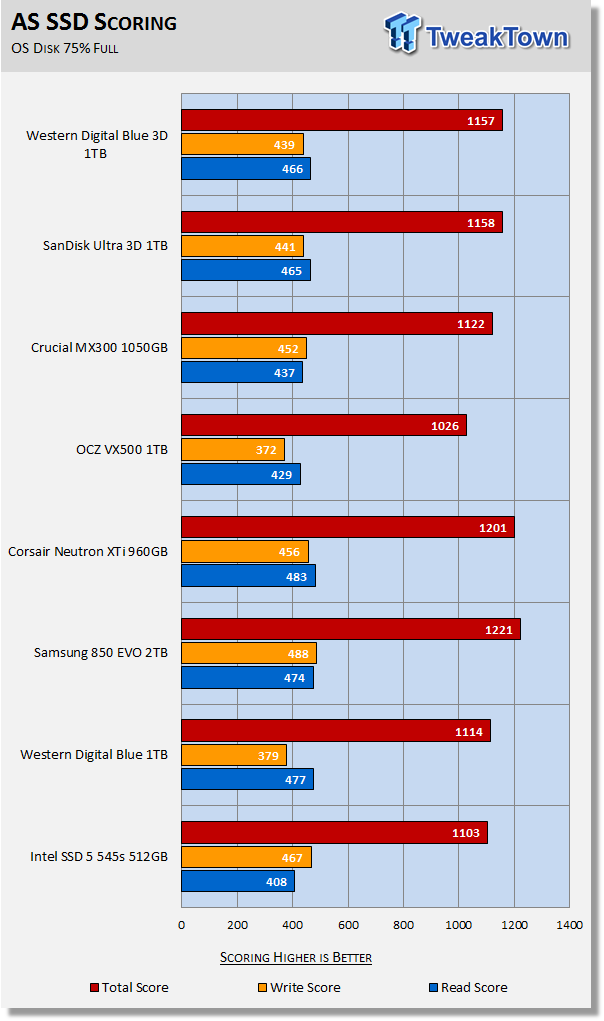
AS SSD is a demanding test. With AS SSD we are looking for a minimum score of 1000 from a TLC SSD. The Ultra 3D and the Blue 3D are both able to exceed 1150 points. Both outscore their predecessor, the WD Blue, and Intel's 545s, which is also based on 64-layer TLC technology.
Benchmarks (OS) - Vantage, PCMark 7, PCMark 8 & SYSmark 2014 SE
Consumer Workloads
We categorize these tests as indicative of a moderate workload environment.
PCMark Vantage - Hard Disk Tests
Version and / or Patch Used: 1.2.0.0
The reason we like PCMark Vantage is because the recorded traces are played back without system stops. What we see is the raw performance of the drive. This allows us to see a marked difference between scoring that other trace-based benchmarks do not exhibit. An example of a marked difference in scoring on the same drive would be empty vs. filled vs. steady state.
We run Vantage three ways. The first run is with the OS drive 75% full to simulate a lightly used OS volume filled with data to an amount we feel is common for most users. The second run is with the OS volume written into a "Steady State" utilizing SNIA's guidelines. Steady state testing simulates a drive's performance similar to that of a drive that been subjected to consumer workloads for extensive amounts of time. The third run is a Vantage HDD test with the test drive attached as an empty, lightly used secondary device.
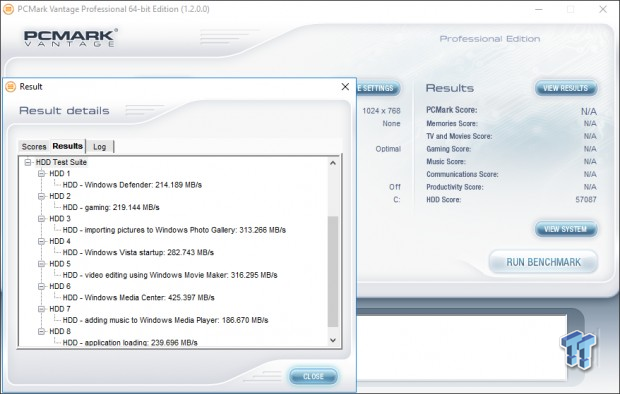
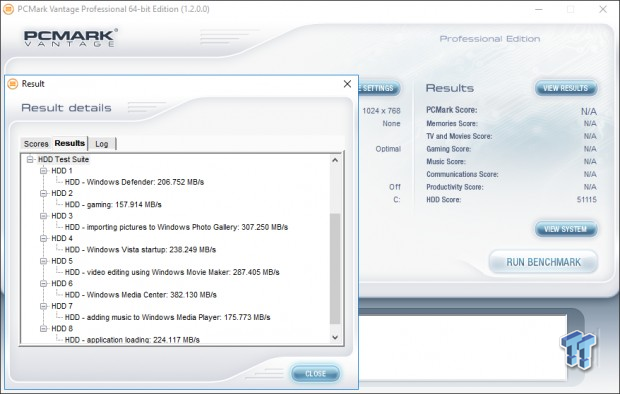
OS Volume 75% Full - Lightly Used
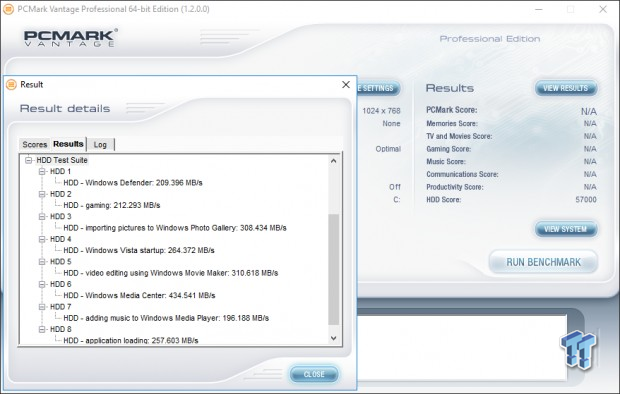
OS Volume 75% Full - Steady State
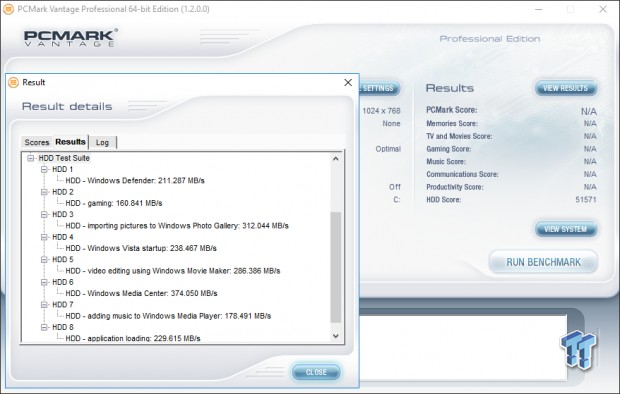
Secondary Volume Empty - FOB
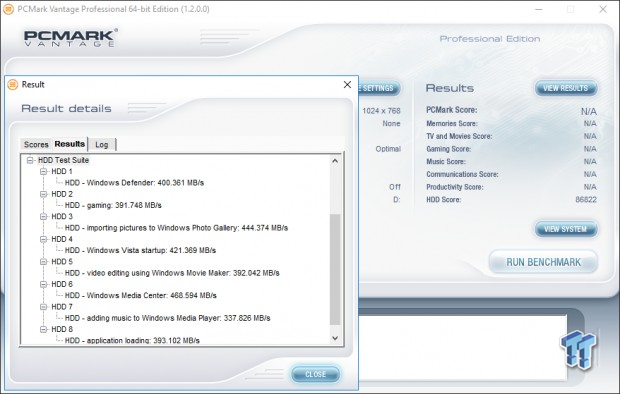
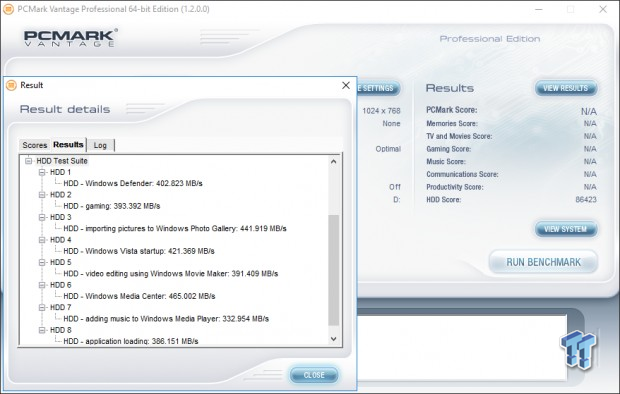
There's a big difference between an empty drive, one that's 75% full/used, and one that's in a steady state.
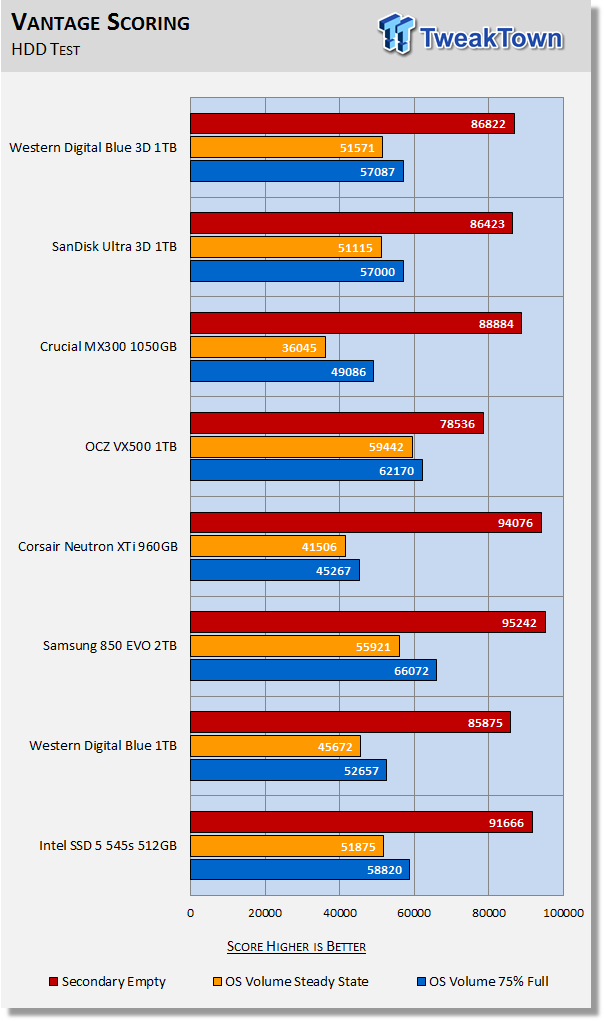
The important scores to pay attention to are "OS Volume Steady State" and "OS Volume 75% full." These two categories are most important because they are indicative of typical consumer user states. When a drive is in a steady state, it means garbage collection is running at the same time it's reading/writing. This is exactly why we focus on steady state performance. We are looking for a minimum score of 50K when the drive is in a steady state.
Both the Ultra 3D and the Blue 3D are able to exceed 50K when in a steady-state. This is a good showing. We once again see a nice improvement over their planar predecessor the WD Blue. Matching the 850 EVO's performance is proving to be a challenge.
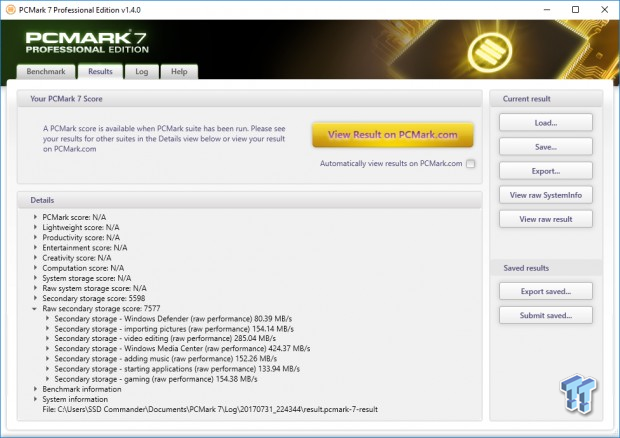
PCMark 7 - System Storage
Version and / or Patch Used: 1.4.0
We will look to Raw System Storage scoring for evaluation because it's done without system stops and, therefore, allows us to see significant scoring differences between drives.
OS Volume 75% Full - Lightly Used
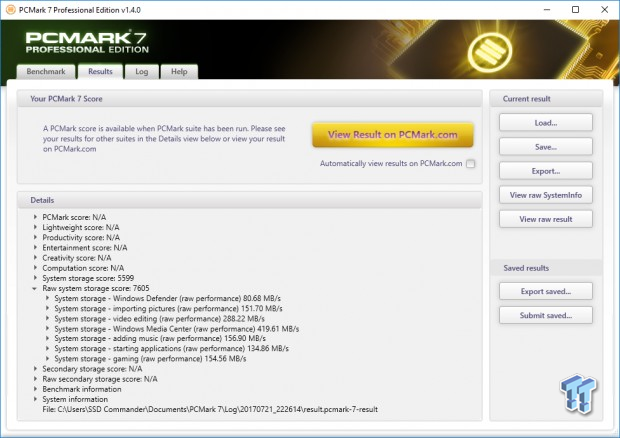
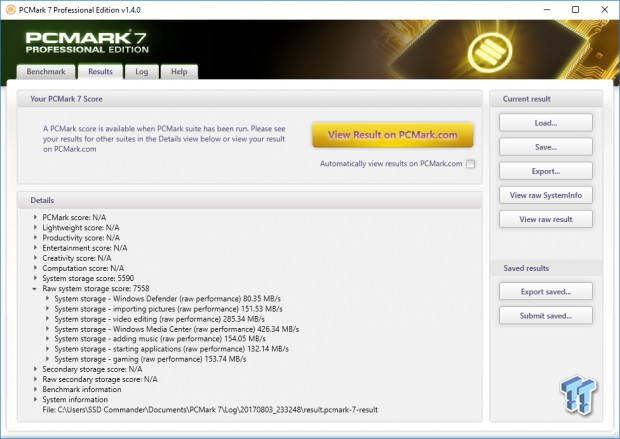
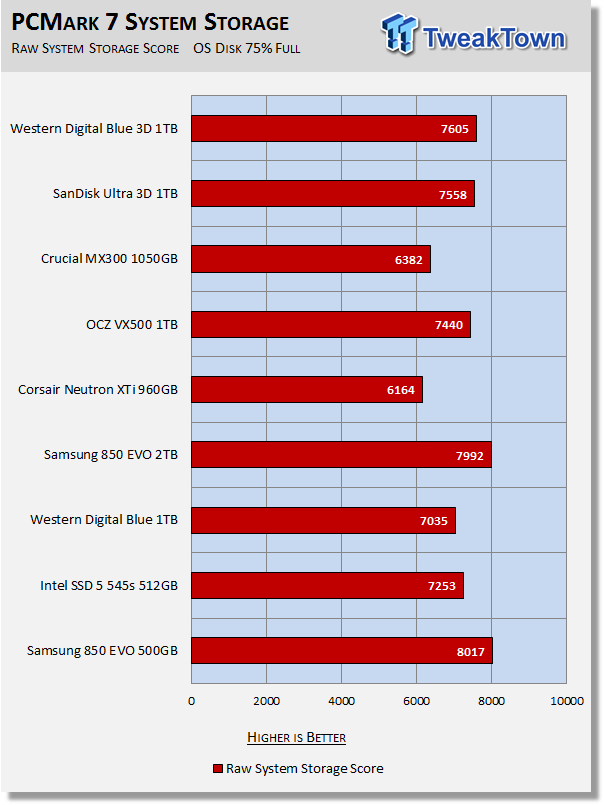
Whenever a SATA SSD scores 7K or above with PCMark 7, it is in an elite class. We are pleasantly surprised to see the Ultra 3D and the Blue 3D are able to outperform the VX500 in this test. The VX500 is tough to beat when it comes to consumer workloads, but the 850 EVO is even tougher to beat.
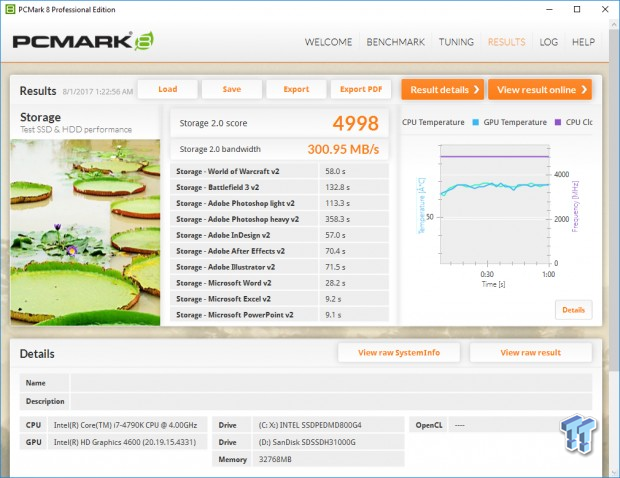
PCMark 8 - Storage Bandwidth
Version and / or Patch Used: 2.4.304
We use PCMark 8 Storage benchmark to test the performance of SSDs, HDDs, and hybrid drives with traces recorded from Adobe Creative Suite, Microsoft Office, and a selection of popular games. You can test the system drive or any other recognized storage device, including local external drives. Unlike synthetic storage tests, the PCMark 8 Storage benchmark highlights real-world performance differences between storage devices. We focus on the total score first and then storage bandwidth when evaluating PCMark 8 results.
OS Volume 75% Full - Lightly Used
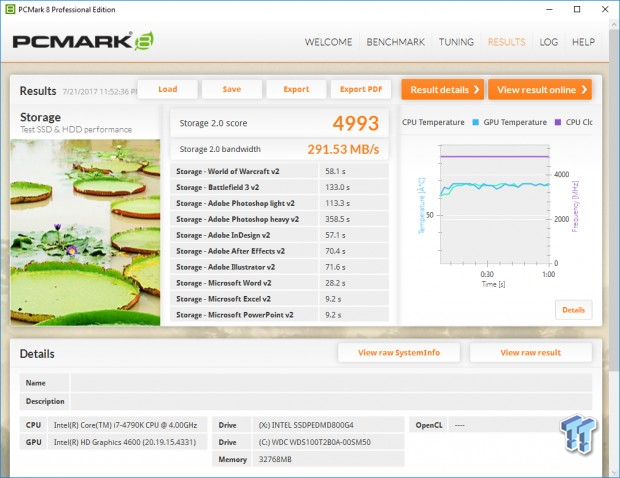
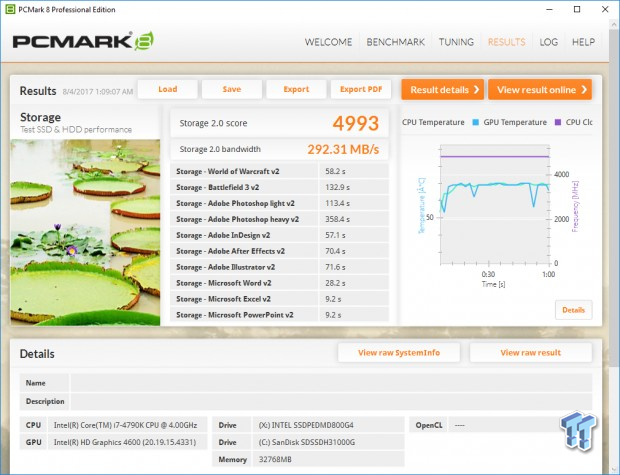
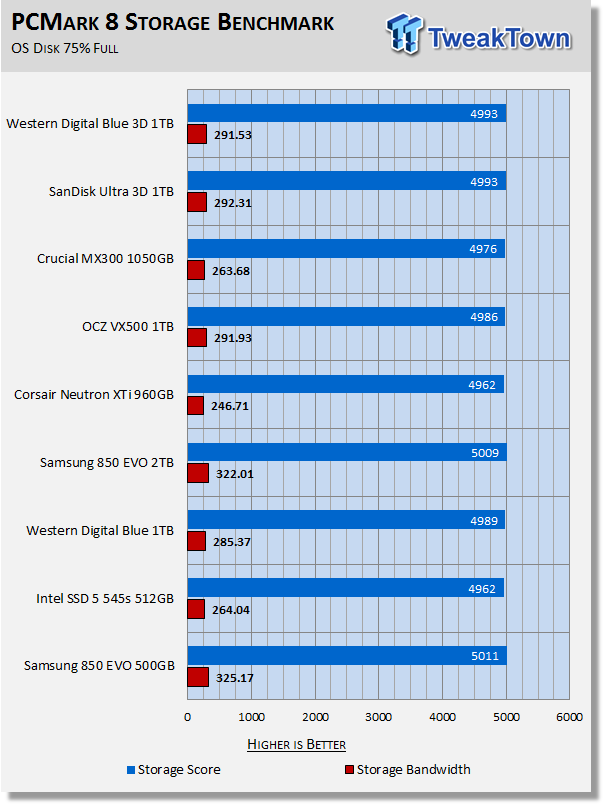
PCMark 8 is the most intensive moderate workload simulation we run. With respect to moderate workloads, this test is what we consider the best indicator of a drive's overall performance.
Again, the Ultra 3D and the Blue 3D both outperform the hard to beat VX500. They both also outperform the planar-based WD Blue. Once again, the 850 EVO comes out on top. We should point out that the 850 EVO we have in our test pool is a 2TB model because we don't have a 1TB model for comparison. However, based on our 500GB 850 EVO results, we believe there is no advantage for the 2TB 850 EVO coming by way of capacity.
BAPCo SYSmark 2014 SE System Performance
Version and / or Patch Used: 2.0.0.70
SYSmark 2014 SE is considered the gold standard for testing system performance because it is an application based benchmark. This test gives us the ultimate in real-world results because it utilizes actual applications running on the system, instead of playing back recorded traces. If you want to know what kind of impact a particular SSD will have on your system's overall performance; this test will show you.
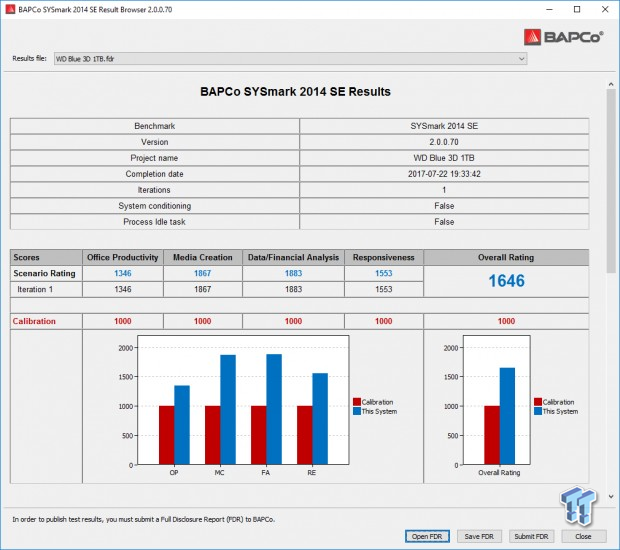
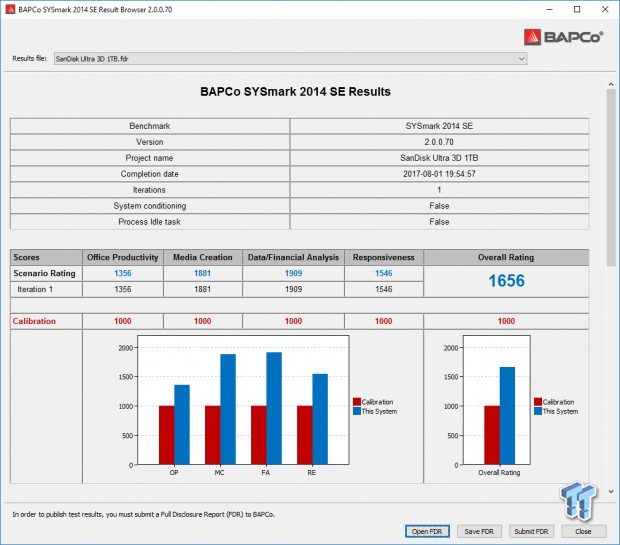
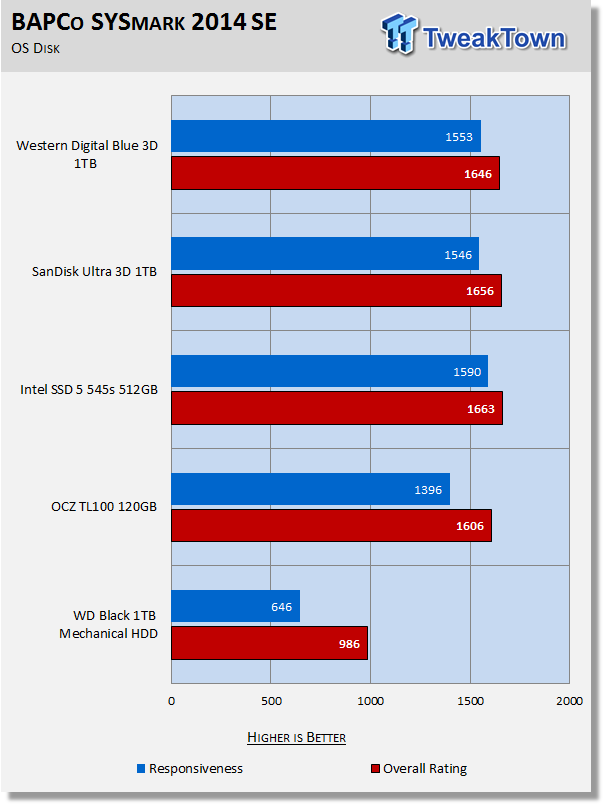
Our systems are much more powerful than the calibration system (1000-point baseline) used by BAPCo, so we ran an OCZ TL100 120GB SATA III SSD to establish a comparison point relative to our test systems. We will be running this test going forward, and we will add drives to our chart as we test them.
We don't have very many SSDs on our chart yet, but both the Ultra 3D and the Blue 3D deliver a score that indicates Tier 1 performance. The difference between the Blue 3D and the Ultra 3D in scoring is nothing more than the variability between runs. We can expect a bit of variability whenever an SSD has an SLC cache. The Intel 545s scores higher due to its superior 4K QD1 random read performance.
Note: we are replacing our PCMark 8 Extended testing with SYSmark because we believe SYSmark is much more relevant for consumer SSD testing.
Benchmarks (Secondary) – IOPS, Response & Transfers
Iometer – Maximum IOPS
Version and / or Patch Used: Iometer 2014
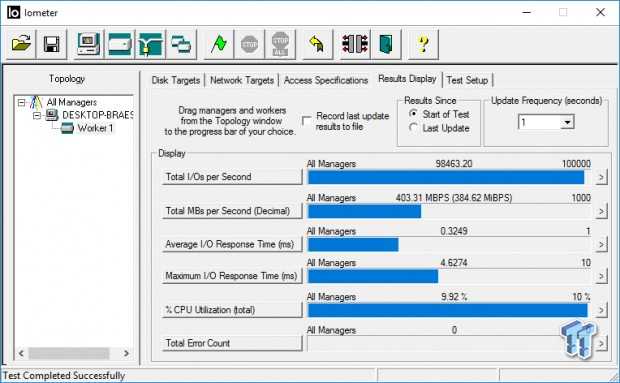
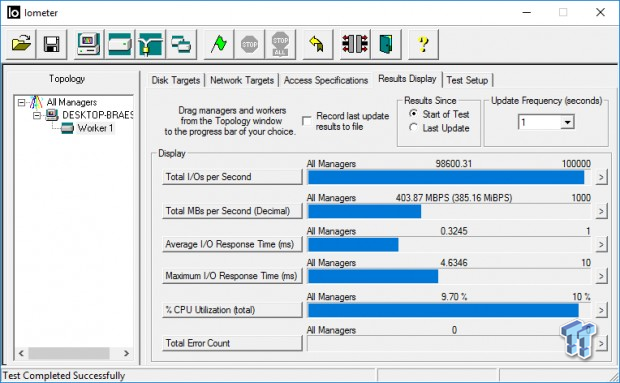
We use Iometer to measure high queue depth performance. (No Partition)
Max IOPS Read
Max IOPS Write
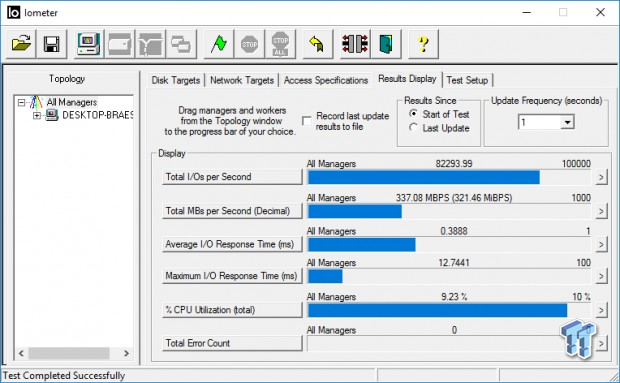
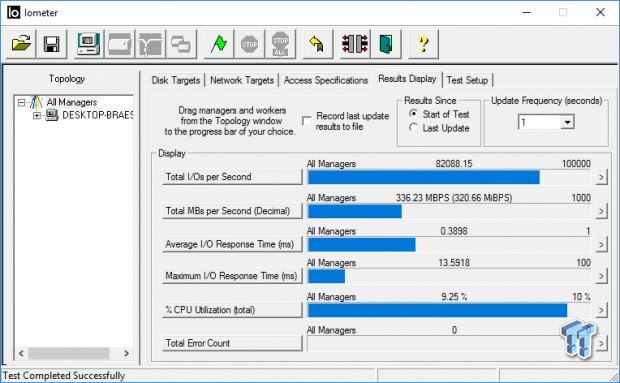
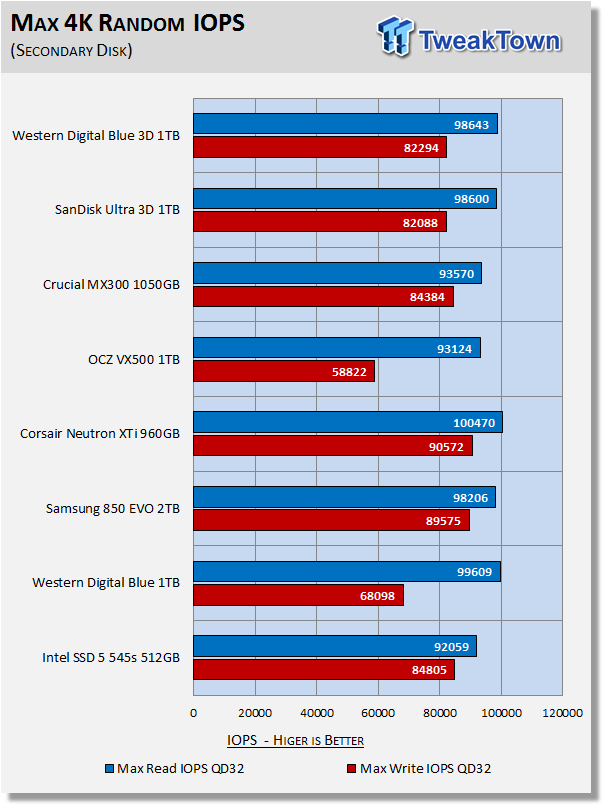
The Blue 3D and the Ultra 3D perform identically. We are able to exceed the factory max random read spec's by 3K, but fall 2K short on the write side.
Iometer – Disk Response
Version and / or Patch Used: Iometer 2014
We use Iometer to measure disk response times. Disk response times are measured at an industry accepted standard of 4K QD1 for both write and read. Each test runs twice for 30 seconds consecutively, with a 5-second ramp-up before each test. We partition the drive/array as a secondary device for this testing.
Avg. Write Response
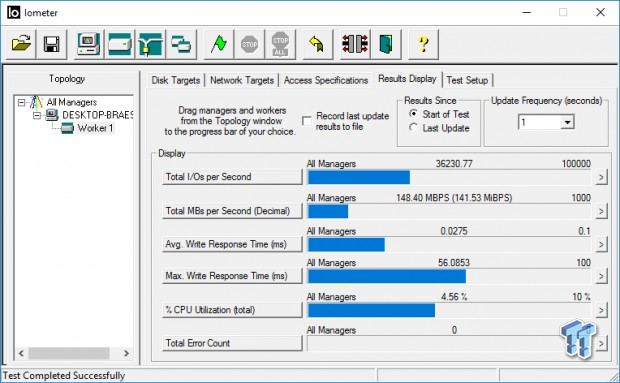
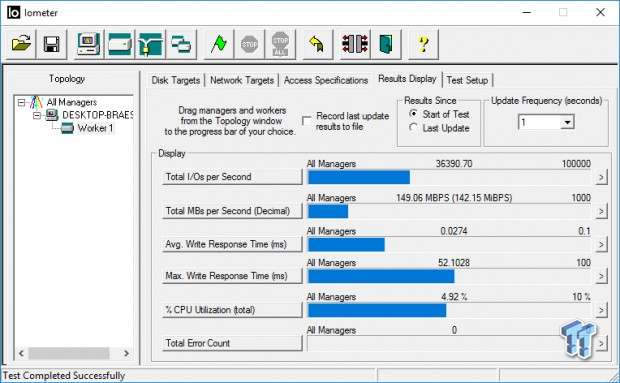
Avg. Read Response
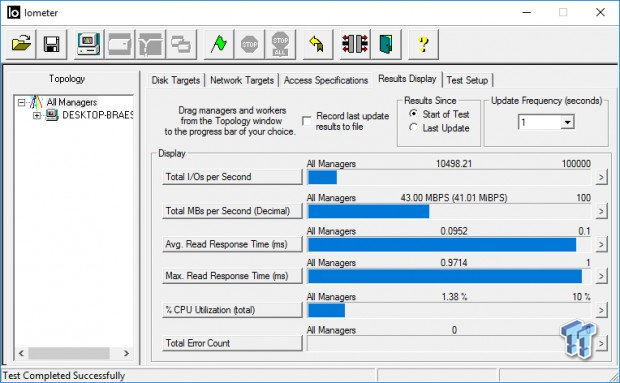
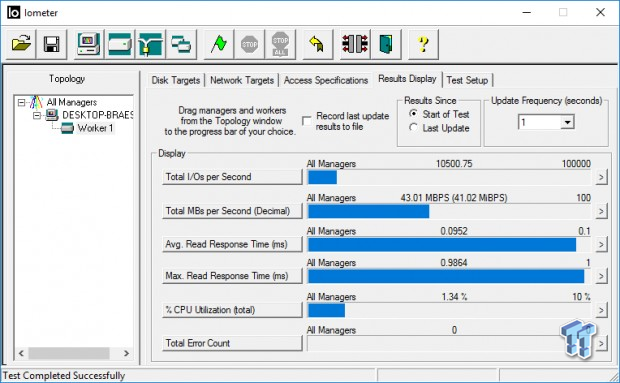
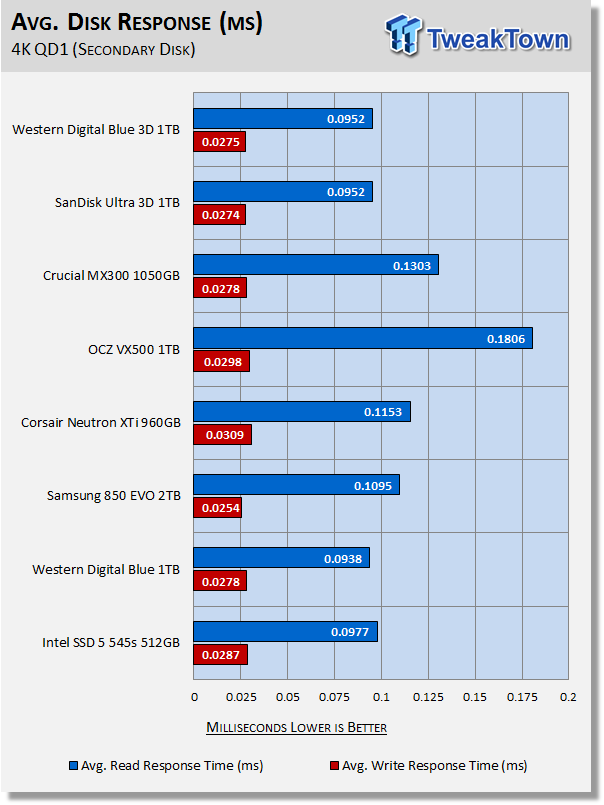
The Blue 3D and the Ultra 3D both deliver excellent response times. Better read response than the 850 EVO.
DiskBench - Directory Copy
Version and / or Patch Used: 2.6.2.0
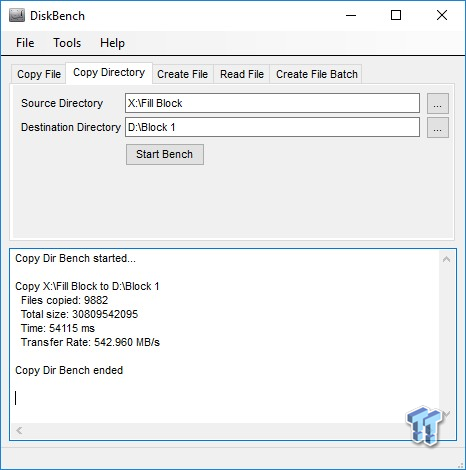
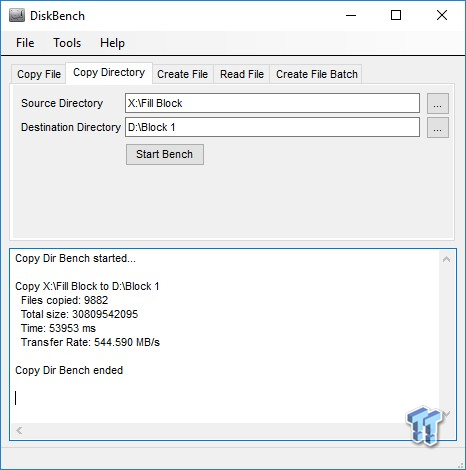
We use DiskBench to time a 28.6GB block (9,882 files in 1,247 folders) composed primarily of incompressible sequential and random data as it's transferred from our DC P3700 PCIe NVME SSD to our test drive. We then read from a 6GB zip file that's part of our 28.6GB data block to determine the test drive's read transfer rate. Our system is restarted prior to the read test to clear any cached data, ensuring an accurate test result.
Write Transfer Rate
Read Transfer Rate
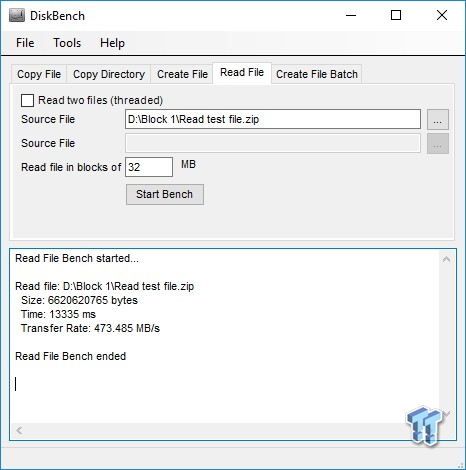
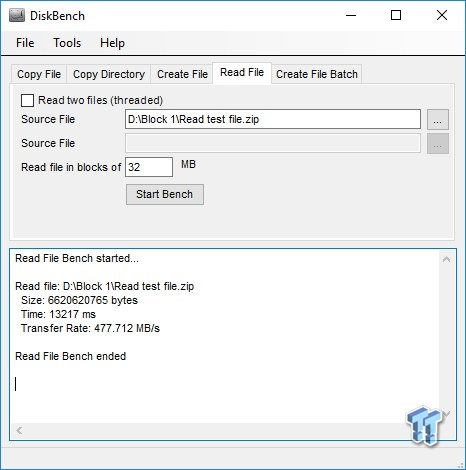
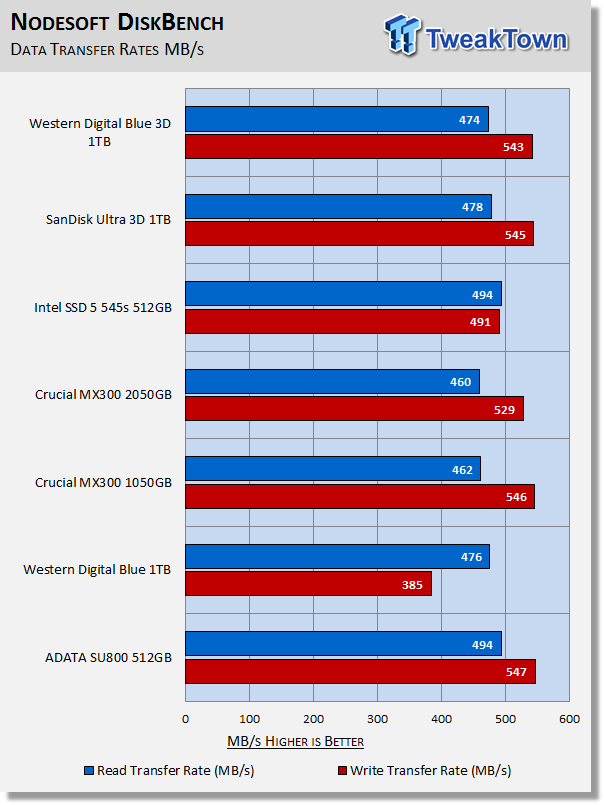
When testing write transfer rates, we have a rule of thumb. If any SSD cannot achieve 200MB/s with our write transfer test, that SSD will not receive a TweakTown recommendation. There are many TLC SSDs that do not pass our minimum, but we didn't include those on our chart. Additionally, we recently updated to Windows 10 Anniversary Edition and with that update, sustained write performance greatly increased. This means our previous transfer tests cannot be compared with those run on the newer version on Windows 10. This is the reason we only have a few drives on our chart.
Comparing the Blue 3D and the Ultra 3D to the planar based WD Blue really serves to illustrate the performance advantage that 3D flash has over planar.
Benchmarks – 70/30 Mixed Workload & Sustained Sequential Write
70/30 Mixed Workload Test (Sledgehammer)
Version and / or Patch Used: Iometer 2014
Heavy Workload Model
This test hammers a drive so hard we've dubbed it "Sledgehammer." Our 70/30 Mixed Workload test is designed to simulate a heavy-duty enthusiast/workstation steady-state environment. We feel that a mix of 70% read/30% write, full random 4K transfers best represents this type of user environment. Our test allows us to see the drive enter into and reach a steady state as the test progresses.
Phase one of the test preconditions the drive for 1 hour with 128K sequential writes at QD32. Phase two of the test runs a 70% read/30% write at QD32, full random 4K transfer workload on the drive for 1 hour. We log and chart (phase two) IOPS data at 5-second intervals for 1 hour (720 data points). 60 data points = 5 minutes.
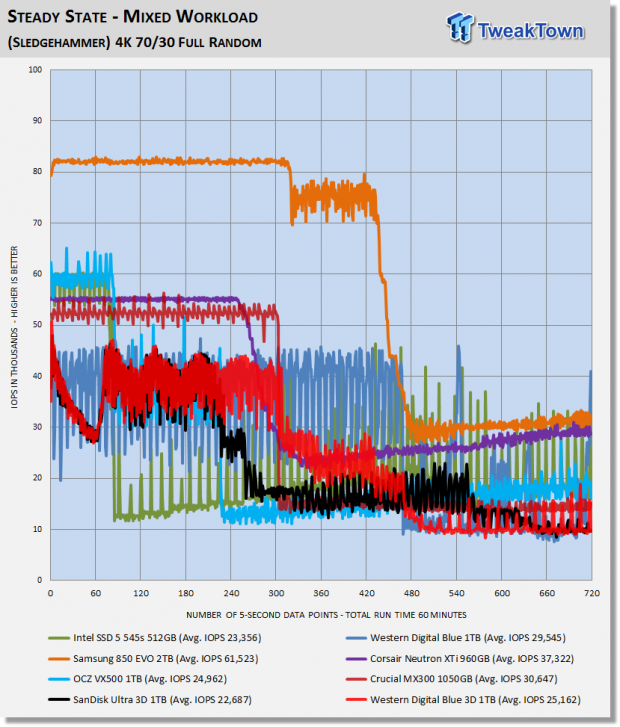
What we like about this test is that it reflects reality. Everything lines up, as it should. Consumer drives don't outperform Enterprise-Class SSDs that were designed for enterprise workloads. Consumer drives based on old technology are not outperforming modern Performance-Class SSDs, etc.
As we saw when we tested the Toshiba XG5 which uses the same 64-layer flash as the Blue 3D and the Ultra 3D, the sledgehammer drops pretty hard on BiCS 3. Just as it does on Intel 64-layer flash. Even the planar based WD Blue delivers better average performance.
Sustained Sequential Write
Version and / or Patch Used: Iometer 2014
Heavy Workload Model
We write to the drive for 1 hour with 128K sequential writes at QD32. We log and chart megabytes per second data at 5-second intervals for 1 hour (720 data points). 60 data points = 5 minutes.
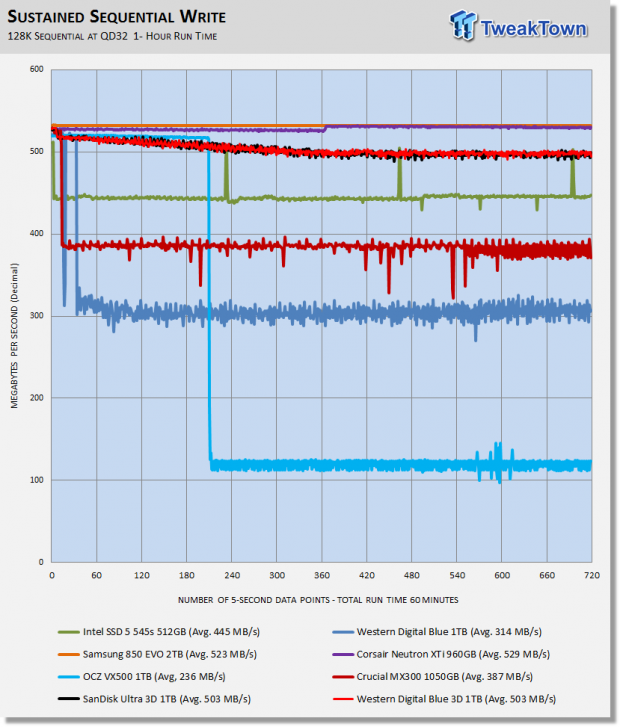
The Blue 3D and the Ultra 3D both deliver an average sustained sequential write performance of 503 MB/s for an hour. This isn't as good as we are getting from the 850 EVO, but it is far better than we are getting from Intel's 545s which is based on IMFT 64-layer flash. This further illustrates the advantage that TLC 3D flash has over planar TLC flash.
Maxed-Out Performance (MOP)
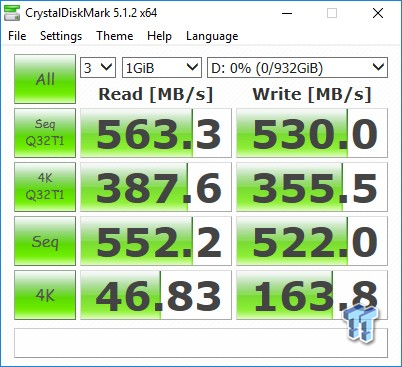
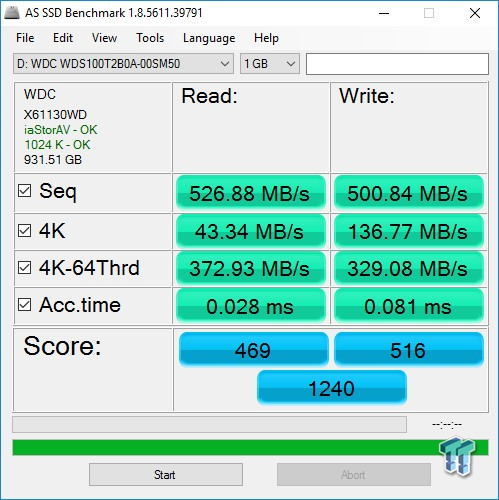
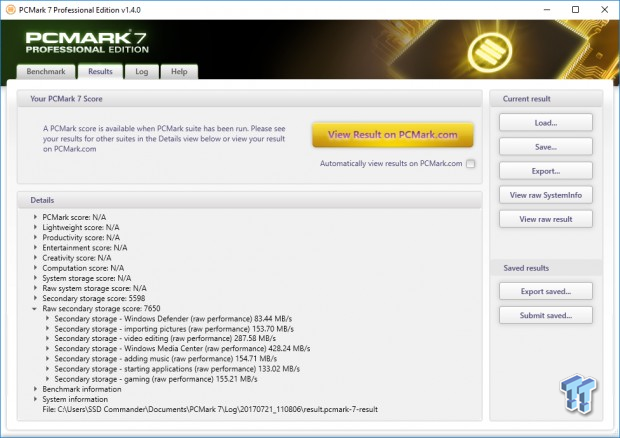
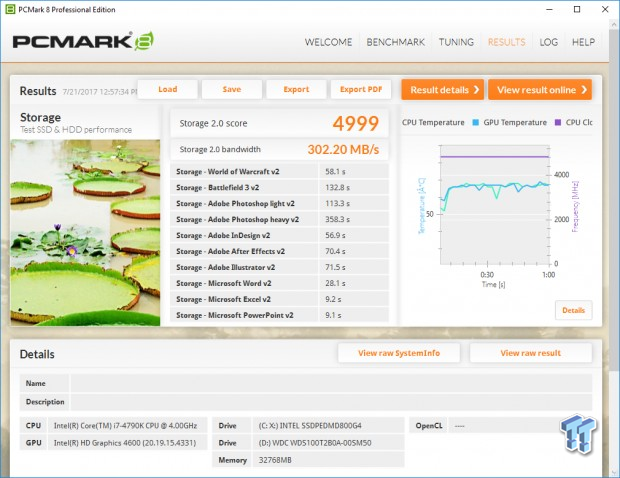
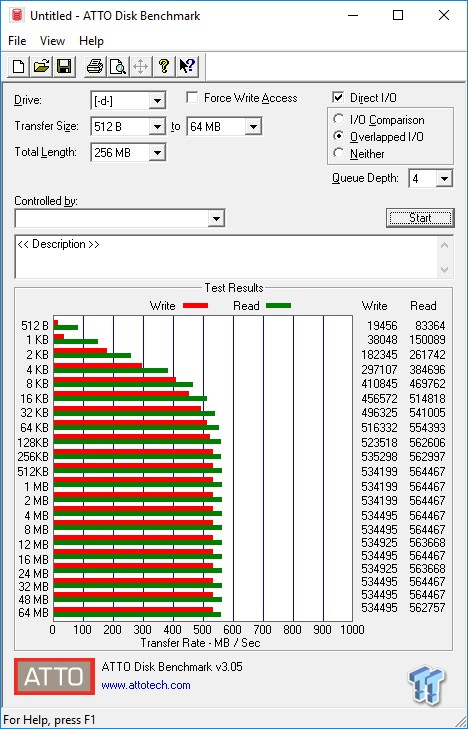
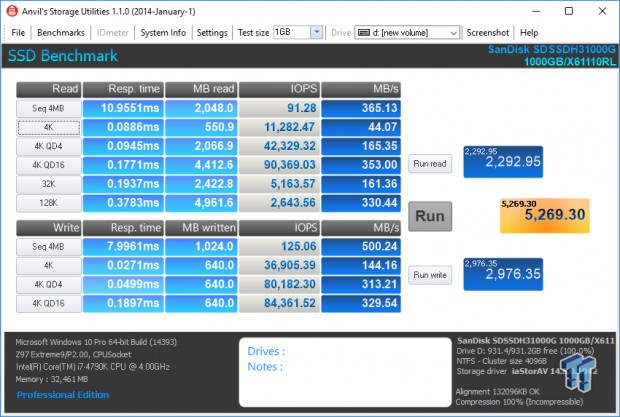
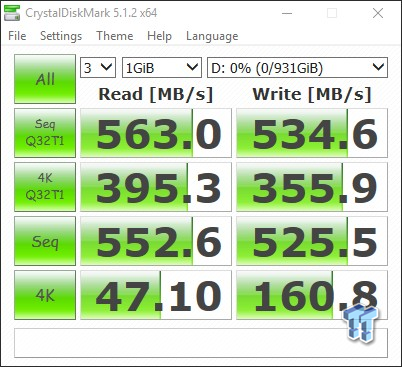
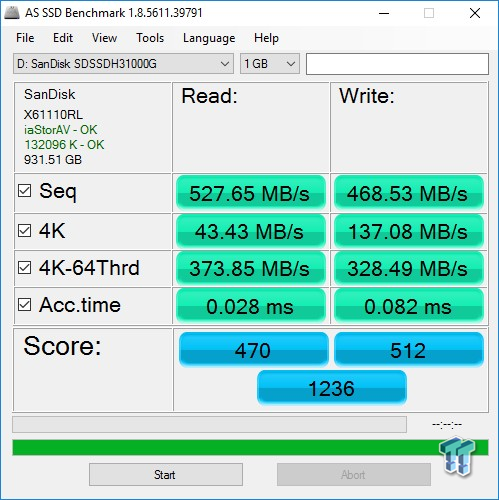
This testing is just to see what the drive is capable of in an FOB (Fresh Out of Box) state under optimal conditions. We are utilizing empty volumes of Windows 10 64-bit for this testing.
Windows 10 MOP
Western Digital Blue 3D 1TB SATA III SSD
Windows 10 MOP MOP
SanDisk Ultra 3D 1TB SATA III SSD
Final Thoughts
The Western Digital Blue 3D and the SanDisk Ultra 3D give us our second look at BiCS 3 flash. The first time we got our hands-on BiCS 3, it was with Toshiba's XG5. We have been impressed with BiCS 3 on both occasions. BiCS 3, as far as we know, will be only of the TLC variety. That's fine by us because we are seeing MLC-like performance coming from much more affordable TLC flash. With 64-Layer BiCS 3 flash now hitting the market, low-cost, high capacity SSDs will become more prevalent.
We are very pleased with the sustained write performance we got from both test subjects. Unlike planar-based TLC SSDs, the Blue 3D and the Ultra 3D can sustain write transfers in the 500MB/s range no matter how large the file size may be. Additionally, both SSDs deliver excellent low queue depth random read performance. Great low QD random read performance translates into excellent moderate workload performance, as demonstrated by our PCMark testing.
For two years now, we've been hoping for a TLC based SSD that could challenge the 850 EVO for supremacy. In terms of sheer performance, the Blue 3D and Ultra 3D come very close, but the 850 EVO is still the faster SSD. However, when performance between competitors is this close, we need to step back and look at the overall value when recommending one over the other. As it stands at this moment, we would have to go with the 1TB Ultra 3D or the 1TB Blue 3D over the 1TB 850 EVO, because they are both priced significantly lower. As we see it, less money for virtually the same user experience wins out.
User Experience: As you might imagine, any drive that delivers performance that rivals the 850 EVO is going to deliver a stellar user experience. Whether it be booting, transferring large files, or running moderate consumer workloads, the Western Digital Blue 3D and the SanDisk Ultra 3D both deliver a true tier-one SSD experience for less money than the competition. The Western Digital Blue 3D and the SanDisk Ultra 3D are both TweakTown recommended.
Pros:
- Overall Performance
- Endurance
- Low QD Random Read Performance
Cons:
- Heavy Workload Performance

| Performance | 95% |
| Quality | 98% |
| Features | 95% |
| Value | 99% |
| Overall | 97% |
The Bottom Line: Both the Western Digital Blue 3D and SanDisk Ultra 3D deliver a true Tier-1 SSD experience for less money than the competition.
PRICING: You can find products similar to this one for sale below.
 United
States: Find other tech and computer products like this
over at Amazon.com
 United
Kingdom: Find other tech and computer products like this
over at Amazon.co.uk
 Australia:
Find other tech and computer products like this over at Amazon.com.au
 Canada:
Find other tech and computer products like this over at Amazon.ca
 Deutschland:
Finde andere Technik- und Computerprodukte wie dieses auf Amazon.de
What's in Jon's PC?
- CPU: AMD Ryzen 7800X 3D
- MOTHERBOARD: GIGABYTE AORUS Master X670E
- RAM: Kingston Fury Renegade 7200MHz 32GB
- GPU: ZOTAC AMP Extreme GeForce RTX 4090
- SSD: Crucial T700 2TB Gen5
- OS: Windows 11 Pro
- COOLER: Lian Li Galahad 360 AIO
- CASE: Lian Li Lancool III
- KEYBOARD: Corsair K65 RGB Mini
- MOUSE: SteelSeries AEROX 5 Wireless
- MONITOR: ASUS ROG Strix PG27AQN 360Hz 1440p ULMB2
Similar Content
Related Tags

