

Our Verdict
Introduction, Specifications, Pricing & Availability
OCZ is tapping Toshiba's Q300 Pro as a replacement for their aging VT180 mainstream line of SATA III SSD's. OCZ is taking an already proven beast of an SSD, Toshiba's Q300 Pro, and outfitted the drive with newer firmware, 15nm planar MLC Toshiba NAND flash, and a new OCZ label. OCZ has dubbed this refresh of the Q300 Pro the OCZ VX500 Series.
The new VX500 SSD series will replace OCZ's Vector 180 SSD series as the mainstream offering in Toshiba/OCZ's new SSD lineup. In OCZ's new lineup, the VX500 falls between the value-driven Trion 150 and the extreme-performance RD400 NVMe SSD. The VX500 offers many of the same features that made the VT180 (Vector 180) a favorite among enthusiasts; including Acronis cloning software, OCZ's SSD Utility, and OCZ's Advanced Warranty Program.
OCZ envisions their VX500 series SSDs as a perfect drop-in replacement for enthusiasts that are not quite ready for NVMe. The VX500 series is targeted at those that are looking for a little more than TLC-based SSDs have to offer, such as better sustained performance as well as significantly better endurance that is inherent to MLC flash-based SSDs.
The VX500 series is, for the most part, a line of DRAM-less SSDs with the exception of the 1TB model. The 1TB model has 256MB of onboard DRAM cache. The 128GB-512GB models are DRAM-less designs. Typically, DRAM-less SSDs do not perform as well as SSDs that have onboard DRAM caching. We have to look no further than Sandisk's SSD Plus to see the adverse impact on performance that typically goes hand-in-hand with DRAM-less SSDs, especially when the user is running sustained workloads.
However, OCZ's VX500 is not your typical DRAM-less SSD. In fact, despite its low 4K QD1 read performance, the 256GB VX500 actually outperforms Samsung's 850 Pro 512GB SSD in our PCMark8 extended testing. The 1TB model is the real gem, though. Because the 1TB model does have a small DRAM cache, it delivers heavy workload performance that is a cut above the current competition. If we had our way, all VX500 capacity points would have a DRAM-cache in a 1MB to 1GB DRAM to NAND flash ratio. We believe if Toshiba/OCZ had done this, or will do this in the future, Samsung's 850 Pro/EVO could potentially be unseated as the SATA performance champions.
Performance aside, DRAM-less designs do present a few inherent advantages to the end-user. First, production costs are lower, power consumption is greatly reduced, the physical footprint is smaller, and there is one less potential point of failure. SSDs are trending toward DRAM-less designs primarily to reduce production costs which will trickle down to the end-user as lower retail pricing. Lower pricing serves to increase mainstream SSD adoption, the result of which is greater revenue for SSD vendors.
Let's dive in and see what OCZ's mainstream VX500 series SSDs have to offer.
Our Latest SSD Review Coverage
- Micron 3610 2TB SSD Review - DRAMless QLC at 11,000 MB/s
- SK hynix Platinum P51 2TB SSD Review - A Powerful Gen5 Alternative
- Biwin Black Opal X570 Pro 8TB SSD Review - Massive Capacity with Elite Performance
- Samsung 9100 PRO 1TB SSD Review - Lab Champion at 1TB
- Biwin Black Opal X570 Pro 2TB SSD Review - Powerful and efficient single-sided goodness
Specifications
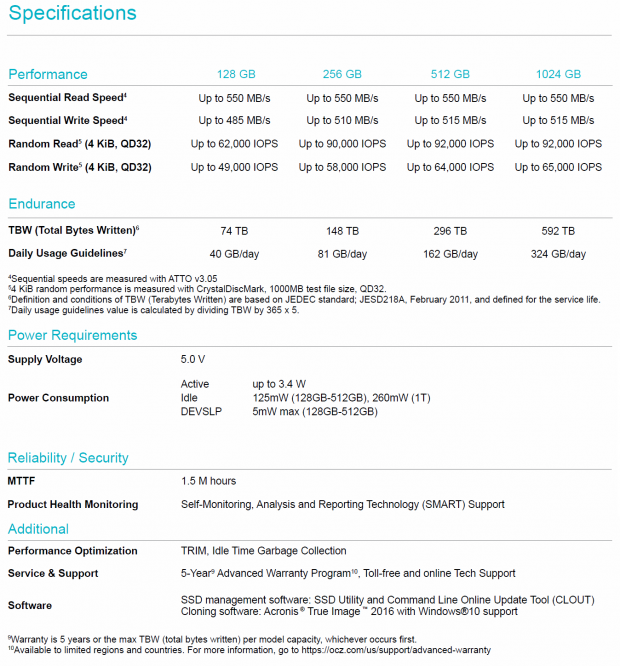
For specifications of the 128GB-512GB models, please refer to the above factory spec sheet. We will highlight the main features and performance specifications for the 1TB OCZ VX500 below:
- Sequential Read: up to 550 MB/s
- Sequential Write: up to 515 MB/s
- Max 4K Random Read Speed: up to 92,000 IOPS
- Max 4K Random Write Speed: up to 65,000 IOPS
- Endurance: 592TB or up to 324GB/day for 5-years
- MTTF: 1.5 Million Hours
- Warranty: 5-Years Advanced Warranty Program
- Active Power Consumption: 3.4W Max.
- Idle Power Consumption: 260mW
- SMART
- TRIM
- Idle Time Garbage Collection
- Software: SSD Utility, CLOUT, Acronis 2016
OCZ VX500 MSRP: 128GB = $63.99, 256GB = $92.79, 512GB = $152.52, 1TB = $337.06
Note: This is target launch pricing that's subject to change depending on the market. Pricing is expected to drop shortly after launch.
Drive Details
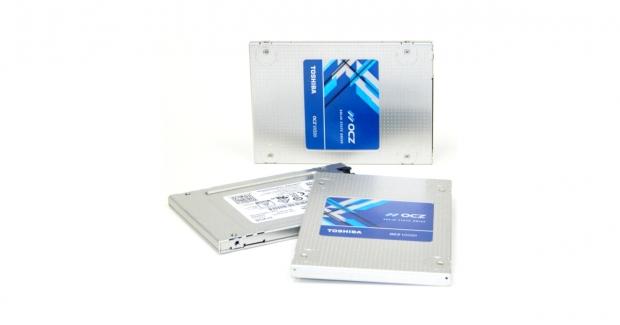
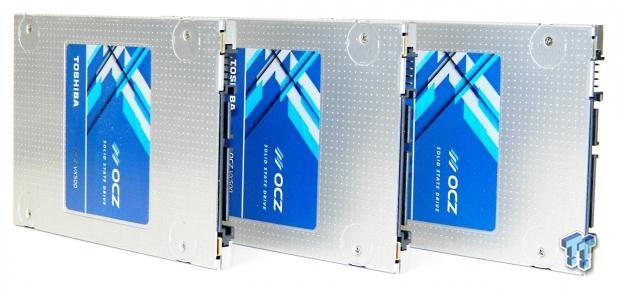
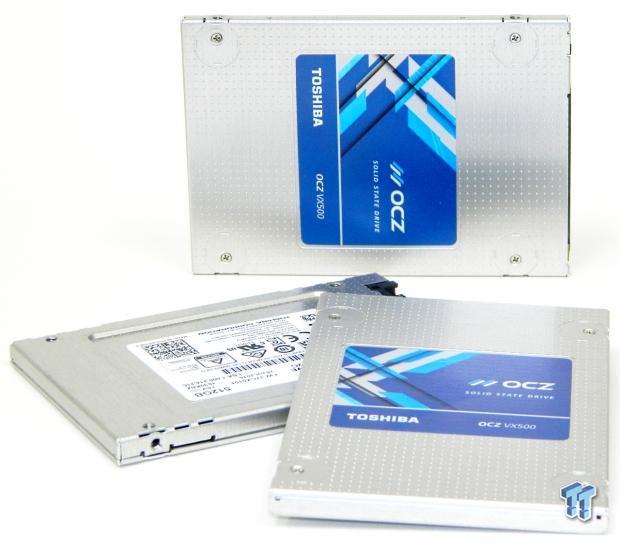
OCZ VX500 256GB, 512GB & 1TB SATA III SSDs
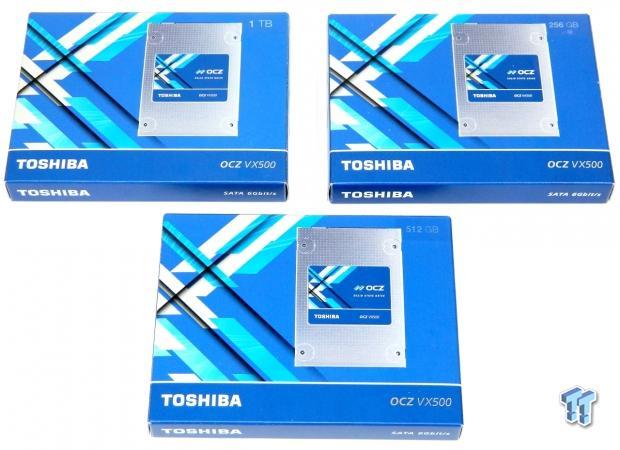
The retail packaging features an image of the enclosed SSD on the front of the box. The front of the attractive packaging advertises the enclosed drive's capacity.
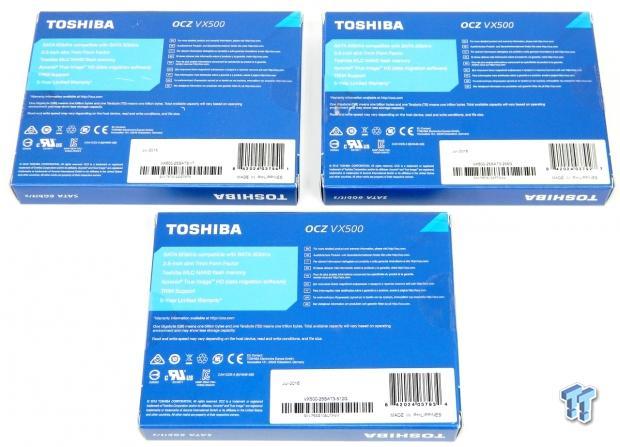
The rear of the packaging advertises the drive's five-year warranty, form factor, interface, and included software.
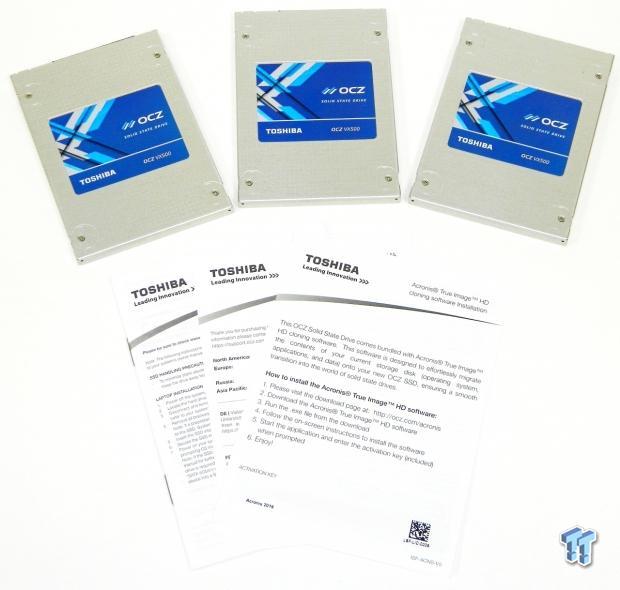
Inside the packaging is the drive itself, printed installer guide, and Acronis key.
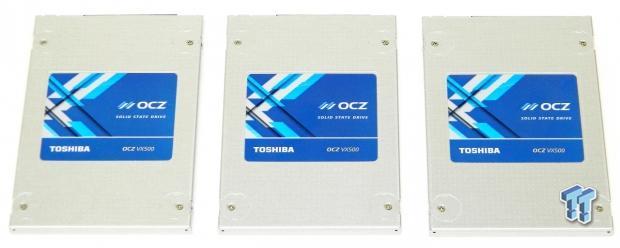
The top of the drive's natural colored aluminum enclosure features an OCZ factory label. The top half of the enclosure attached to the lower half with four small screws.
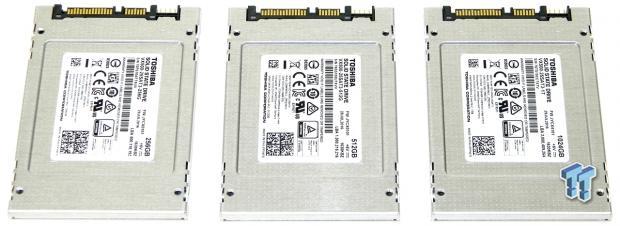
The bottom of the enclosure features a manufacturer's label listing the particulars of the drive.
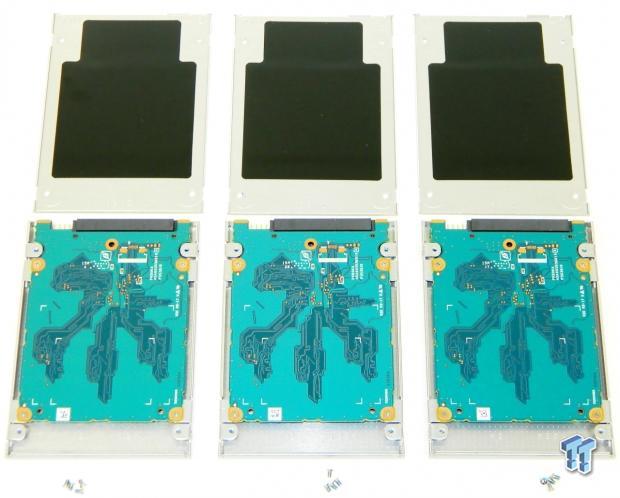
The underside of the top of the enclosure has a Mylar type barrier which keeps the PCB from directly contacting the top of the aluminum enclosure. The PCB attaches to the bottom half of the enclosure with four small screws.
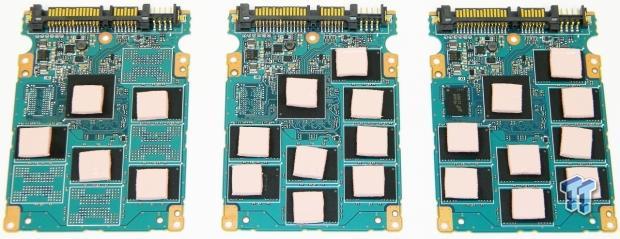
Going left to right, we have the 256GB, 512GB, and 1TB boards. The NAND packages and controller have thermal pads attached to them. The 256GB and 512GB drives are DRAM-less, the 1TB is equipped with a 256MB DDR3 1600MHz Micron DRAM package.
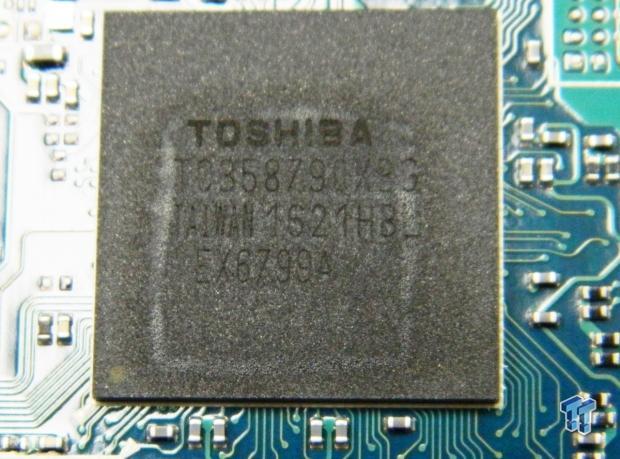
The drive's Toshiba SSD controller is very hard to photograph. This is the best we could do.
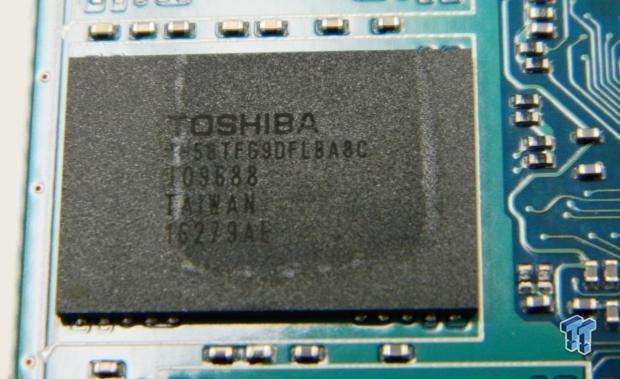
One of the 15nm Toshiba flash packages that populate the boards.
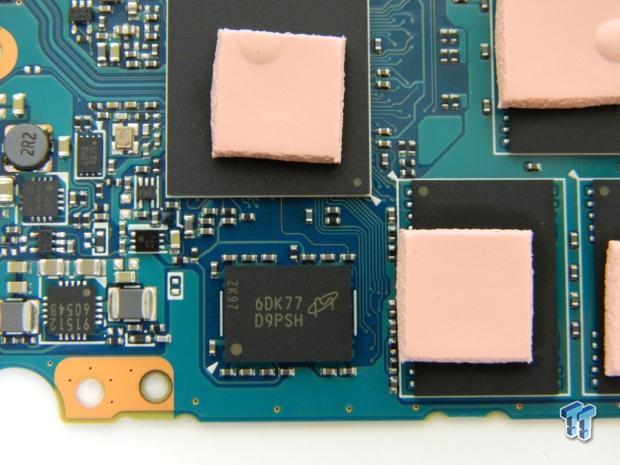
A detailed view of the 256MB DRAM cache package on the 1TB model.
Test System Setup and Properties
Jon's Consumer SSD Review Test System Specifications
- Motherboard: ASRock Extreme9 Z97 - Buy from Amazon
- CPU: Intel Core i7 4790K @ 4.8GHz - Buy from Amazon / Read our review
- Cooler: Swiftech H2O-320 Edge - Buy from Amazon / Read our review
- Memory: Corsair Dominator DDR3 32GB 2400MHz - Buy from Amazon
- Video Card: Onboard Video
- Case: IN WIN X-Frame - Buy from Amazon / Read our review
- Power Supply: Seasonic Platinum 1000 Watt Modular - Buy from Amazon / Read our review
- OS: Microsoft Windows 10 Professional 64-bit - Buy from Amazon
- Drivers: Intel RAID option ROM version 13.0.0.2075 and Intel RST driver version 13.6.0.1002
We would like to thank ASRock, Crucial, Intel, Corsair, RamCity, IN WIN, and Seasonic for making our test system possible.
Drive Properties
OCZ VX500 256GB OS Disk 75% Full

OCZ VX500 512GB OS Disk 75% Full

OCZ VX500 1TB OS Disk 75% Full
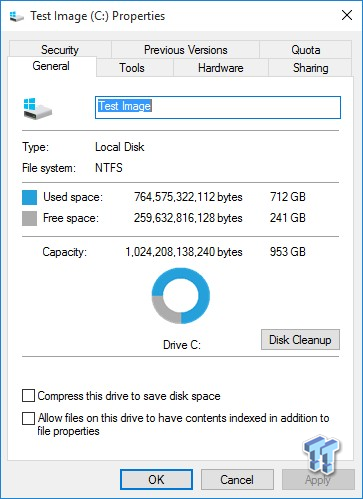
The majority of our testing is performed with our test drive as our boot volume. Our boot volume is 75% full for all OS Disk "C" drive testing to replicate a typical consumer OS volume implementation. We feel that most of you will be utilizing your SSDs for your boot volume and that presenting you with results from an OS volume is more relevant than presenting you with empty secondary volume results.
System settings: Cstates and Speed stepping are both disabled in our systems BIOS. Windows High-Performance power plan is enabled. Windows write caching is enabled, and Windows buffer flushing is disabled. We are utilizing Windows 10 Pro 64-bit OS for all of our testing except for our MOP (Maxed-Out Performance) benchmarks where we switch to Windows Server 2008 R2 64-bit. We are going to start adding empty volume Windows 10 benchmark screen shots to our MOP page as well.
All three capacities will be charted. We will present benchmark screenshots of the 1TB VX500.
Synthetic Benchmarks – ATTO & Anvil's
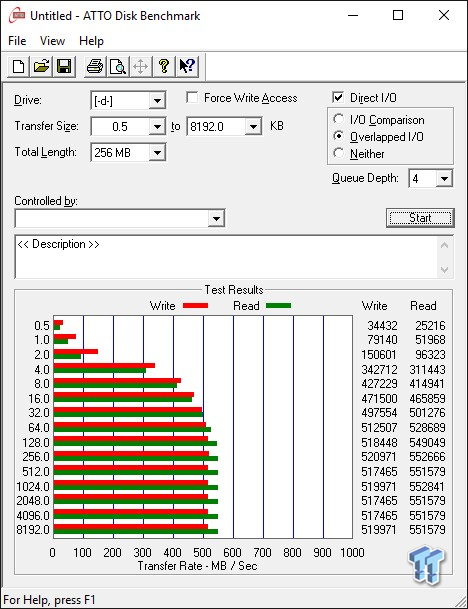
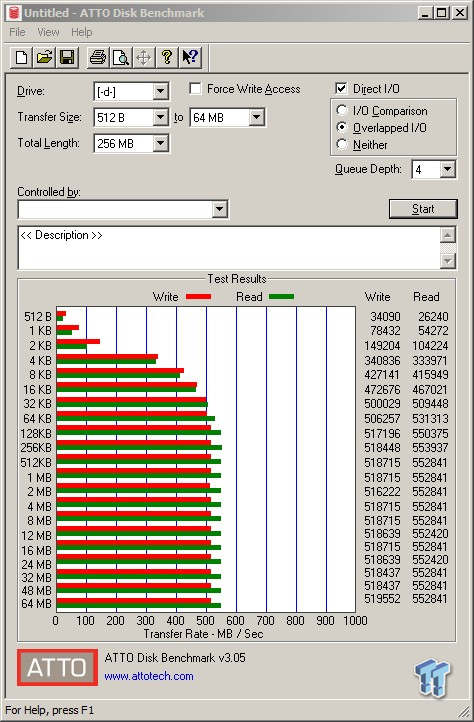
ATTO
Version and / or Patch Used: 2.47
ATTO is a timeless benchmark used to provide manufacturers with data used for marketing storage products.
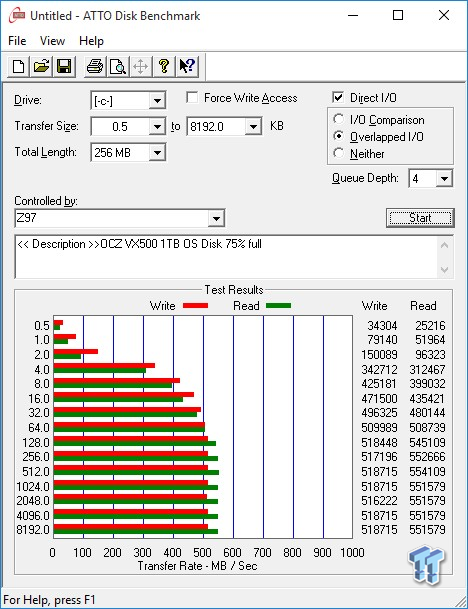
Compressible sequential read/write transfers max out at 554/518 MB/s. Keep in mind this is our OS volume, and it is filled to 75% of its total capacity. Write performance ramps up quickly. Maximum sequential read performance is achieved at a 512KB transfer size, maximum sequential write performance at 128KB transfers.
Sequential Write
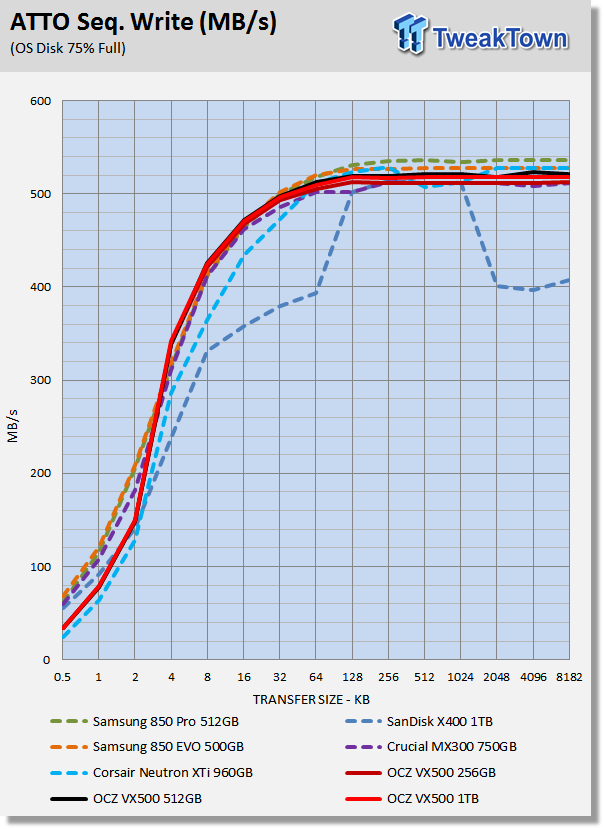
All three capacity points follow a similar performance curve. All three lead the field at 4KB transfers.
Sequential Read
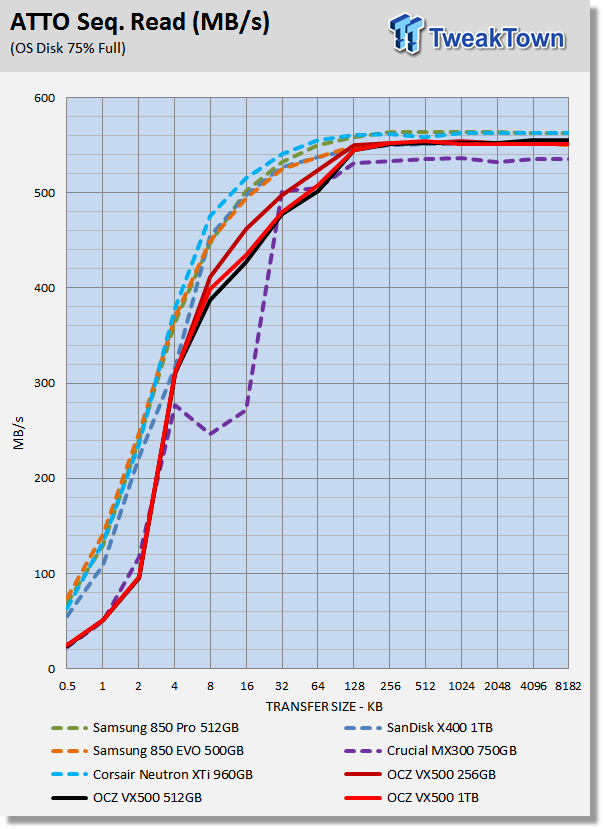
With the exception of Crucial's MX300, the rest of the drives in our test pool deliver better sequential read performance for the majority of the transfer sizes that ATTO tests.
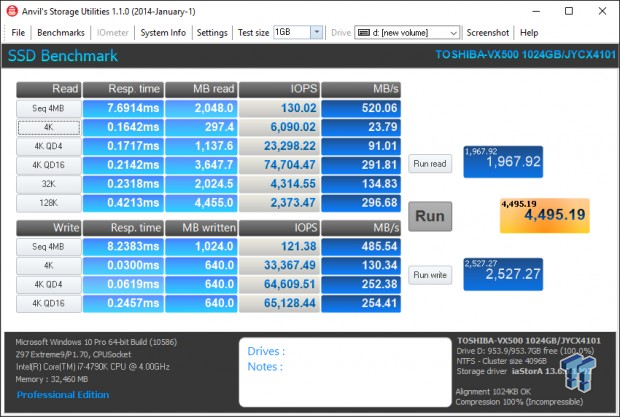
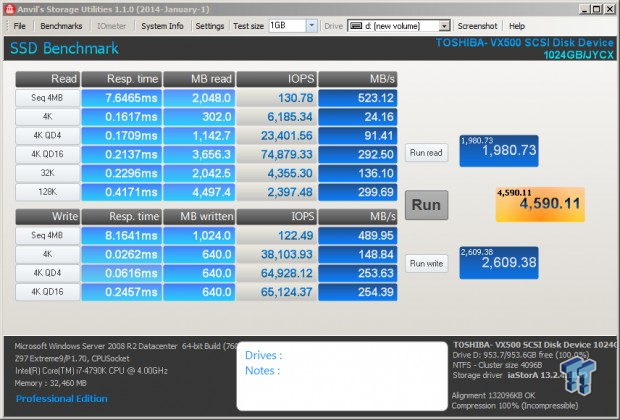
Anvil Storage Utilities
Version and / or Patch Used: 1.1.0
Anvil's Storage Utilities is a storage benchmark designed to measure the storage performance of SSDs. The Standard Storage Benchmark performs a series of tests; you can run a full test or just the read or write test, or you can run a single test, i.e. 4k QD16.

Scoring
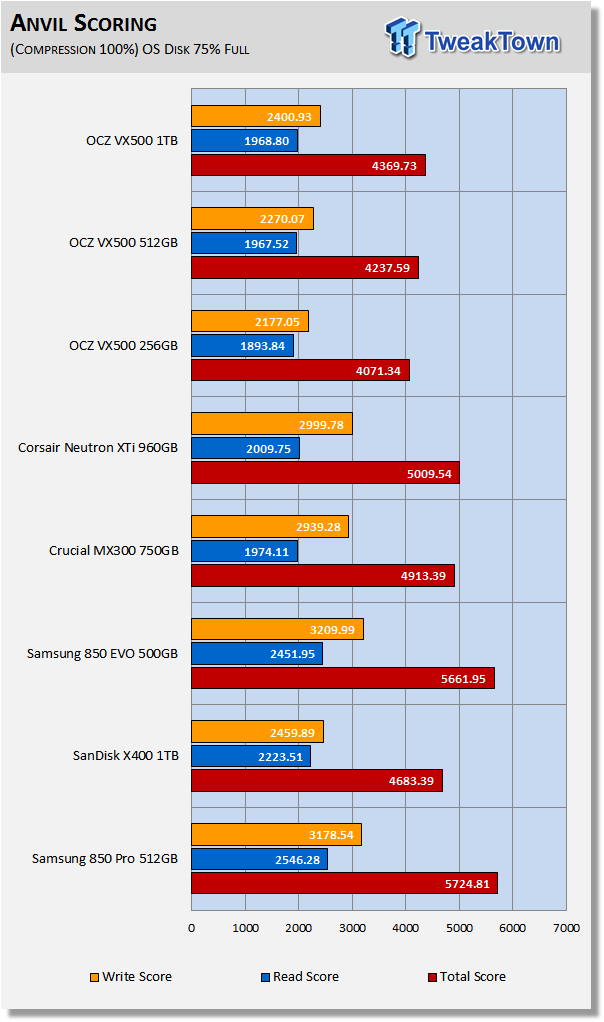
Anvil's scoring typically provides us with a good indication of a drive's overall performance. With OCZ's VX500, this does not hold true as you will see when we get to our moderate workload testing.
(Anvil) Read IOPS through Queue Depth Scale
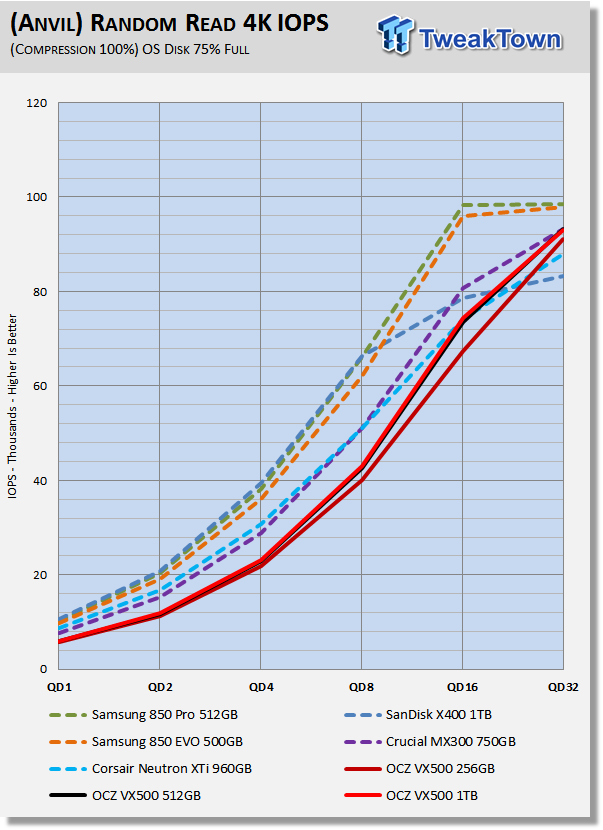
The VX500's lag behind the rest of the drives in our test pool until we hit QD32.
(Anvil) Write IOPS through Queue Scale
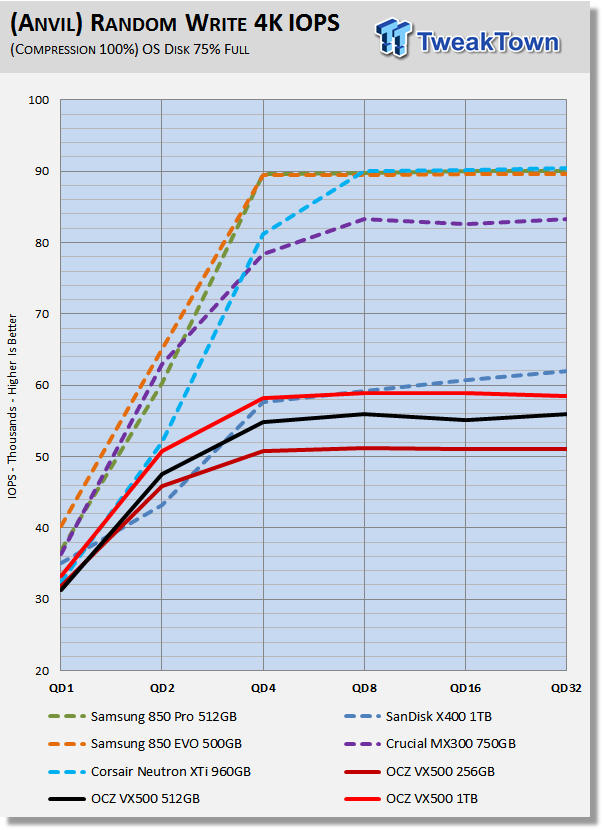
The lack of a DRAM cache or the implementation of a very small DRAM cache package takes its toll on the VX500's random write performance.
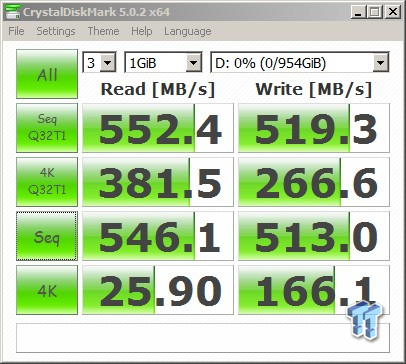
Synthetic Benchmarks – CDM & AS SSD
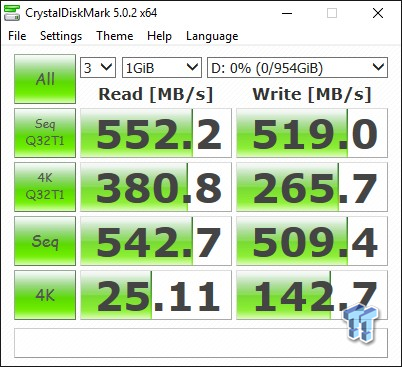
CrystalDiskMark
Version and / or Patch Used: 3.0 Technical Preview
CrystalDiskMark is disk benchmark software that allows us to benchmark 4k and 4k queue depths with accuracy. Note: Crystal Disk Mark 3.0 Technical Preview was used for these tests since it offers the ability to measure native command queuing at QD4.
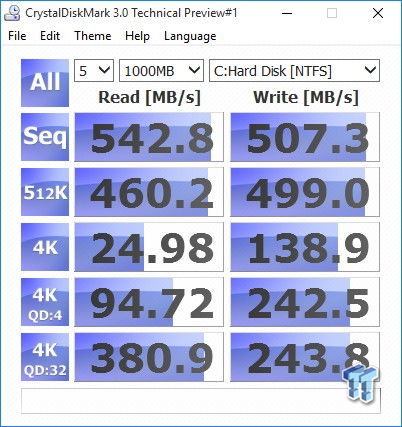
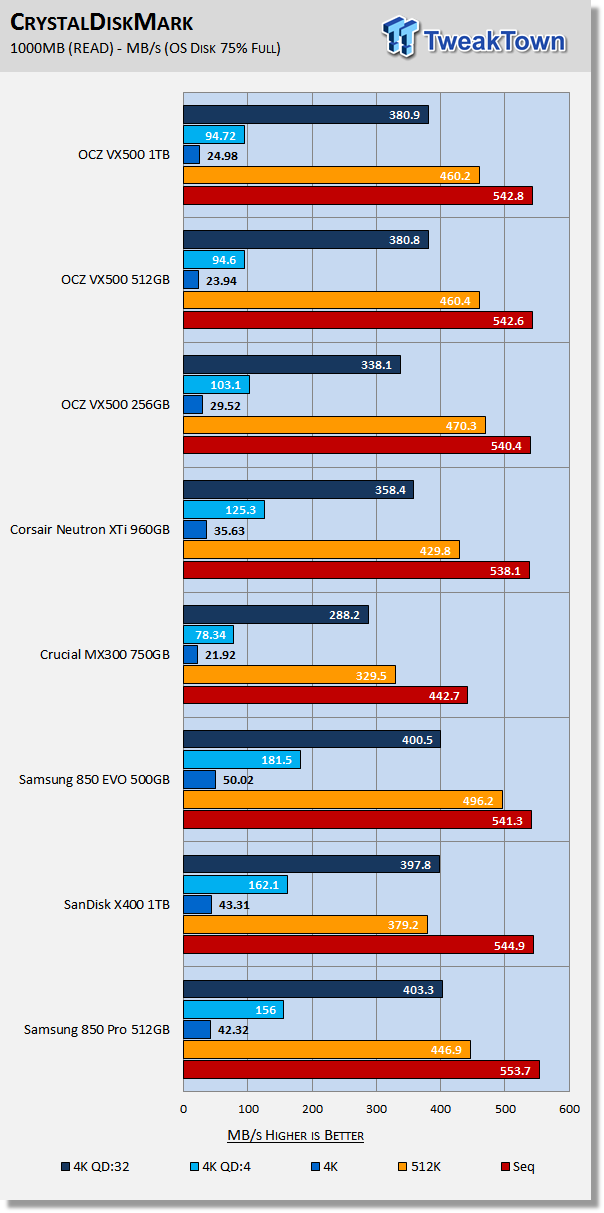
Like the Toshiba Q300 Pro, the OCZ VX500 is not a synthetic powerhouse, and we are fine with that because moderate workload performance is much more important to the average user. So how does an SSD with such low 4K QD1 read performance tear it up in our moderate workload performance testing? Simply because the VX500 excels with mixed random/sequential workloads.
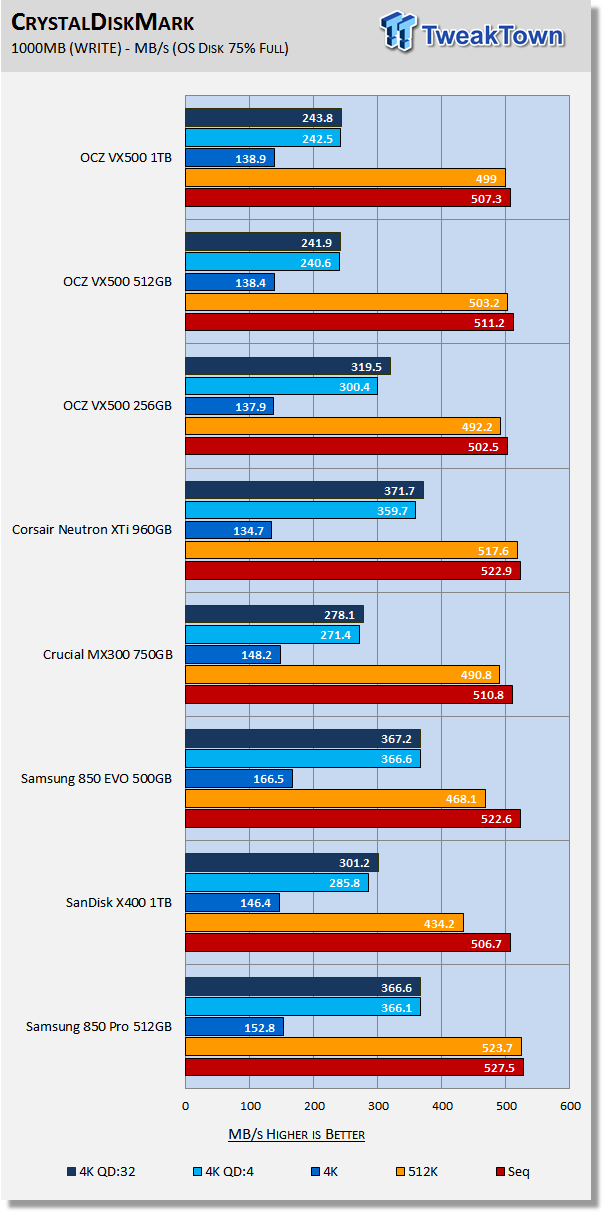
The lack of a DRAM cache manifests itself more on the 512GB VX500 because there is more data to keep track of. This is why the 256GB VX500 delivers far better random write performance. The small DRAM cache on the 1TB keeps random write performance in line with the 512GB model. Without a bit of DRAM onboard, the 1TB model would have even lower random write performance.
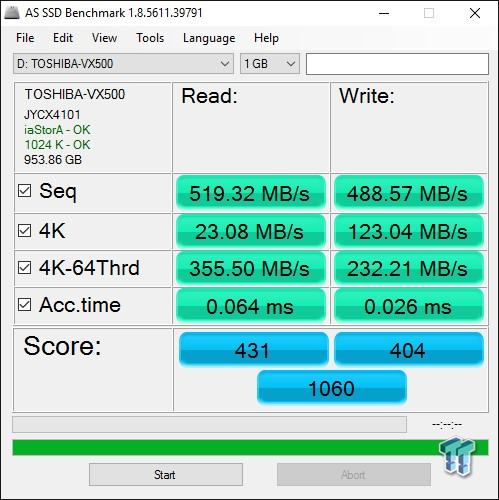
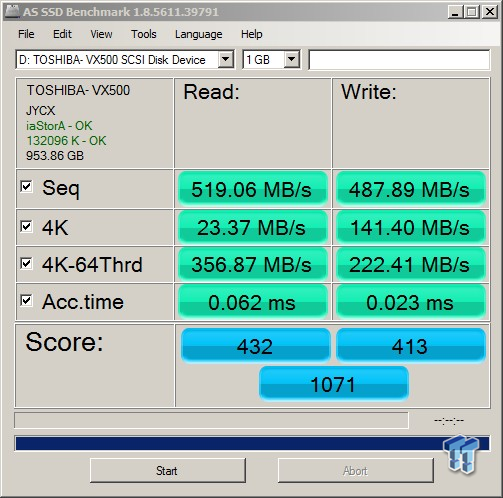
AS SSD
Version and / or Patch Used: 1.8.5611.39791
AS SSD determines the performance of SSDs. The tool contains four synthetic as well as three practice tests. The synthetic tests are to determine the sequential and random read and write performance of the SSD.
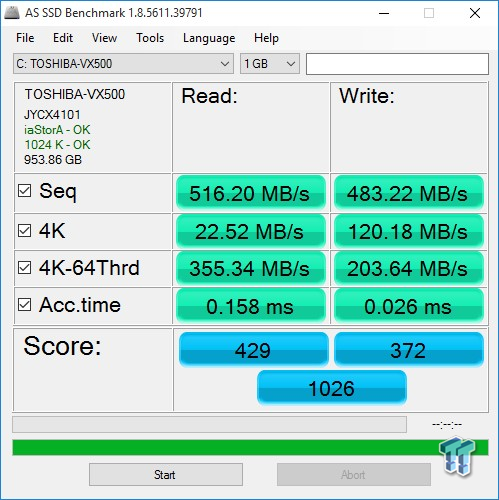
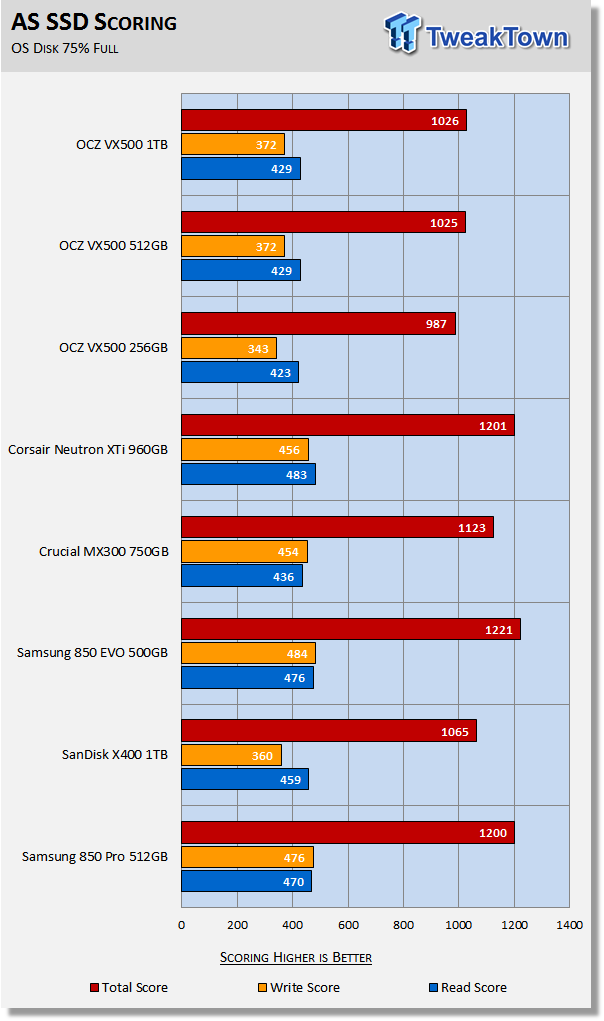
AS SSD is a demanding test. The lack of a DRAM cache again manifests itself with lower total scores than the rest of the drives in our test pool. No worries though because our moderate workload testing is coming up next.
Benchmarks (Trace, OS Volume) - Vantage, PCMark 7 & PCMark 8
Moderate Workload Model
We categorize these tests as indicative of a moderate workload environment.
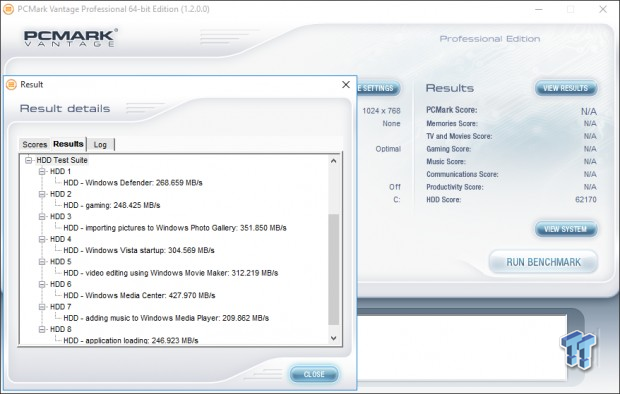
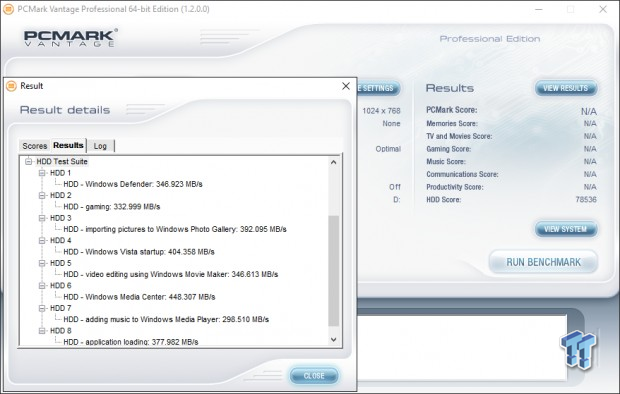
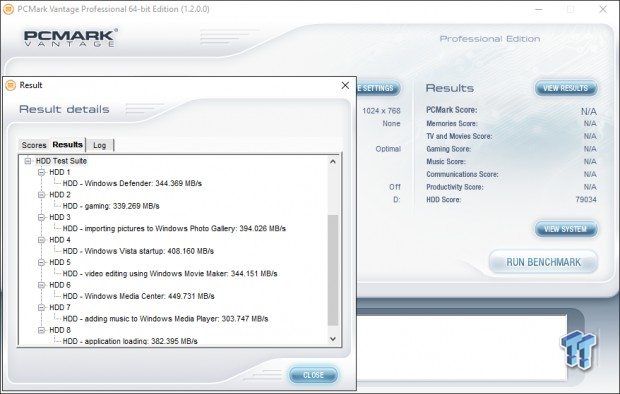
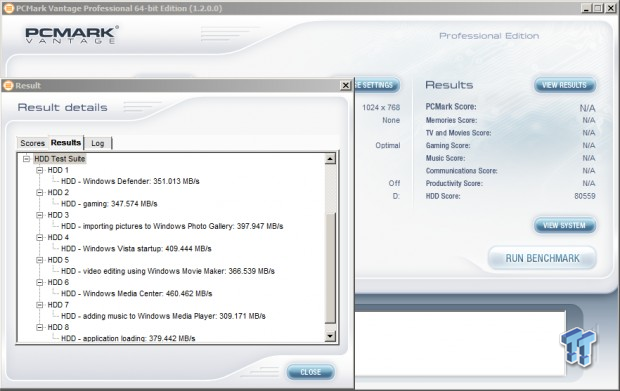
PCMark Vantage - Hard Disk Tests
Version and / or Patch Used: 1.2.0.0
The reason we like PCMark Vantage is because the recorded traces are played back without system stops. What we see is the raw performance of the drive. This allows us to see a marked difference between scoring that other trace-based benchmarks do not exhibit. An example of a marked difference in scoring on the same drive would be empty vs. filled vs. steady state.
We run Vantage three ways. The first run is with the OS drive 75% full to simulate a lightly used OS volume filled with data to an amount we feel is common for most users. The second run is with the OS volume written into a "Steady State" utilizing SNIA's guidelines. Steady state testing simulates a drive's performance similar to that of a drive that been subjected to consumer workloads for extensive amounts of time. The third run is a Vantage HDD test with the test drive attached as an empty, lightly used secondary device.
OS Volume 75% Full - Lightly Used
OS Volume 75% Full - Steady State

Secondary Volume Empty - FOB
There's a big difference between an empty drive, one that's 75% full/used, and one that's in a steady state.
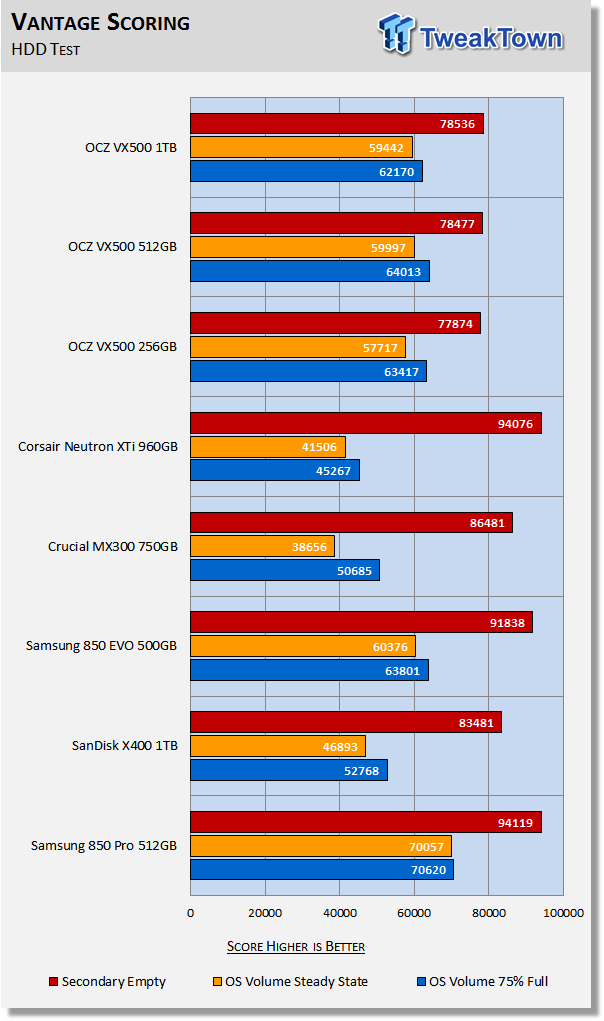
The important scores to pay attention to are "OS Volume Steady State" and "OS Volume 75% full." These two categories are most important because they are indicative of typical of consumer user states. When a drive is in a steady state, it means garbage collection is running at the same time it's reading/writing. This is exactly why we focus on steady state performance.
The VX500's all run about even with Samsung's mighty 850 EVO when data is on the drive and also when operating in a steady-state. Only Samsung's 850 Pro can best the VX500's. We consider moderate workload performance to be the most important indicator of a consumer SSDs overall performance.
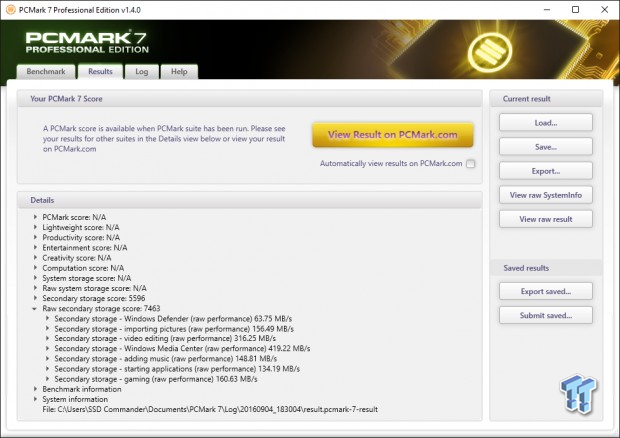
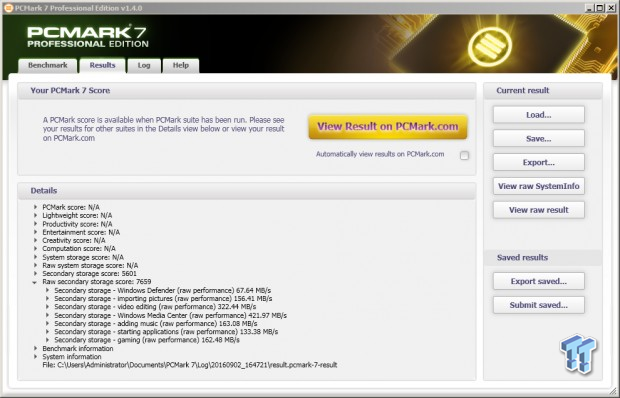
PCMark 7 - System Storage
Version and / or Patch Used: 1.4.0
We will look to Raw System Storage scoring for evaluation because it's done without system stops and, therefore, allows us to see significant scoring differences between drives.
OS Volume 75% Full - Lightly Used
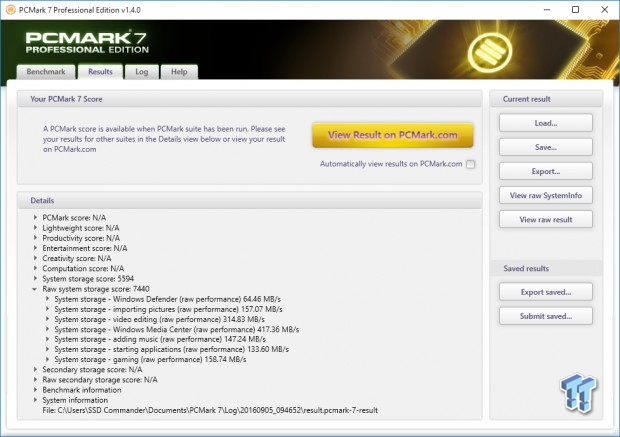
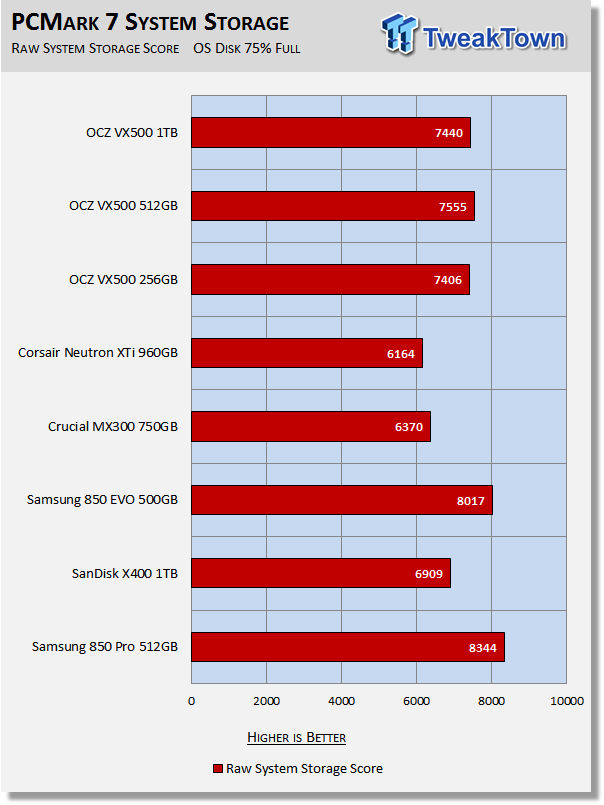
Samsung's 850 EVO and Pro deliver the best performance in this test. Other than that, the VX500's are way out in front of the rest of the drives in our test pool.
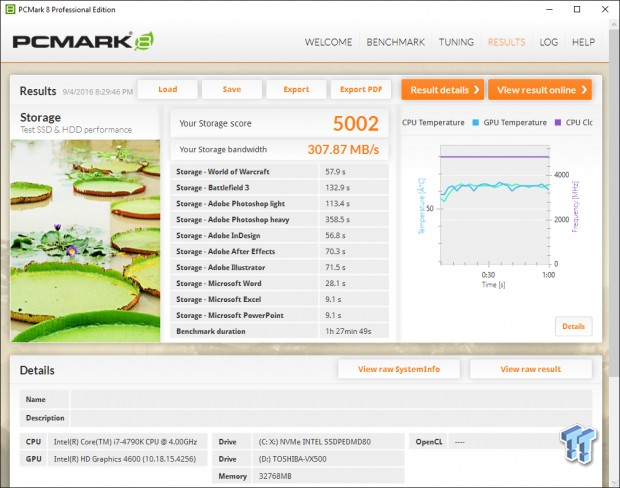
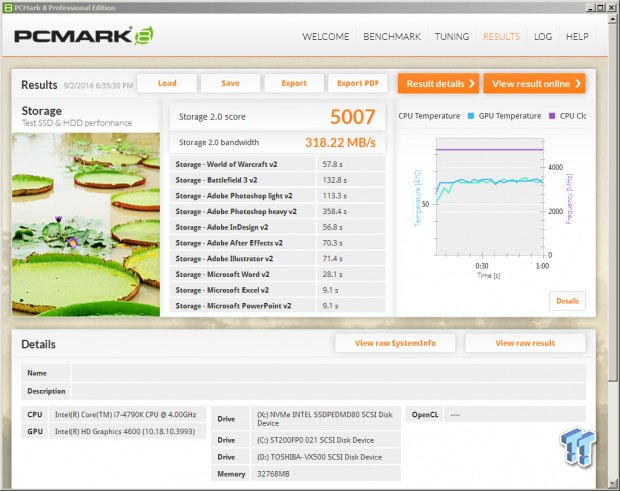
PCMark 8 - Storage Bandwidth
Version and / or Patch Used: 2.4.304
We use PCMark 8 Storage benchmark to test the performance of SSDs, HDDs, and hybrid drives with traces recorded from Adobe Creative Suite, Microsoft Office, and a selection of popular games. You can test the system drive or any other recognized storage device, including local external drives. Unlike synthetic storage tests, the PCMark 8 Storage benchmark highlights real-world performance differences between storage devices.
OS Volume 75% Full - Lightly Used
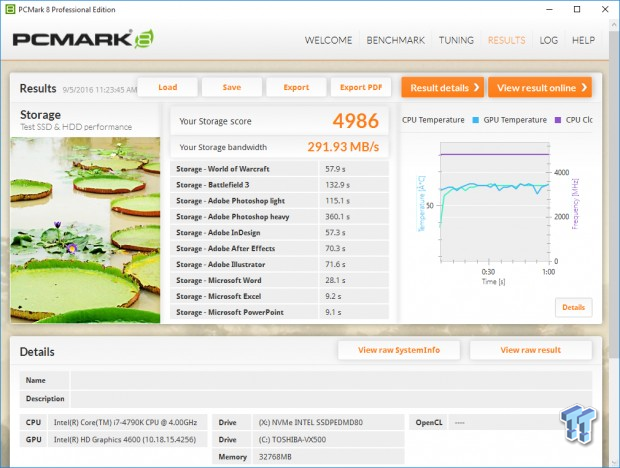
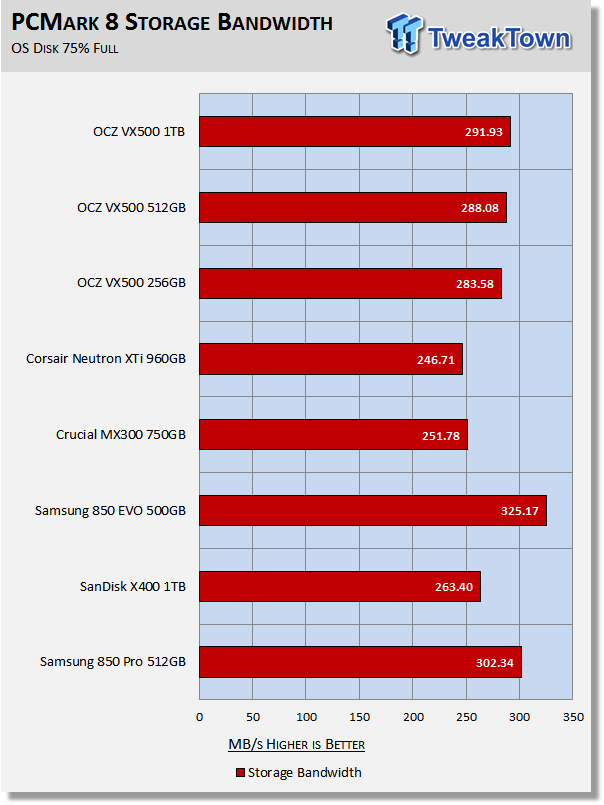
PCMark 8 is the most intensive moderate workload simulation we run. With respect to moderate workloads, this test is what we consider the best indicator of a drive's performance. Samsung's 850 EVO remains the champion of this moderate workload test. The 850 Pro comes in second, followed closely by the VX500 1TB. The other drives in our test pool do not handle moderate workloads nearly as well.
Benchmarks (Secondary) – IOPS, Response & Transfers
Iometer – Maximum IOPS
Version and / or Patch Used: Iometer 2014
We use Iometer to measure high queue depth performance. (No Partition)
Max IOPS Read
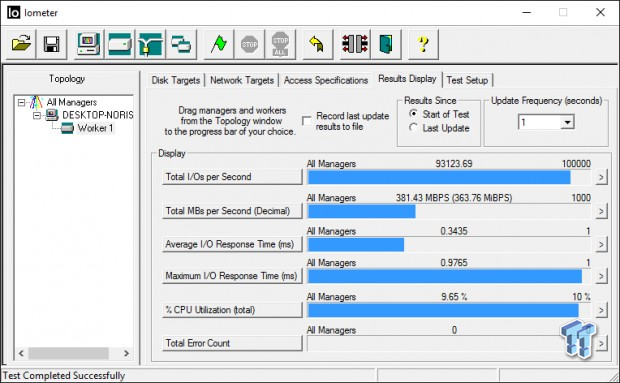
Max IOPS Write
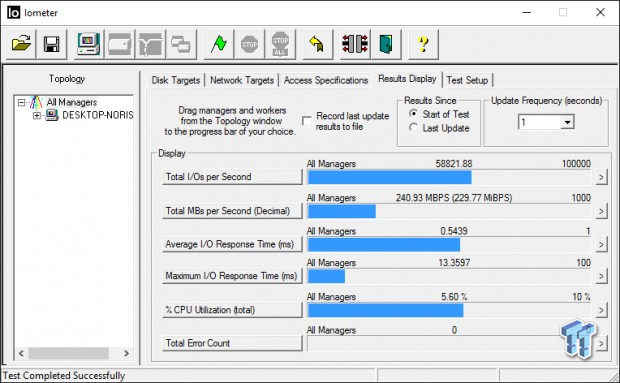
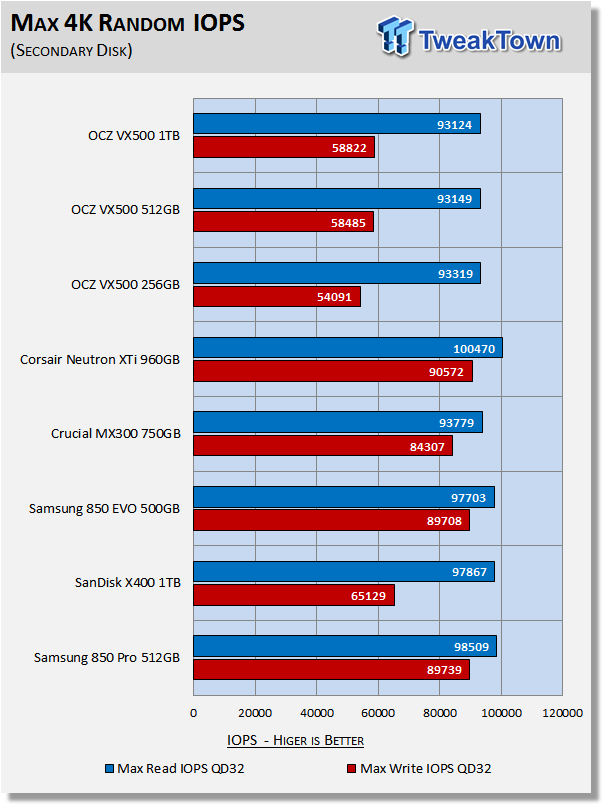
The VX500's take a step back in terms of max IOPS. With our configuration, we are able to hit factory max read IOPS specifications. We are not able to hit factory specs for write IOPS.
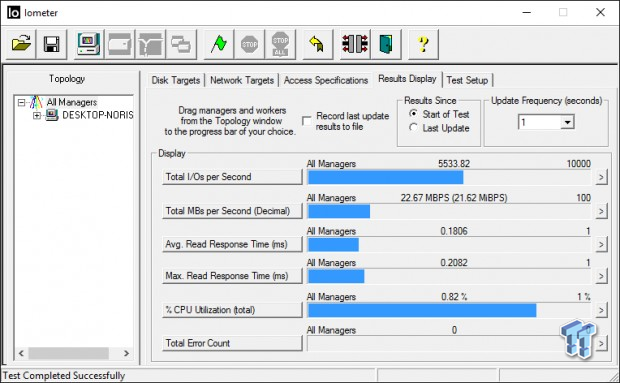
Iometer – Disk Response
Version and / or Patch Used: Iometer 2014
We use Iometer to measure disk response times. Disk response times are measured at an industry accepted standard of 4K QD1 for both write and read. Each test runs twice for 30 seconds consecutively, with a 5-second ramp-up before each test. We partition the drive/array as a secondary device for this testing.
Avg. Write Response
Avg. Read Response
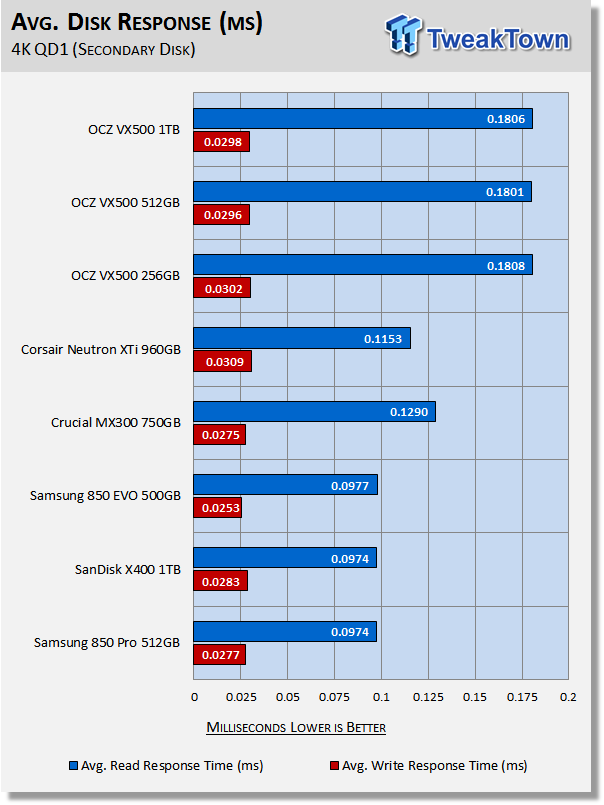
Low read response was predictable, due to the low 4D QD1 read performance of the VX500. Write response is in line with the other SSDs in our test pool.
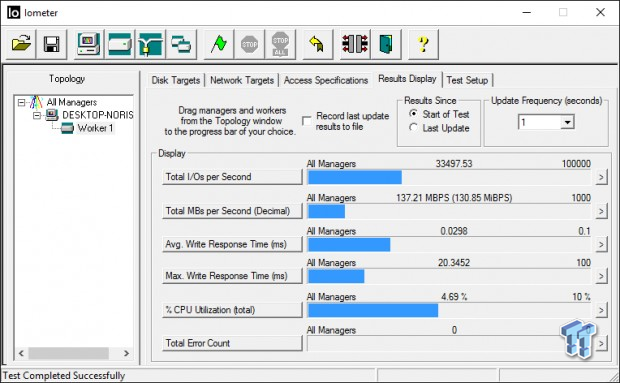
DiskBench - Directory Copy
Version and / or Patch Used: 2.6.2.0
We use DiskBench to time a 28.6GB block (9,882 files in 1,247 folders) composed primarily of incompressible sequential and random data as it's transferred from our DC P3700 PCIe NVME SSD to our test drive. We then read from a 6GB zip file that's part of our 28.6GB data block to determine the test drive's read transfer rate. Our system is restarted prior to the read test to clear any cached data, ensuring an accurate test result.
Write Transfer Rate
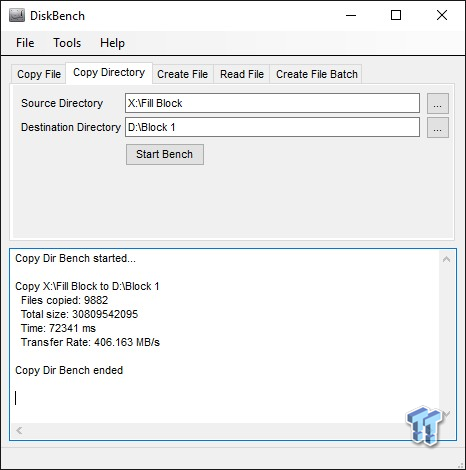
Read Transfer Rate
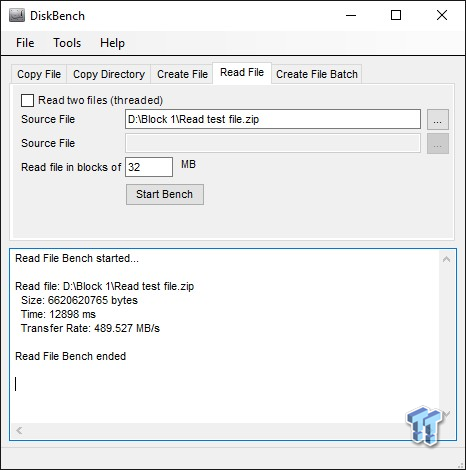
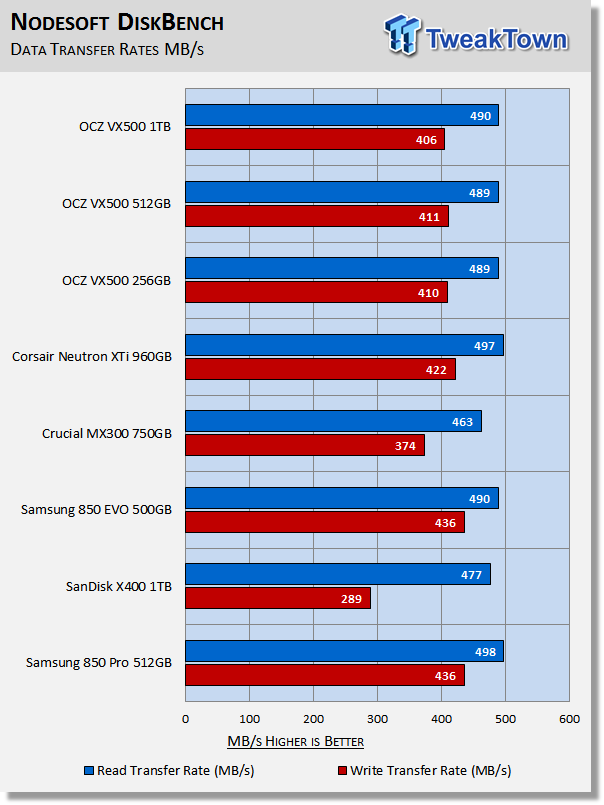
The VX500's delivered better write transfer rates than Crucial's MX300, and Sandisk's X400; as expected. All three of the VX500's read transfer rates are in line with Samsung's 850 EVO. The 850 Pro delivers the best read performance of the bunch.
Benchmarks (Secondary) – PCMark 8 Extended
Futuremark PCMark 8 Extended
Heavy Workload Model
PCMark 8's consistency test simulates an extended duration heavy workload environment. PCMark 8 has built-in, command line executed storage testing. The PCMark 8 Consistency test measures the performance consistency and the degradation tendency of a storage system.
The Storage test workloads are repeated. Between each repetition, the storage system is bombarded with a usage that causes degraded drive performance. In the first part of the test, the cycle continues until a steady degraded level of performance has been reached. (Steady State)
In the second part, the recovery of the system is tested by allowing the system to idle and measuring the performance after 5-minute long intervals. (Internal drive maintenance: Garbage Collection (GC)) The test reports the performance level at the start, the degraded steady-state, and the recovered state, as well as the number of iterations required to reach the degraded state and the recovered state.
We feel Futuremark's Consistency Test is the best test ever devised to show the true performance of solid state storage in an extended duration heavy workload environment. This test takes on average 13 to 17 hours to complete and writes somewhere between 450GB and 14,000GB of test data depending on the drive. If you want to know what an SSDs steady state performance is going to look like during a heavy workload, this test will show you.
Here's a breakdown of Futuremark's Consistency Test:
Precondition phase:
1. Write to the drive sequentially through up to the reported capacity with random data.
2. Write the drive through a second time (to take care of overprovisioning).
Degradation phase:
1. Run writes of random size between 8*512 and 2048*512 bytes on random offsets for 10 minutes.
2. Run performance test (one pass only).
3. Repeat 1 and 2 for 8 times, and on each pass increase the duration of random writes by 5 minutes.
Steady state phase:
1. Run writes of random size between 8*512 and 2048*512 bytes on random offsets for 50 minutes.
2. Run performance test (one pass only).
3. Repeat 1 and 2 for 5 times.
Recovery phase:
1. Idle for 5 minutes.
2. Run performance test (one pass only).
3. Repeat 1 and 2 for 5 times.
Storage Bandwidth
PCMark 8's Consistency test provides a ton of data output that we use to judge a drive's performance.
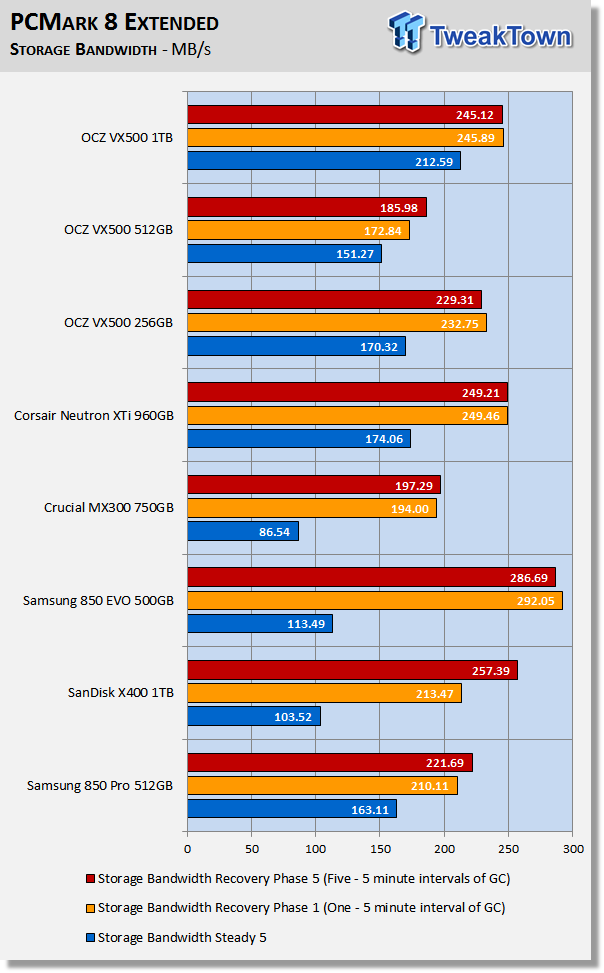
We consider steady state bandwidth (the blue bar) our test that carries the most weight in ranking a drive/arrays heavy workload performance. Performance after Garbage Collection (GC) (the orange and red bars) is what we consider the second most important consideration when ranking a drive's performance. Trace-based steady state testing is where true high performing SSDs are separated from the rest of the pack.
Focusing in on steady-state reveals that the 1TB VX500 is an elite performing SSD with heavy workloads of this nature. The 1TB VX500 absolutely crushes the competing SSDs in our test pool. The 512GB VX500 delivers the lowest performance of the three VX500 capacity points we are testing. This is where the amount of data on the 512GB model and lack of DRAM conspire to drop performance considerably in comparison to its smaller capacity sibling. The 256GB VX500 outperforms Samsung's 850 Pro 512GB in this demanding test.
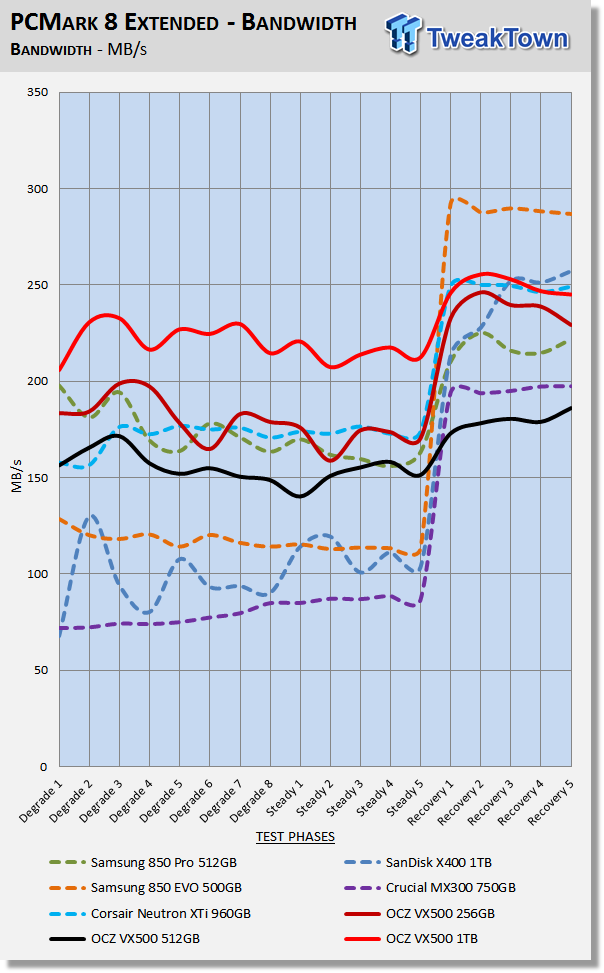
We chart our test subject's storage bandwidth as reported at each of the test's 18 trace iterations. This gives us a good visual perspective of how our test subjects perform as testing progresses. This chart sheds more light on how the drives perform as they progress through the testing phases.
Total Access Time (Latency)
We chart the total time the disk is accessed as reported at each of the test's 18 trace iterations.
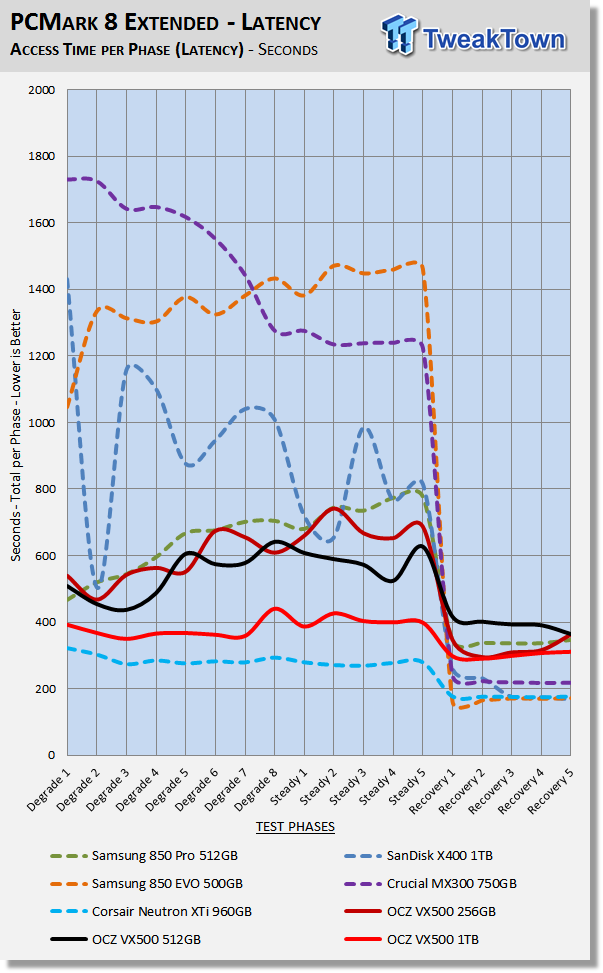
Low latency translates to the real-world as snappiness.
Disk Busy Time
Disk Busy Time is how long the disk is busy working. We chart the total time the disk is working as reported at each of the tests 18 trace iterations.
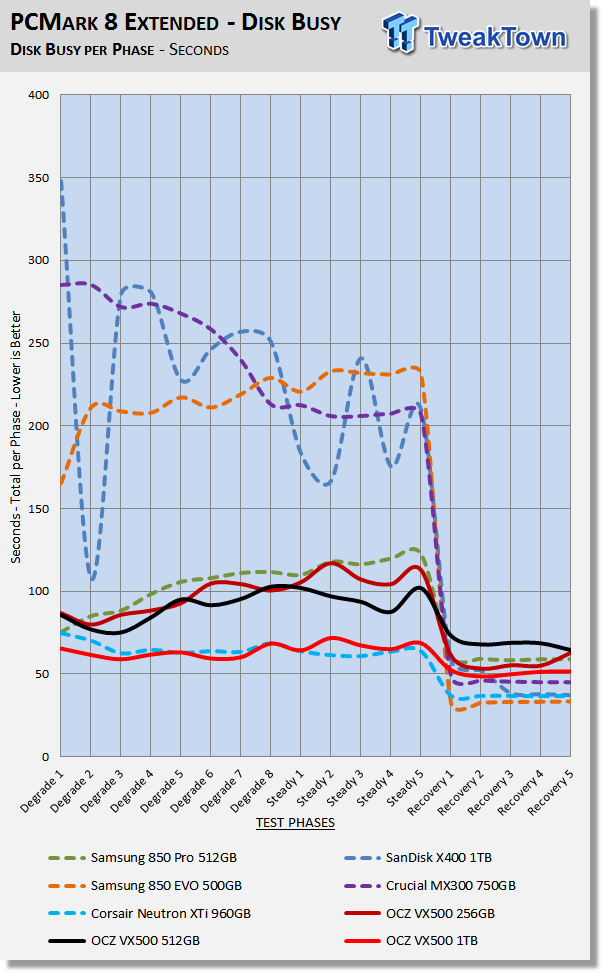
When latency is low, disk busy time is low as well.
Data Written
We measure the total amount of random data that our test drive/array is capable of writing during the degradation phases of the consistency test. Pre-conditioning data is not included in the total. The total combined time that degradation data is written to the drive/array is 470 minutes. This can be very telling. The better a drive/array can process a continuous stream of random data; the more data will be written.
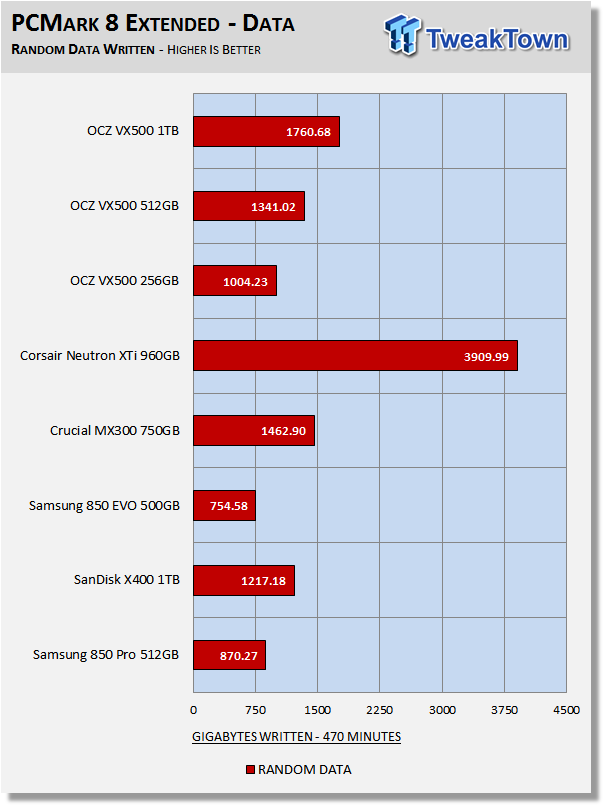
Write latency and overprovisioning are the biggest factors that determine the outcome of this portion of the test. The low latency Corsair XTI runs away with this test. All three capacities of the VX500 write more random data than the 850 Pro and EVO in the same time period.
Benchmarks (Secondary) – 70/30 Mixed Workload
70/30 Mixed Workload Test (Sledgehammer)
Version and / or Patch Used: Iometer 2014
Heavy Workload Model
This test hammers a drive so hard we've dubbed it "Sledgehammer". Our 70/30 Mixed Workload test is designed to simulate a heavy-duty enthusiast/workstation steady-state environment. We feel that a mix of 70% read/30% write, full random 4K transfers best represents this type of user environment. Our test allows us to see the drive enter into and reach a steady state as the test progresses.
Phase one of the test preconditions the drive for 1 hour with 128K sequential writes. Phase two of the test runs a 70% read/30% write, full random 4K transfer workload on the drive for 1 hour. We log and chart (phase two) IOPS data at 5-second intervals for 1 hour (720 data points). 60 data points = 5 minutes.
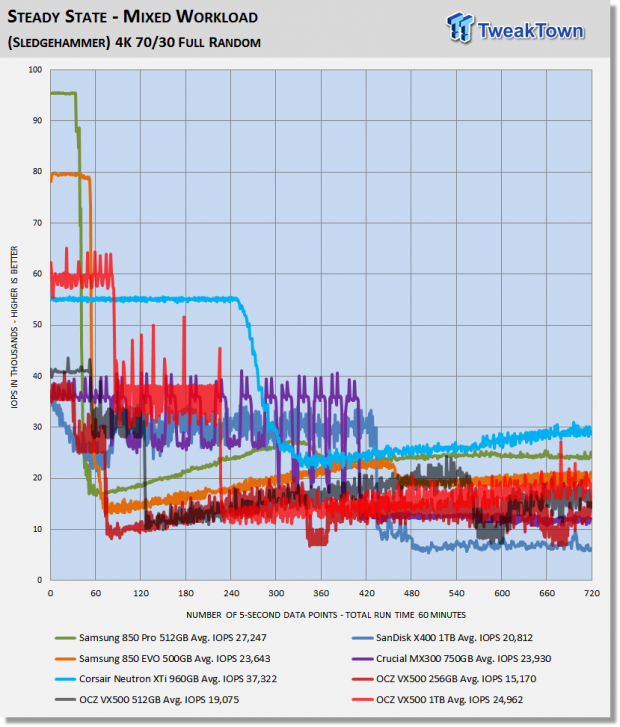
What we like about this test is that it reflects reality. Everything lines up, as it should. Consumer drives don't outperform Enterprise-Class SSDs that were designed for enterprise workloads. Consumer drives based on old technology are not outperforming modern Performance-Class SSDs, etc.
The 1TB VX500 manages a third place in this test. Corsair's double the DRAM XTi wins this test, followed by Samsung's 850 Pro.
Maxed-Out Performance (MOP)
This testing is just to see what the drive is capable of in an FOB (Fresh Out of Box) state under optimal conditions. We are utilizing empty volumes of Windows 10 and Windows Server 2008 R2 64-bit for this testing. Same Hardware, just an OS change.
Windows 10 MOP
OCZ VX500 1TB
Windows Server 2008 R2 MOP
OCZ VX500 1TB
Final Thoughts
We believe that OCZ made a good choice by going with a refresh of the Toshiba Q300 Pro morphed into the VX500. The VX500 as we have seen is a moderate workload powerhouse. The 1TB model is also a heavy workload juggernaut as shown by our PCMark 8 Extended testing. The 1TB model crushed the competing SSDs in our test pool with this most demanding test. This is despite being handicapped by a DRAM cache that is only 25% that of the competing drives in our test pool. Even the DRAM-less 256GB model outperformed Samsung's 850 Pro 512GB in our PCMark 8 extended test; a test that we place great importance upon.
As we touched on briefly back in our intro, the VX500 is a beastly performer. In terms of overall performance, we feel the VX500 is second best performing line of SATA SSDs currently on the market. We believe that great moderate workload performance is a hallmark of top performing SSDs. Except for Samsung's TLC VNAND powered 850 EVO, there are currently no TLC solutions than can compete with MLC-powered SSDs. This is because while TLC SSDs may have great burst performance, they crumble when it comes to everyday consumer workloads. Having an MLC flash array on board gives the VX500 a big advantage over the plethora of current TLC SSDs on the market today. The OCZ VX500 does MLC right with a low price point to go along with killer performance.
We are pleased with the performance we got from the VX500's while running them as our OS Disk. Fast boots, remarkable snappiness, and workload performance that is right up there with the Samsung 850 series SSDs.
OCZ's VX500 series SSD's are TweakTown recommended.
Pros:
- Low Cost
- MLC Flash
- Moderate Workloads
- Heavy Workloads
- Five-Year Warranty
Cons:
- Synthetic Performance
 ASUSTOR Lockerstor 2 Gen2+ AS6702T v2 NAS Review - Fast Performance
 TERRAMASTER D1 SSD Pro Thunderbolt/USB Portable Enclosure Review - Incredible Potential
 Orico K20 Mini 2TB Magnetic Portable SSD Review - Ultra-Thin MagSafe Drive
 TERRAMASTER D4 SSD 4-Bay NVMe DAS Enclosure Review - Superior Portable DAS
 Micron 3610 2TB SSD Review - DRAMless QLC at 11,000 MB/s
 Crimson Desert made $179 million revenue on 4 million sales, Pearl Abyss confirms
 There will be four Steam Machine models, and two Steam Frame models
 Microsoft exec: Windows 11 speed boost isn't 'cheating' because Linux and macOS also do it
 Intel's Razor Lake-AX could bring back on-package memory to compete with AMD's 'Halo' series
 MediaTek and Qualcomm are about to close the performance gap with Apple
 Keychron's 'next-gen mouse switch' combines optical and magnetic technologies
 OpenAI launches Daybreak: GPT-5.5 cybersecurity platform to find software vulnerabilities
 ASUS teases new 20th anniversary ROG Crosshair motherboard
 Playground Games confirms Forza Horizon 6 hack came from the inside
 Retro Commodore 64 and Spectrum PCs from the 1980s have been turned into retro gaming handhelds
 MOZA SGP Sequential Sim Racing Shifter Review
 COLORFUL iGame GeForce RTX 5070 Ultra OC Review - When Style and Performance Meet
 GIGABYTE Z890 AORUS Elite WiFi7 Plus Motherboard Review - Right in the sweet spot
 PNY GeForce RTX 5080 Slim OC Review - A Compact 4K Powerhouse
 HP OmniBook 7 (Panther Lake) 16" Laptop Review
 ASUS ROG Strix X870E-E Gaming WiFi7 NEO - A Crosshair by any other name
 Cooler Master Cosmos Alpha Full-Tower Chassis Review
 Thrustmaster T598 Direct Axial Drive Force Feedback Racing Wheel Bundle Review
 MSI GeForce RTX 5060 Ti 16G VENTUS 2X OC PLUS Review
 MSI MAG B850 Tomahawk Max WiFi II Motherboard Review - Leveling up
 GIGABYTE's new Ultimate OLED Gaming Monitor Bundle includes Xbox Game Pass
 I automated 5 annoying Windows maintenance tasks, and my PC basically runs itself
 How to Fix Windows 11 Black Screen on Boot or After Login
 The first 8 settings I disable on every fresh Windows 11 install in 2026
 Is Your Ethernet Performance Slower Than Wi-Fi? Here's How to Fix It
 MSI's Project Zero Delivers a Stunning Cable-Free Look to More Gamers
 How to Fix "We Couldn't Find a Fingerprint Sensor Compatible With Windows Hello" in Windows 11
 Why Is My Mouse Moving on Its Own? Here's How to Fix It
 Windows Using Too Much RAM? Here's How to Fix It
 Windows 11 is secretly throttling your apps - here's how to catch it