Introduction
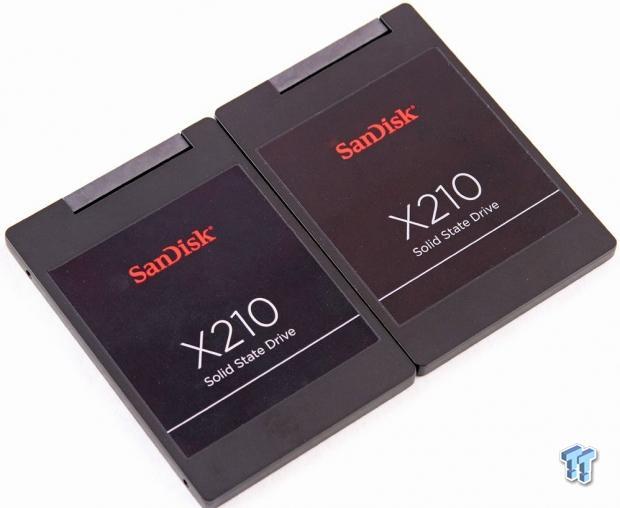
The SanDisk X210 SSD is a SATA 6Gb/s SSD that comes in a 2.5" form factor with a slim 7mm z-height. The X210 is powered by the 8-channel Marvell 9187 controller, in conjunction with SanDisk 19nm ABL NAND. The X210 is available in capacities of 128, 256 and 512GB, and features sequential speeds of 505/470 MB/s and 89,000/60,000 random read/write IOPS.
The emergence of the 'business class' of SSDs signifies the continuing evolution of the SSD market. As the SSD market matures, a drive for nearly every use-case has come forward. The X210 SSDs are designed for read intensive applications that run the gamut from business notebooks and client computing to server operating system loads in datacenter and server markets.
By addressing micro and entry-level servers in data centers, SanDisk is tapping into the burgeoning mainstream enterprise market. As a foundry owner, SanDisk can provide lower costs than many of their competitors.
Balancing the performance requirements for server use with the demands of business laptop and mobile applications is a tricky endeavor. Adding the DevSleep feature addresses the mobile sector, while nCache addresses latency and endurance concerns. nCache creates a layer of SLC flash inside each NAND die that is utilized as a fast non-volatile write cache, thus reducing wear on the underlying MLC.
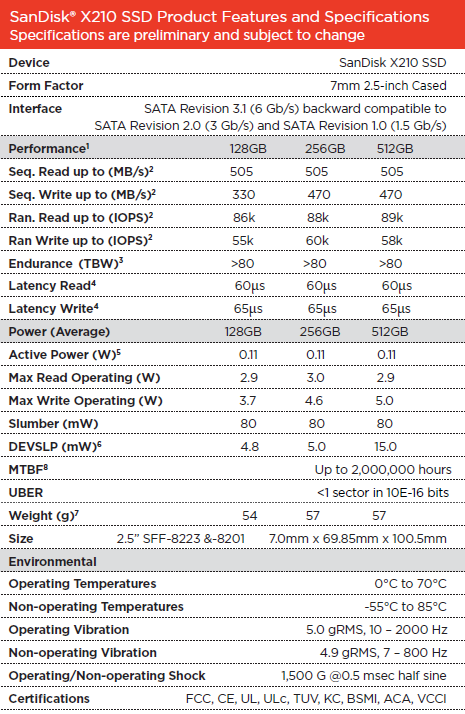
Like many enterprise SSD manufacturers, SanDisk has chosen to stick with conservative endurance specifications. With a blanket 80 TBW (TeraBytes Written) rating for all capacities of the SSD, one could assume that the larger 256 and 512GB X210's can easily provide more resilience due to the typical scaling of endurance with capacity.
The new read-centric class of SSD's provides a cheaper alternative to the more robust high-endurance SSDs geared for heavy write workloads. However, the lower price point provides an opportunity for users to tailor the SSD to their workload by adjusting the amount of performance and endurance through the simple addition of extra spare area. This extra spare area, referred to as overprovisioning (OP), sacrifices a portion of the addressable disk space in exchange for increased performance.
One of the positive aspects of leveraging extra overprovisioning is also the increase in IOPS per Watt. While the massive gains in power efficiency and performance are the driving force behind the SSD explosion in the datacenter, the endurance concerns are one of the factors holding them back. With the addition of extra overprovisioning users can address the endurance concerns, and add to the performance and efficiency of the SSD in one simple move.
Many considerations factor in to just how much extra overprovisioning to add to the SSD to attain the correct performance and endurance profile. Today we are keeping it simple, testing with the base settings for the SSD and with an extra 20% of overprovisioning, but users can utilize many varying levels to address their performance challenges.
SanDisk X210 Architecture

The eight-channel Marvell 9187 controller is the catalyst that powers the X210. Marvell does not provide firmware for their controllers, and SanDisk's proprietary firmware works in conjunction with their 19nm ABL NAND to provide enhanced functionality. SanDisk and Toshiba, through their Flash Forward initiative, have developed ABL (All Bit Line) NAND to provide twice the parallelism in comparison to standard HBL (Half Bit Line) NAND.
The addition of the nCache layer is a big advantage for the X210. The small layer of SLC, with its 100,000 P/E Cycles, acts as a cache for the MLC, with its mere 5,000 P/E Cycles. Small random writes are intelligently cached to the SLC buffer and combined into large blocks, and these blocks are then written sequentially to the MLC NAND. Sequential writes actually wear NAND less than random writes, helping to boost the longevity of the MLC by lowering the random write workload.
Caching also speeds up the initial burst of random write activity to the SSD. In operating system environments (bursty), one of the target markets for the X210, this can result in snappier response times. The X210 also features another layer of DRAM cache, typically used for caching tables.
The maximum power consumption of the X210 during read operations is 3.0 Watts, and 4.6 Watts for heavy write workloads. While the SSD idles, it will draw a mere 80 mW. Once the X210 enters into DEVSLP mode, it sips power at 5 mW, enhancing efficiency and boosting battery life in mobile applications.
The X210 features an MTBF of 2,000,000 hours, and an UBER rating of 10E16. The SSD is backed with a five-year warranty.
SanDisk 256GB X210 Internals


The SanDisk X210 comes in a 7.5mm z-height metal casing. This slim 2.5" form factor is well suited for slim applications.


The case comes apart easily once four screws are removed. The top portion of the case is actually made of a metal alloy and the bottom consists of plastic. The metal half has thermal pads that wick heat away from the NAND, DRAM and Marvell 9187 controller. This extends the life of the components, and helps cool the SSD in high heat environments.

The bottom of the PCB faces into the plastic portion of the case, and is devoid of components.

The top of the PCB holds eight of the BGA-mounted 32GB ABL NAND packages, along with the controller and DRAM.
Test System and Methodology


We utilize a new approach to HDD and SSD storage testing for our Enterprise Test Bench, designed specifically to target long-term performance with a high level of granularity.
Many testing methods record peak and average measurements during the test period. These average values give a basic understanding of performance, but fall short in providing the clearest view possible of I/O QoS (Quality of Service).
'Average' results do little to indicate the performance variability experienced during actual deployment. The degree of variability is especially pertinent, as many applications can hang or lag as they wait for I/O requests to complete. This testing methodology illustrates performance variability, and includes average measurements, during the measurement window.
While under load, all storage solutions deliver variable levels of performance. While this fluctuation is normal, the degree of variability is what separates enterprise storage solutions from typical client-side hardware. Providing ongoing measurements from our workloads with one-second reporting intervals illustrates product differentiation in relation to I/O QOS. Scatter charts give readers a basic understanding of I/O latency distribution without directly observing numerous graphs.
Consistent latency is the goal of every storage solution, and measurements such as Maximum Latency only illuminate the single longest I/O received during testing. This can be misleading, as a single 'outlying I/O' can skew the view of an otherwise superb solution. Standard Deviation measurements consider latency distribution, but do not always effectively illustrate I/O distribution with enough granularity to provide a clear picture of system performance. We use histograms to illuminate the latency of every I/O issued during our test runs.
Our testing regimen follows SNIA principles to ensure consistent, repeatable testing. We attain steady state through a process that brings the device within a performance level that does not range more than 20% during the measurement window. Forcing the device to perform a read-write-modify procedure for new I/O triggers all garbage collection and housekeeping algorithms, highlighting the real performance of the solution.
We measure power consumption during precondition runs. This provides measurements in time-based fashion, with results every second, to illuminate the behavior of power consumption in steady state conditions. Power consumption can cost more over the life of the device than the initial acquisition price of the hardware itself. This significantly affects the TCO of the storage solution. We also present IOPS-to-Watts measurements to highlight the efficiency of the storage solution.
Today's article focuses on the advantages of overprovisioning, and results are presented with the standard configuration (100% LBA) and an extra 20% of overprovisioning (80% LBA). The first page of results will provide the 'key' to understanding and interpreting our test methodology.
4K Random Read/Write

We precondition the SanDisk 256GB X210 for 18,000 seconds, or five hours, receiving reports on several parameters of workload performance every second. We then plot this data to illustrate the drives' descent into steady state.
This chart consists of 36,000 data points. The lines through the data scatter are the average during the test. This type of testing presents standard deviation and maximum/minimum I/O in a visual manner. We provide histograms for further latency granularity below. This downward slope of performance happens very few times in the lifetime of the device, typically during the first few hours of use.
The 20% of extra overprovisioning (80% LBA) yields a tremendous return in performance, with the heavy random write workload more than tripling in average speed.

Each QD for every parameter tested includes 300 data points (five minutes of one second reports) to illustrate the degree of performance variability. The line for each QD represents the average speed reported during the five-minute interval.
4K random speed measurements are an important metric when comparing drive performance, as the hardest type of file access for any storage solution to master is small-file random. One of the most sought-after performance specifications, 4K random performance is a heavily marketed figure.
The X210 delivers an increase in random read speed from the addition of overprovisioning (OP), which is not an entirely expected result. The increase in random write performance is expected, but the jump in random read speed is a nice surprise. With a standard configuration (100% LBA), the X210 averages 41,826 IOPS, while the extra spare area (80% LBA) provides 68,903 IOPS at QD256.

Garbage collection routines are more pronounced in heavy write workloads. This leads to more variability in performance. The X210 averages 3,871 IOPS in standard configuration, and more than triples that to 15,908 with extra OP. There is the introduction of significant variability with the OP, but this is still better when you are operating at three times the speed of the normal configuration.
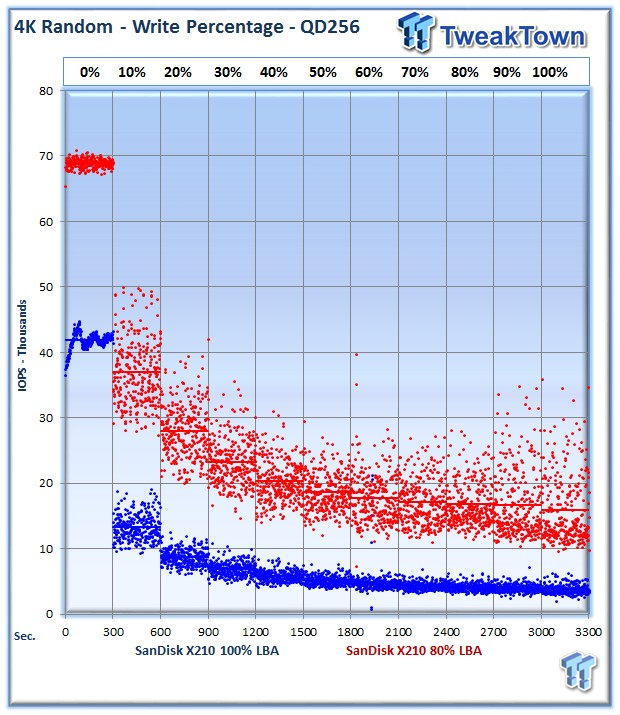
Our write percentage testing illustrates the varying performance of each solution with mixed workloads. The 100% column to the right is a pure write workload of the 4K file size, and 0% represents a pure 4K read workload.
The true test of any storage solution is how well it handles mixed read/write operations. The X210 delivers the same large increase in performance across the board with extra OP.
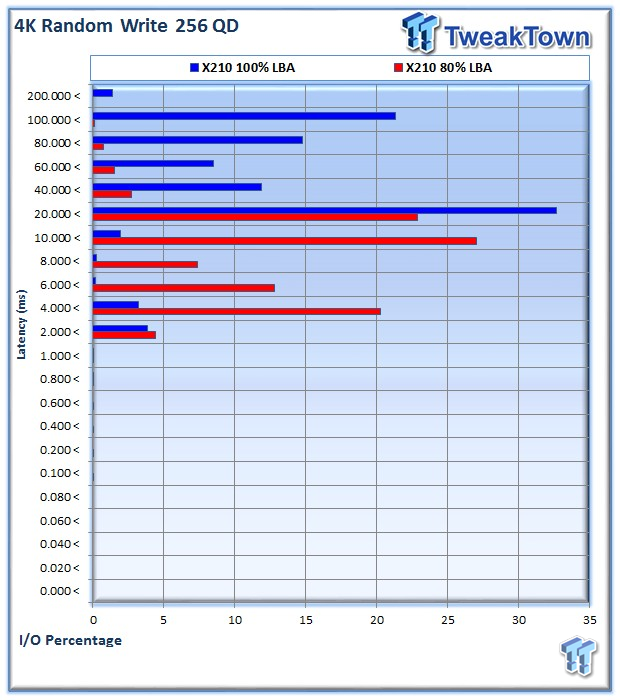
The X210 experiences significantly better latency with the extra overprovisioning. We note the larger distribution of latency results, due to the increased performance variability with extra overprovisioning.
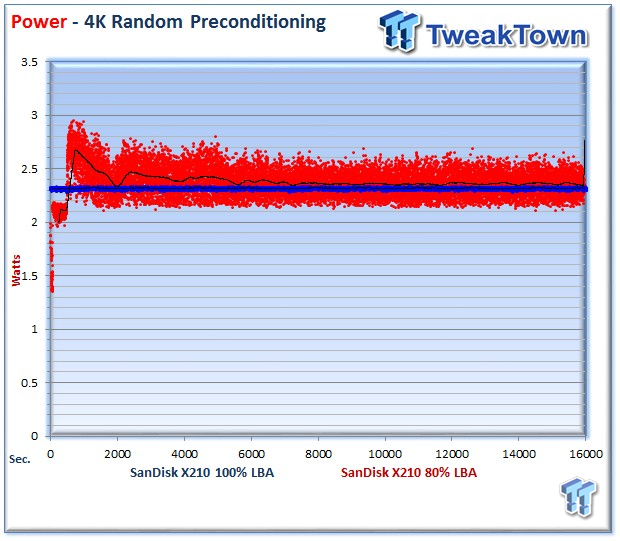
We record the power consumption measurements during our precondition run. We calculate the stated average results during the last five minutes of the test, after the device has settled into steady state.
The X210 draws a very consistent line of 2.32 Watts when accessing 100% of the LBA, but the extra OP introduces some jitter into the results. The jitter does not equate to an overall higher power draw for overprovisioning, the average of 2.42 is still within .1 Watts of the 100% LBA test.
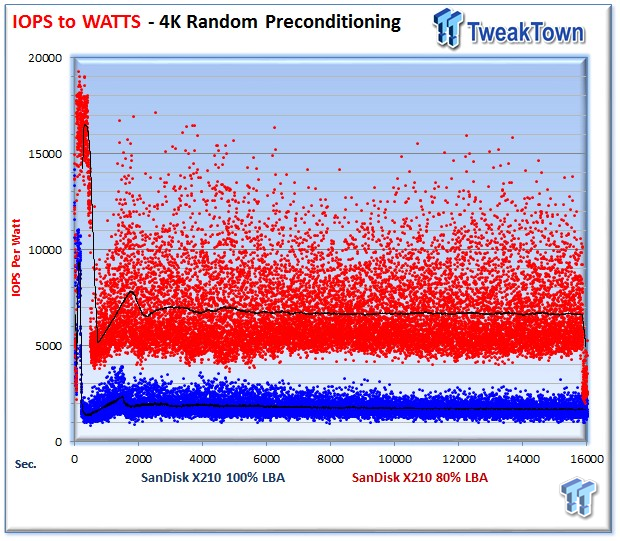
IOPS to Watts measurements are generated from data recorded during our precondition run, and the stated average is from the last five minutes of the test.
When only accessing 80% of the drive (20% OP), the X210 experiences a massive jump in efficiency with an increase from 1,673 to 6,302 IOPS per Watt. For heavy workloads, an efficiency increase of nearly 4X is simply extraordinary.
8K Random Read/Write

The 8K random precondition phase reaffirms the massive increase in write performance from utilizing extra OP (80% LBA).
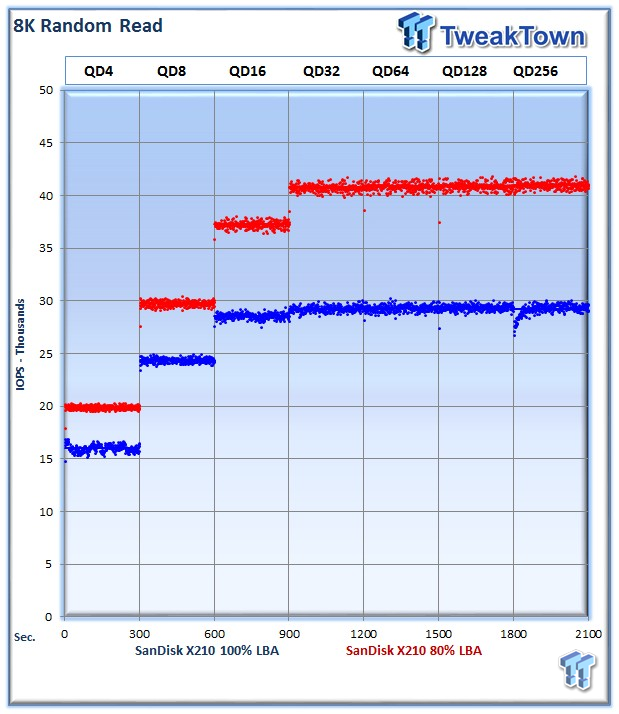
8K random read and write speed is a metric that is not tested for consumer use, but for enterprise environments this is an important aspect of performance. Several workloads rely heavily upon 8K performance and we include this as a standard with each evaluation. Many of our Server Emulations below also test 8K performance with various mixed read/write workloads.
The average 8K random read speed of the X210 weighs in at 29,241 IOPS at 100% LBA, and with extra OP (80% LBA) we note an increase to 41,826 IOPS.

The average 8K random write speed of X210 jumps from 2,224 IOPS at QD256 to 9,290 IOPS.

The X210 exhibits the same increase in mixed 8K workloads that we witnessed with a 4K workload. The increased variability is hardly a concern when dealing with such a large increase in performance.


Power consumption for the X210 averages 2.68 Watts with 100% LBA during the measurement window. The X210 actually pulls less power with extra overprovisioning, averaging only 2.54 Watts.
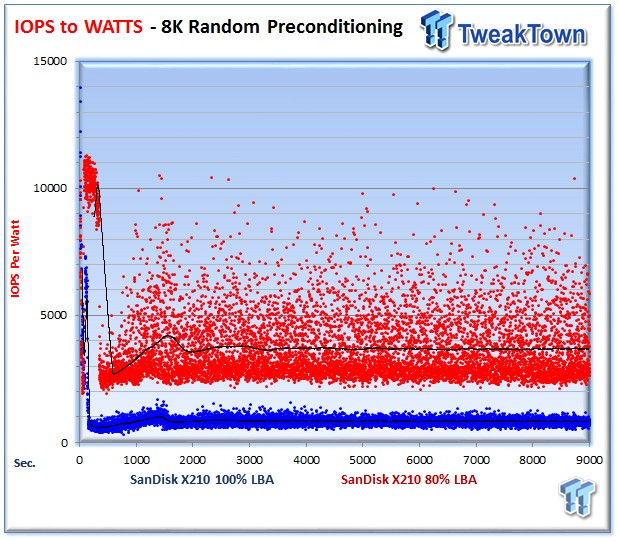
100% LBA averages 829 IOPS per Watt, and experiences an improvement up to 3,675 IOPS per Watt with extra OP.
128K Sequential Read/Write

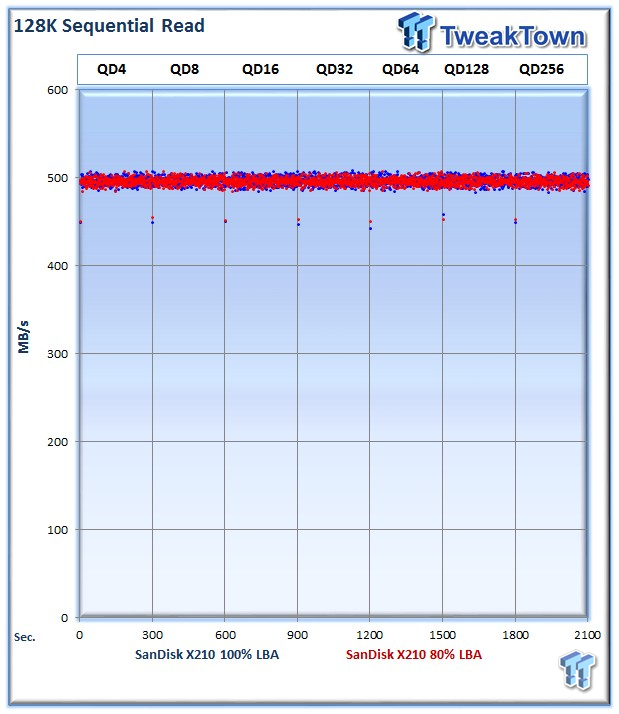
The 128K sequential speeds reflect the maximum sequential throughput of the SSD using a realistic file size encountered in an enterprise scenario.
The extra performance we observe with random workloads does not carry over to sequential read data, with an average of 496 MB/s for both settings.

The X210 sequential write speed also remains unaffected, with only 1 MB/s of difference between the two with 447 MB/s for the 100% LBA results.
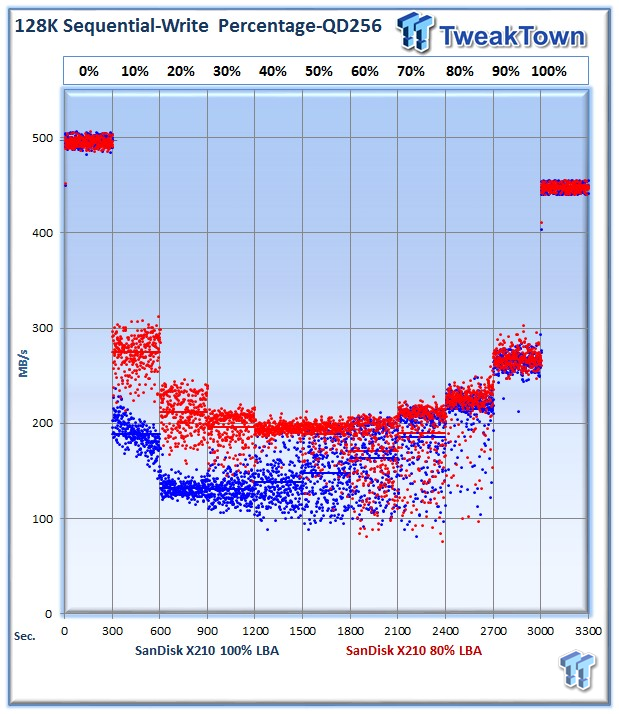
Surprisingly, our mixed workload testing teases out a performance delta with OP in the 10-70% range, with the extra OP (80% LBA) experiencing acceleration.

With a pure sequential write workload, there is very little difference in latency performance.
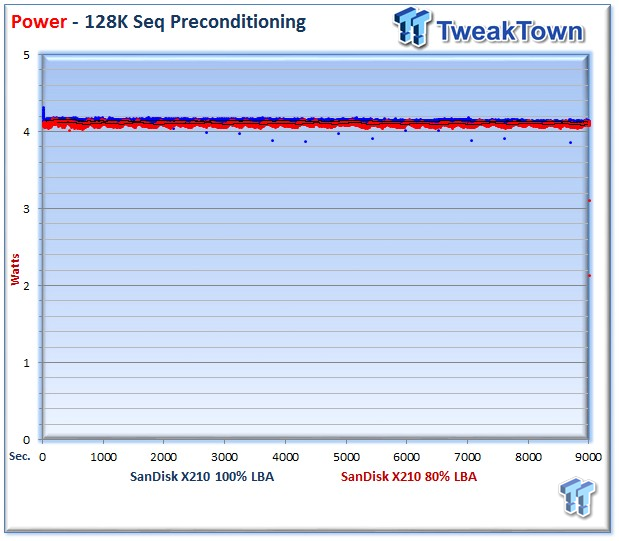
With 100% LBA the X210 averages 4.12 Watts, and 80% LBA averages 4.08 Watts.
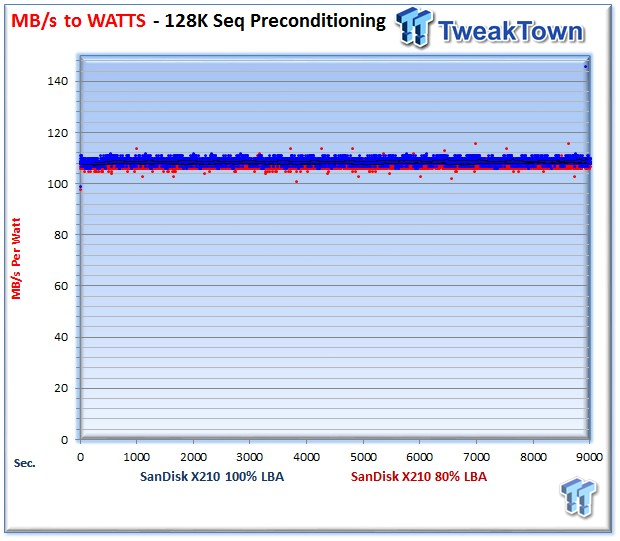
100% LBA averages 108 MB/s per Watt, with the 80% LBA nearly identical.
Database/OLTP and Webserver
Database/OLTP


This test emulates Database and On-Line Transaction Processing (OLTP) workloads. OLTP is in essence the processing of transactions such as credit cards and high frequency trading in the financial sector. Enterprise SSDs are uniquely well suited for the financial sector with their low latency and high random workload performance. Databases are the bread and butter of many enterprise deployments. These are demanding 8K random workloads with a 66% read and 33% write distribution that can bring even the highest performing solutions down to earth.
With 100% LBA, the X210 averages 4,237 IOPS at QD 256, while the 80% LBA results are stratospheric with 13,603 IOPS.
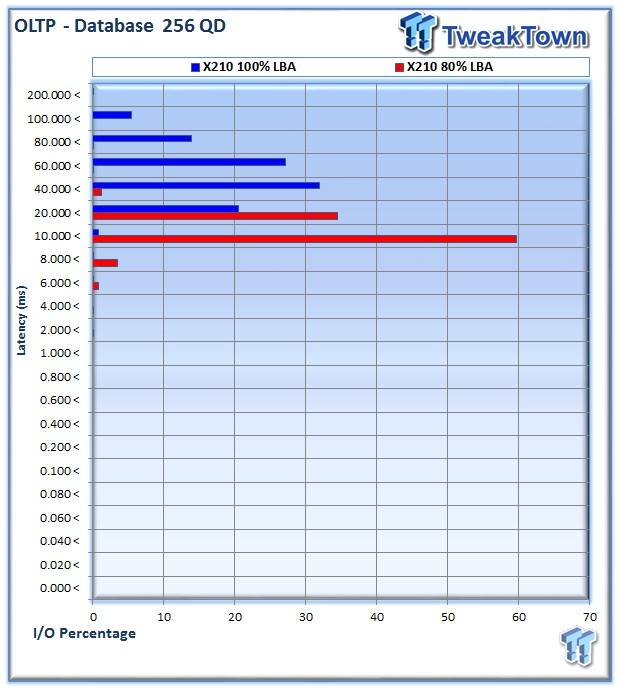
The OP results (80% LBA) are significantly better than the regular settings. For latency sensitive database operations, the increase in speed and latency will yield big results.

100% LBA averages 2.18 Watts compared to 2.08 Watts during the precondition run. With some workloads consuming more or less power with overprovisioning, we can chalk it up to be within the standard expected variance of +/- .1 Watts.

100% LBA averages 1,951 IOPS in comparison to 80% LBA results with 6,523 IOPS per Watt.
Webserver


The Webserver profile is a read-only test with a wide range of file sizes. Web servers are responsible for generating content for users to view over the internet, much like the very page you are reading. The speed of the underlying storage system has a massive impact on the speed and responsiveness of the server that is hosting the website, and thus the end-user experience.
The pure mixed read workload does not experience as much acceleration as the mixed workloads with mixed read/write access. 100% LBA averages 21,159 IOPS at QD256 and 80% LBA averages 22,529 IOPS.


100% LBA averages 2.17 Watts and 80% LBA averages 2.13 Watts.
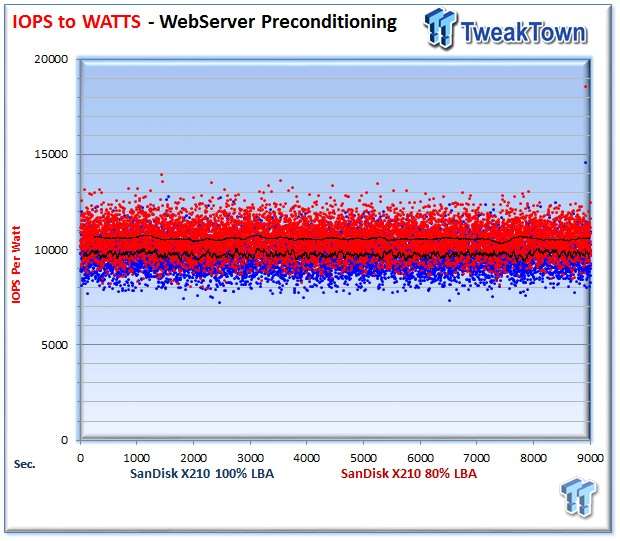
100% LBA averages 2.17 IOPS per Watt and 80% LBA averages 2.13 IOPS per Watt.
Final Thoughts

SanDisk has a long history of NAND innovation. To understand the massive scale of their operations, one would only have to look to its Shanghai facility. The Shanghai operation alone delivers over two million flash products per day. This mind-numbing production capacity includes USB thumb drives and other small devices, but is still impressive. With 11 of the leading PC OEM's utilizing SanDisk SSDs, and their NAND embedded into many leading mobile devices, the penetration of SanDisk into the flash market is unquestionable. The recent addition of SMART Storage Systems into the SanDisk family positions them for even more dominance in the flash market.
The X210 serves the mainstream read-centric market and works well for mobile applications and micro and entry-level servers. Today's evaluation focused on the transformative effects of overprovisioning on this type of read-centric SSD. Overprovisioning provides a tangible increase in performance for any SSD, and the X210 is no exception.
With the low price point, afforded by SanDisk's foundry ownership, the X210 makes a particularly attractive SSD for this type of usage scenario. The proven Marvell controller and SanDisk firmware works in conjunction with their 19nm ABL NAND and nCache IP to deliver outstanding performance.
We found that the addition of 20% of spare capacity tripled the performance in a 4k random write workload. We also witnessed similar gains in performance across the spectrum of mixed random read/write workloads. This spectacular increase comes at the expense of usable capacity, but is scalable to address the specific needs of the user.
The increase in random write speed is expected, but the increase in random read speed was a nice side effect. In pure sequential read/write workloads, the extra overprovisioning did not lead to enhanced performance. However, in mixed sequential workloads, we surprisingly witnessed a bump in performance in the 10-70% range.
Our power testing had a tale to tell as well. We did not witness a significant increase in power consumption between the two configurations, but the increase in efficiency in a heavy write workload was stellar. We witnessed up to a four times increase in efficiency with the addition of 20% extra overprovisioning.
One aspect that we did not test is multiplication of endurance afforded by extra OP. This can lead to a much longer lifespan of any SSD, but would require multiple samples and a dedicated test system for an extended time. We know from conventional wisdom that endurance scales with the amount of overprovisioning, but would need to conduct additional testing to assign actual values to the scaling.
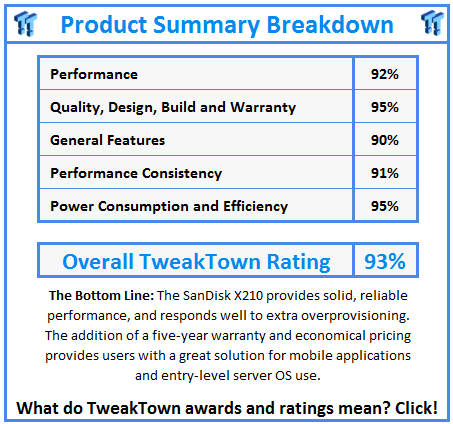
The ability of the X210 to scale up to potentially be used in entry-level database and OLTP workloads with the addition of extra OP is excellent, and the implications of extra OP in RAID arrays would multiply performance, endurance and efficiency even more. With its performance backed by a leading NAND fabricator with a five-year warranty, the X210 receives our TweakTown Editor's Choice Award.

 United
States: Find other tech and computer products like this
over at
  United
Kingdom: Find other tech and computer products like this
over at
  Australia:
Find other tech and computer products like this over at
  Canada:
Find other tech and computer products like this over at
  Deutschland:
Finde andere Technik- und Computerprodukte wie dieses auf