Introduction
Not too long ago people were talking about the way that Intel had snatched back the performance crown from AMD. The P4 and Netburst was history, Conroe and its successors had done their job. But as we have mentioned before, once Intel gets rolling, they are hard to slow down.
They pushed out Nehalem, a native quad-core CPU, which ran a full three channels of RAM and eight threads per cycle. It simply trounced everything out, including older dual-quad core systems out at the time.
Of course these CPUs were not inexpensive; they and the boards to support them cost a lot of money. This did lead to some issue in adoption of the Nehalem/Core i7.
Well, Intel was not sitting back and waiting. They had plans for a dual channel memory version of Nehalem. But they wanted to make sure they provided some overlap in the way the CPU offerings worked.
This new architecture would not just be a lower powered version of Nehalem, it was going to be something very different and will set the mainstream world on its ear.
Tag along with us as we show you exactly what Lynnfield (both Core i5 and Core i7) have to offer you.
What's New?
Lynnfield represents something that is both new and old. Its origins are in Nehalem and the way that core architecture is laid out. However, there are some differences. I am not going to go into them in great detail; after all you really want to know how well it performs, so here is a short and quick list of the major differences.
One of the main differences is Dual Channel vs. Triple Channel memory support. On the surface this might not seem like a big deal and for every day computing, you would be correct. This is one of the reasons it could be safely removed for Lynnfield and its mainstream market position.
The new Lynnfield has some performance improvements, too. According to Intel it is roughly 20% faster than the Core 2 Quad when comparing the i5 750 to the Core 2 Quad Q9400. It also represents a 40% reduction is silicone real-estate due to the shift to a 2-chip design.
The reduction is due to Intel moving the control for up to two discrete PCI-e GPUs (one GPU at x16 or two at X8 each) onto the CPU rather than inside the chipset.
We mentioned the reduction in memory channels, but with the loss of one channel comes increased official memory support. Lynnfield now officially supports DDR3-1333. This is a little faster than the DDR3-1066 support for the Core i7 9xx series.
Another reduction is also price. The i7 870, which is the top end 1156 CPU runs only $555 in lots of 1000. This is about half the price of the i7 975, while the P55 boards should also be significantly less making the whole platform more affordable.
This may bite into AMD's Price/Performance line, of course that is only if Lynnfield can perform. So let's find out if it can.
Overclocking
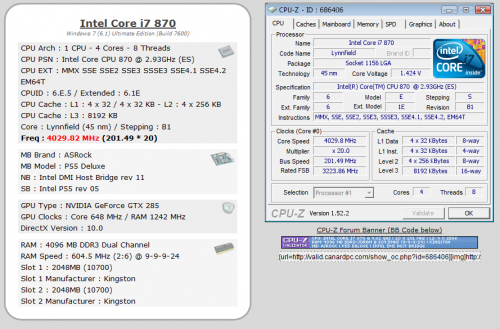
Overclocking the Core i7 was a breeze. I simply entered the BIOS on the ASRock P55 motherboard that I was using and set the BCLK to 202, adjusted the voltage and RAM divider and I was off and running at a very nice 4030MHz completely stable. At that speed, I was able to run all of our tests back to back without any issue and even found myself running a little over on the gaming sessions.
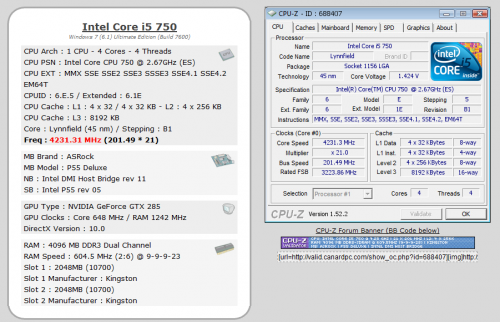
For the Core i5 we did pretty much the same thing except I pushed the multiplier to 21. This netted us a very nice 4.2GHz overclock on the Core i5 750 - roughly a 59% overclock and not bad at all for taking only three minutes to get going.
You can see the validation for the i7 870here, while the i5 750 is here.
I am confident that with better cooling and some tweaking, you would be able to get much higher with both of these CPUs.
As all overclocking results are dependent on the hardware you use your results may vary. Results of our overclocking tests are included in the performance section with the stock scores.
Important Editor Note: Our maximum overclocking result is the best result we managed in our limited time of testing the motherboard. Due to time constraints we weren't able to tweak the motherboard to the absolute maximum and find the highest possible FSB, as this could take days to find properly. We do however spend at least a few hours overclocking every motherboard to try and find the highest possible overclock in that time frame. You may or may not be able to overclock higher if you spend more time tweaking or as new BIOS updates are released. "Burn-in" time might also come into play if you believe in that.
Test System Setup and Comments
Test Systems
Processor: Intel Core i7 870 and Intel Core i5 750
Mainboard ASRock P55 Deluxe (P130 BIOS) (Supplied by ASRock)
Memory: 4GB Kingston KHX12800D3T1K3/6GX (Supplied by Kingston)
Hard Disk: Kingston SSD Now M (Intel X25-M 80GB SSD) (Supplied by Kingston)
Graphics Card: Zotac GTX 285 AMP! Edition 1GB (flashed to stock BIOS) (Supplied by Zotac)
Cooling: Cooler Master Hyper 212 (with an extra fan) (Supplied by Cooler Master)
Operating System: Microsoft Windows 7 Ultimate RC-1
Drivers: Intel INF 9.1.1.1015, ForceWare 190.62
Processor: Intel Core i7 975, Intel Core i7 965 and Intel Core i7 920
Mainboard ASRock X58 Extreme (P130 BIOS) (Supplied by ASRock)
Memory: 6GB Kingston KHX12800D3T1K3/6GX (Supplied by Kingston)
Hard Disk: Kingston SSD Now M (Intel X25-M 80GB SSD) (Supplied by Kingston)
Graphics Card: Zotac GTX 285 AMP! Edition 1GB (flashed to stock BIOS) (Supplied by Zotac)
Cooling: Cooler Master Hyper 212 (with an extra fan) (Supplied by Cooler Master)
Operating System: Microsoft Windows 7 Ultimate RC-1
Drivers: Intel INF 9.1.0.1007, ForceWare 190.62
Processor: AMD Phenom II X4 955 Black Edition
Mainboard Asus M4A79T Deluxe (BIOS 1604) (Supplied by Asus)
Memory: 4GB Kingston KHX12800D3T1K3/6GX (Supplied by Kingston)
Hard Disk: Kingston SSD Now M (Intel X25-M 80GB SSD) (Supplied by Kingston)
Graphics Card: Zotac GTX 285 AMP! Edition 1GB (flashed to stock BIOS) (Supplied by Zotac)
Cooling: Cooler Master Hyper 212 (with an extra fan) (Supplied by Cooler Master)
Operating System: Microsoft Windows 7 Ultimate RC-1
Drivers: AMD Driver version 3.0.732.0 and NVIDIA ForceWare 190.62
For this evaluation, we re-ran all the test data on fresh installs. This took a lot of extra time, but I did want to make sure everything was current as of this publication.
You will notice that we went with a Phenom II X4 955 Black Edition instead of the more expensive Phenom II X4 965 Black Edition. There were two reasons for this; the first being it was all I had on hand in the lab, while the second is the PII X4 955 BE is the closest in terms of price.
The Lynnfield Core i5 750 will sell for around $200 in the US, the PII X4 955 BE also sells for around $200 in the US. This will put AMD's current marketing strategy of "better price performance" directly to the test.
Let's go!
Synthetic Tests - Part I
With any system you will want to see a combination of synthetic testing and real-world. Synthetics give you a static, easily repeatable testing method that can be compared across multiple platforms.
For our synthetic tests we use Everest Ultimate, SiSoft Sandra, FutureMark's 3D Mark Vantage and PCMark Vantage, Cinebench as well as HyperPi. Each of these covers a different aspect of performance or a different angle of a certain type of performance.
CPU Raw Performance
For CPU Raw Performance we want to look at the theoretical performance numbers. This means how many GigaFlops you can get. We also test for memory bandwidth. As memory controllers are moved onto the CPU and away from the Northbridge, we see memory performance increasing but also becoming much more CPU dependent than motherboard dependent.
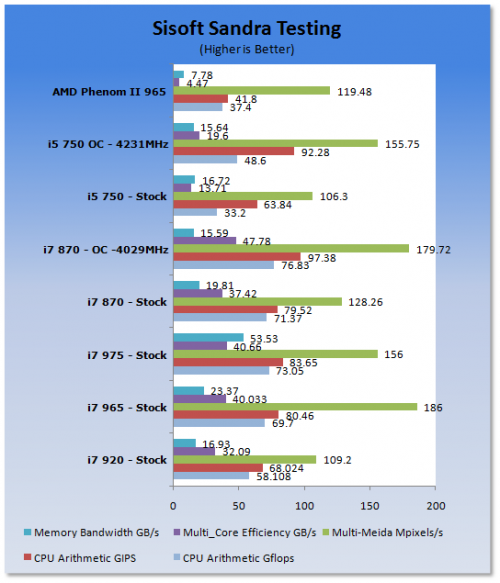
To test memory and raw CPU performance, we use a combination of SiSoft Sandra and HyperPi 0.99.
SiSoft Sandra
Version and / or Patch Used: 2009 SP3c
Developer Homepage: http://www.sisoftware.net
Buy It Here
You can see that in terms of sheer CPU power Intel has the upper hand here even comparing dollar-for-dollar performance.
HyperPi 0.99
Version and / or Patch Used: 0.99
Developer Homepage: www.virgilioborges.com.br
Product Homepage: www.virgilioborges.com.br
Download It Here
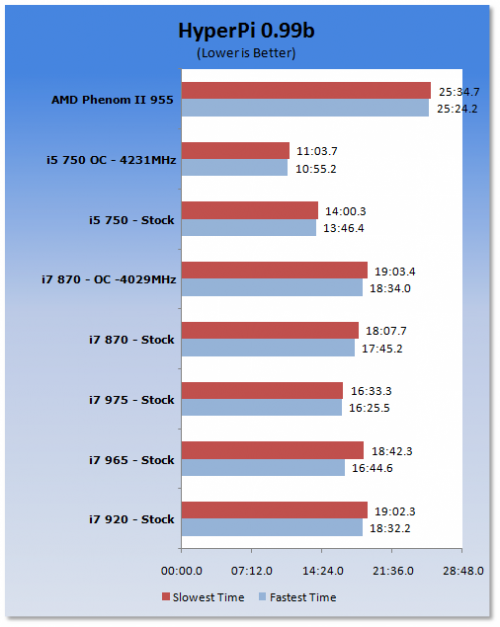
HyperPi is a front end for SuperPi that allows for multiple concurrent instances of SuperPi to be run on each core recognized by the system. It is very dependent on CPU to memory to HDD speed. The faster these components the faster it is able to figure out the number Pi to the selected length. For our testing we use the 32M run. This means that each of the four physical and four logical cores for the i7 (four total on the PII x4 955 and Core i5) is trying to calculate the number Pi out to 32 million decimal places. Each "run" is a comparative to ensure accuracy, and any stability or performance issues in the loop mentioned above will cause errors in calculation.
Okay, now this sort of surprised me here. In fact I re-ran the test four times to make sure I was getting the right results. The Core i5 stomps on everyone in this test. My only thought here is that the overhead of running two counts of HyperPi on each core is simply too much. So when you cut it down to one each, then we see the real power behind the Nehalem architecture.
Synthetic Tests - Part II
Overall System Performance and Gaming
Here is where we dig out the FutureMark tests.
PCMark Vantage
Version and / or Patch Used: 1.0.0.0
Developer Homepage: http://www.futuremark.com/
Product Homepage: www.futuremark.com
Buy It Here
For overall system performance we use PCMark Vantage, this is run in both x86 and x64 mode to give the best indication of performance.

Again we find that the new 1156 CPUs from Intel are quite impressive. They stand out in terms of performance considering their price point and market space.
For synthetic gaming tests we used the industry standard and overlockers bragging tool, 3DMark Vantage. This is a test that strives to mimic the impact modern games have on a system. FutureMark went a long way to change from the early days of graphics driven tests to a broader approach including physics, AI and more advanced graphics simulations. 3DMark Vantage uses the DX10 API in addition to having support for PhysX. Due to the PhysX support and our use of an NVIDIA GPU we run with PhysX enabled and disabled to give you the best indication of real system performance. For testing we use the "Performance" test run.
3DMark Vantage
Version and / or Patch Used: 1.0.1
Developer Homepage: http://www.futuremark.com/
Product Homepage: www.futuremark.com
Buy It Here
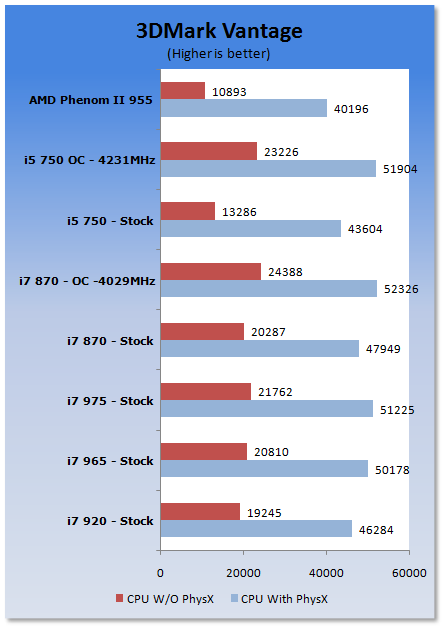
For 3DMark Vantage I was not as much concerned with the overall score, but wanted to take a close look at how the CPUs performed. As you can see from the chart, there is almost no comparison. The Core i5 is the slowest of the lot and it still performs very well - even with GPU based PhysX disabled.
Cinebench R10 x64
Version and / or Patch Used: R10
Developer Homepage: http://www.maxon.net/
Product Homepage: www.maxon.net
Download It Here
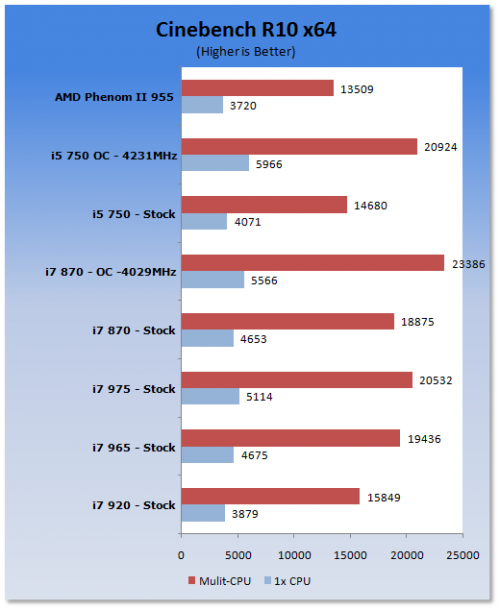
Cinebench is a synthetic rendering tool developed by Maxon. Maxon is the same company that developed Cinema4D another industry leading 3D Animation application. Cinebench R10 tests your systems ability to render across a single and multiple CPU cores. It also tests your systems ability to process OpenGL information.
Again Lynnfield shows that it is a capable performer even with a professional application like Cinebench.
Real-World Tests - Part I
Real-world testing allows us to see how well a product will perform when used in the same manner as it would be in your house or office. It is an important side to performance testing as it can uncover hidden glitches in the way a product performs.
For real-world testing we use some common applications and functions. We test with LightWave 3D for rendering performance, AutoGK for Transcoding from DVD to AVI and two games for gaming testing.
Rendering
Rendering of 3D animation is a system intensive endeavor. You need good CPU, memory and HDD speed to get good rendering times. For our testing we use LightWave 3D. This software from Newtek is an industry standard and has several pre-loaded scenes for us to use.
LightWave 3D
Version and / or Patch Used: 9.6
Developer Homepage: http://www.newtek.com
Product Homepage: http://www.newtek.com/lightwave/
Buy It Here

Lynnfield does not do as well as its bigger bothers in 3D rendering. This is due to the missing third memory channel. Still if you push the Lynnfield you can get some of that performance back without too much effort.
AutoGK
Version and / or Patch Used: 2.55
Developer Homepage: http://www.autogk.me.uk/
Product Homepage: http://www.autogk.me.uk/
Download It Here
AutoGK stands for Auto Gordian Knot; it is a suite of transcoding tools that are compiled into and easy to install and use utility. It allows you to transcode non-protected DVDs and other media to Xvid or DivX format. For our testing purposes we use a non-DRM restricted movie that is roughly 2 hours in length. This is transcoded to a single Xvid AVI at 100% quality.

The times here are sort of all over the board. However at stock speeds the Lynnfield is a tad on the slower side. The Core i5 750 and the Core i7 870 come in at just under 40 minutes for your average two hour movie. Still you can overclock either one of them and your transcode times will drop dramatically.
Real-World Tests - Part II
Here we have our real gaming tests. Each of the games we chose uses multiple cores and GPUs. They are able to stress the system through use of good AI. Both have decent positional audio that adds impact to the sound subsystem of the board. We ran each game through the level or parts listed and recorded frame per second using FRAPS. This brings the whole game into play.
*** A word on gaming as a CPU test; ***
Gaming is no longer a good indication of true CPU performance. As you push over 1024 x 768 resolutions you see the GPU take over and dominate the performance scale. This is even evident in 3DMark Vantage testing. The CPU score can be through the roof and still not add more than a handful of points to the overall score. This does not mean the gaming is not of value for testing. It can show an issue with the CPU and gaming if the CPU is unable to meet the speed expected of a certain GPU. But for the most part you are not going to see great differences in performance between CPUs in high resolution gaming.
Cryostasis: Sleep of Reason
Version and / or Patch Used: 1.0
Timedemo or Level Used: From Ship Entry until third Spirit Journey
Developer Homepage: http://www.505games.co.uk
Product Homepage: http://cryostasis-game.com
Buy It Here
Cryostasis : Sleep of Reason is an interesting game it is heavy on PhysX so to play it properly you will really want an nVidia GPU. However that aside it can be immersive, imagine Myst with Guns and monsters. One of the cool concepts is the spirit journeys. These allow you to enter the past of lost souls. You have to change their past to change your future. Each one makes for a nice diversion and requires you to think about what you are doing and how it will affect the outcome of the game. The Settings we used are shown below.
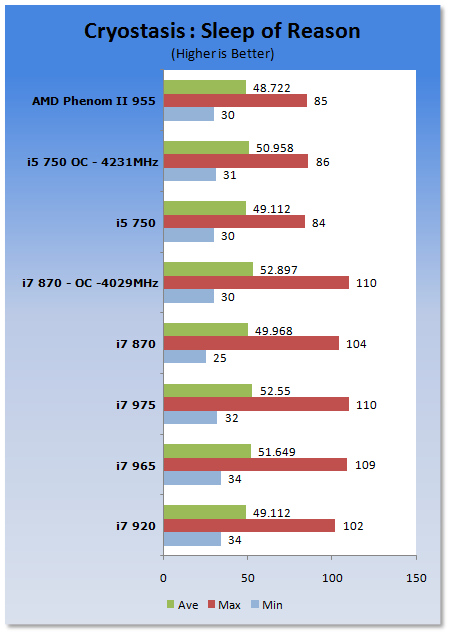
As we expected the performance difference between the CPUs we tested was negligible. As these rates the differences would not even be noticed by the human eye. This test only confirms what we have said before CPU speed is not a major factor for high resolution gaming anymore.
FarCry 2
Version and / or Patch Used: V1.00
Timedemo or Level Used: Clearing the Safe house through to the Rescue
Developer Homepage: http://www.ubi.com
Product Homepage: http://farcry.us.ubi.com
Buy It Here
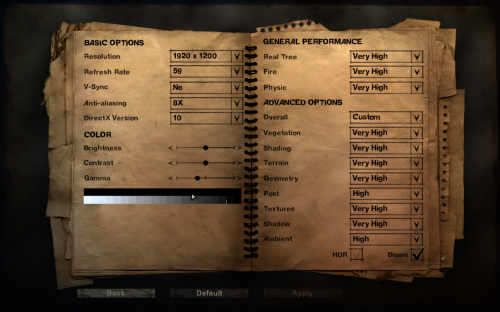
FarCry 2 is a large sandbox style game. There are no levels here so as you move about the island you are on you do not have to wait for the "loading" sign to go away. It is mission driven so each mission is what you would normally think of as the next "Level". In the game to take the role of a mercenary who has been sent to kill the Jackal, unfortunately your malaria kicks in and you end up being found by him. Long story short you become the errand boy for a local militia leader and run all over the island doing his bidding. Settings we used for testing are shown below.

We see the same thing with our FarCry 2 testing. In some cases the performance difference is less than one frame per second.
Final Thoughts
Over the last few weeks I have read both sides of the argument about Lynnfield.
The AMD fans are saying it is a last ditch effort by Intel to prevent AMD from stealing market share. On the other hand, the Intel fans are saying it is going to be the next big thing.
In reality it falls in with the latter, it is going to upset the playing field and force AMD to re-think their current market strategy. AMD can no longer say that dollar for dollar they have the better CPU. If the pricing is correct at $196.99 for 1k lots of the Core i5 750, then the AMD Phenom II X4 955 (which runs about the same price) is a comparably priced CPU that cannot keep up in CPU related tasks.
This will lure many people over to Lynnfield and the P55 Express chipset. It is just a simple matter of a powerful, well-priced CPU. Add in the great overclocking potential and the great performance scaling at higher speeds and you have a bargain with the Core i5 750.
However, the launch of Lynnfield has been a fiasco. With any CPU launch there are always leaks and NDA breakers. But this time it was worse. The CPUs and motherboards were on sale in many countries almost two weeks before today's official launch - even longer in Taiwan. This meant that many people have already bought them and tried them out. It also meant a large number of websites were releasing reviews way in advance.
Although I think this is a shame, I do not think it will affect sales of these two great processors from Intel.
The Core i5 750 is an incredible value and highly overclockable even on air. If the P55 boards are as inexpensive, I can see these flying off the shelves. AMD is going to have to work very hard to recover from this one.





 United
States: Find other tech and computer products like this
over at
  United
Kingdom: Find other tech and computer products like this
over at
  Australia:
Find other tech and computer products like this over at
  Canada:
Find other tech and computer products like this over at
  Deutschland:
Finde andere Technik- und Computerprodukte wie dieses auf