


Nintendo today published its 2017 Annual Report in English, highlighting various financial data and giving consumers, investors, and gamers a better look at the company's current market situation.
Nintendo's latest annual report is filled to the bring with interesting data. The brief chronicles Nintendo's performance across four different fiscal years in key metrics like net sales, operating income, total profits, profit per share, net assets, and more. FY17 was a successful year for the Kyoto-based console-maker, and the new Nintendo Switch handheld-console hybrid helped rally shares, net sales, and total profits to new heights. The Nintendo 3DS also did well throughout the year--to date the handheld has more than 66 million units sold.
I've prepared a series of graphs that illustrate Nintendo's year-over-year performance compared to three past fiscal years, and you can check them out below.
Total Profits Surge in FY17
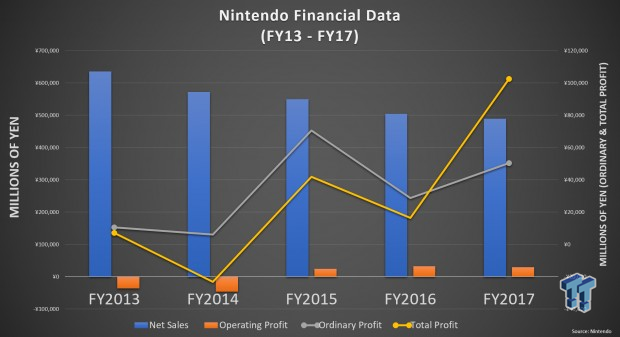
As we previously reported, Nintendo recorded a massive 521% increase in total profit games in FY2017 with 102.5 billion yen ($922.5 million) in profit attributed to parent (total profit gains), up over 500% from last year's 16.5 billion yen.
Both net sales and operating profit dropped 3.04% and 10.70% YoY respectively, however ordinary profit surged by 74% since FY16.
Nintendo FY17: Key Metrics At a Glance
- Net Sales - ¥489 billion ($4.35 billion), -3.04% YoY
- Operating Profits - ¥29.362 billion ($261.35 million) , -10.70% YoY
- Ordinary Profits - ¥50,364,000,000 ($448.3 million), +74.93% YoY
- Total Profits - ¥102.574 billion ($913 million), +521% YoY
- Total Assets - ¥1.46 trillion ($13.04 billion), +13.26% YoY
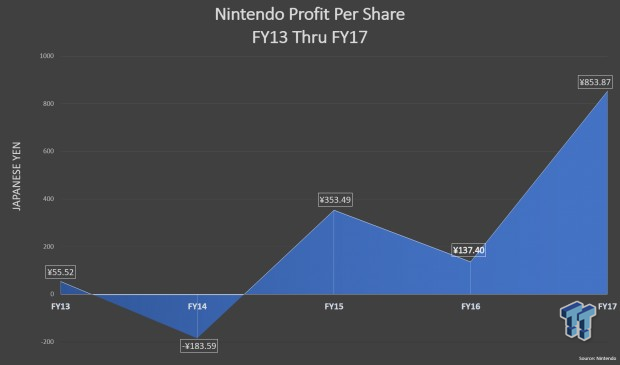
Profit Per Share
Nintendo's shares surged to their highest point in 8 years following the company's strong E3 2017 reveal, rallying to 38,440 JPY. Shortly after the Switch released on March 3, Nintendo shares started to climb, peaking at 27,405 JPY per share just before the fiscal year cut off.
Total profit per share spiked by a tremendous 853.87 JPY per share in Nintendo's FY17, largely due to the release and reception of Pokemon GO in July 2016 as well as the huge reception of the Nintendo Switch in March 2017. Remember, Nintendo's FY2017 was held from April 1, 2016 thru March 31, 2017.
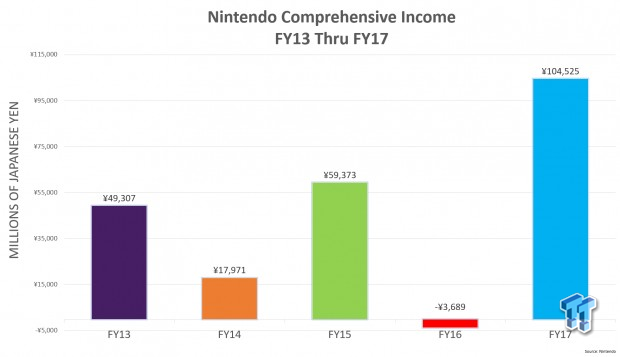
Comprehensive Income
Total comprehensive income for FY17 shot up to ¥104.52 billion from Nintendo's disastrous ¥3 billion comprehensive income loss filed in its FY16 due to flagging Wii U sales.
Nintendo has dramatically turned this around with a strong integrated hardware business replete with a wide variety of software, alongside savvy business investments and an ever-growing share price.
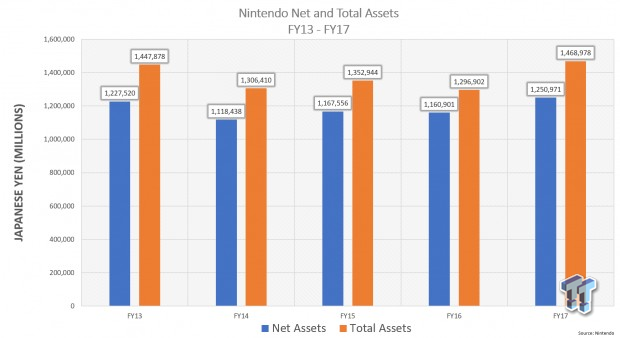
Assets
Throughout the Fiscal Year ended March 2017 Nintendo accrued more assets such as total cash, securities, trade receivables, etc. The biggest asset boost was cash and deposits, which accounted for ¥662,763 billion ($5.8 billion) of total assets, up 16% year-over-year.
A quick overview reveals net assets for FY17 are up 7.75% year-over-year, and total assets are up 13.26% year over year, from ¥1.29 trillion ($11.5 billion) in FY16 to ¥1.46 trillion ($13.04 billion).
 Nintendo drops annual forecast -22%, now expects to sell millions less games and hardware
 Nintendo president says tariffs will drop profits by tens of billions of yen
 Switch 2 is less profitable than Switch 1, Nintendo confirms
 Nintendo moves into new less profitable console generation with boosted Switch 2 sales and restricted margins
 Nintendo R&D spending hits record high amid looming Switch 2 launch
 Apple's first touchscreen MacBook Pro is '100% confirmed', leaker says
 AMD reversed a warranty rejection for a swollen Ryzen 9 7950X3D after Hardware Unboxed called it out publicly
 ASUS' $50 ROG Equalizer cable meant to stop GPU connector burns reportedly burns itself
 Intel's 18-core Core Ultra 7 251HX is matching its 20-core siblings in early PassMark results
 Elon Musk is the world's first trillionaire - enough to spend $1 million a day for nearly 3,000 years
 Anthropic's latest AI model 'Fable' was so powerful the US government banned the world from it
 Xbox prioritizes Elder Scrolls VI, Fallout, and Halo in new strategy shift
 Xbox exec wants to use ads to open up new access points, not just to collect money
 Redditor buys RTX 2080 Ti Super engineering sample on eBay, has the same number of cores as an RTX Titan but half the VRAM
 Report: Xbox may be spun off into subsidiary or joint venture with another company
 MOAIPLAY ORA PRO G1 850W ATX 3.1 PSU Review: high efficiency and 10-year warranty for $119.99
 Navman MiVue Smart True 4K Surround Dashcam Review - Seeing In All Directions At Once
 IQUNIX Magi96 Pro Aluminum Low Profile Mechanical Keyboard Review - Premium Build, Satisfying Sound
 Asetek Forte S-Series Racing Simulator Bundle Review
 Razer Pro Type Ergo Wireless Split Ergonomic Keyboard Review - Built for Comfort and Support
 ASUS ROG Strix Morph 96 Wireless Gaming Keyboard Review - Great Performance, More Affordable
 SAPPHIRE Radeon RX 9070 GRE PULSE OC Review - A New 1440p Challenger Has Arrived
 NZXT H6 RGB+ Compact Dual-Chamber Chassis Review
 ASRock Radeon RX 9070 GRE Steel Legend Review - The RDNA 4 Mid-Range Reshuffle
 ASRock Z890 Taichi Aqua Motherboard Review - Flagship features without the flagship price
 This Windows security feature protects Documents from ransomware, but it is off by default
 Windows 11 already has a voice typing tool, and it is the one most people are not using
 Quick Assist is the only remote-support tool I open when a relative calls about their PC
 The PowerToys utilities I keep enabled on every Windows 11 PC, and the ones I turned off within a week
 TweakTown's Best of Computex 2026 Awards - The Best Hardware, Gaming Gear, and AI
 Phison E37T SSD Controller Exclusive Preview - The Fastest DRAMless SSD Platform Yet
 USB Ports Not Working in Windows 11? Try These Fixes
 ASUS WiFi Routers and Networking Solutions Deliver Long-term Security and Reliability with No Additional Cost
 Second Monitor Not Detected in Windows 11? Try These Fixes
 Turn Your Old Smartphone Into a Dedicated Webcam for Your Windows PC