Introduction
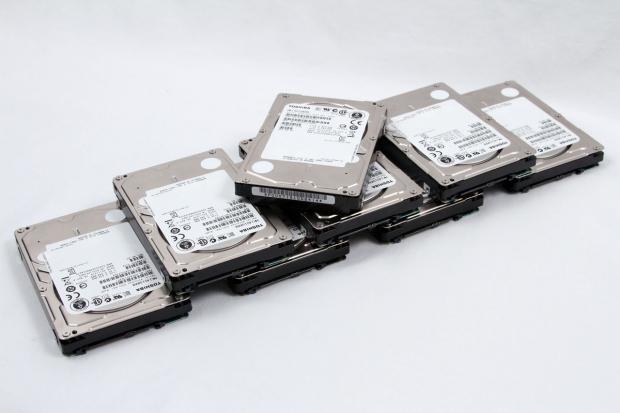
The migration to slimmer servers has touched off an intense need to provide the most performance in the smallest package possible for all components deployed into the datacenter environment. Toshiba MK01GRRB/R hard disk drives provide the ability to place a relatively high amount of storage, up to 300GB, into a small 2.5" form factor.
We are witnessing a revolution in server design, with the focus changing to power sipping drives that deliver high performance. Many small form-factor server racks offer a limited number of drive bays, so the full utilization of the direct attached storage is necessary.
We originally tested the MK01GRRB/R as a single drive, and its excellent performance led us to choose this as the HDD to utilize as our base array for several caching solutions we are currently testing.
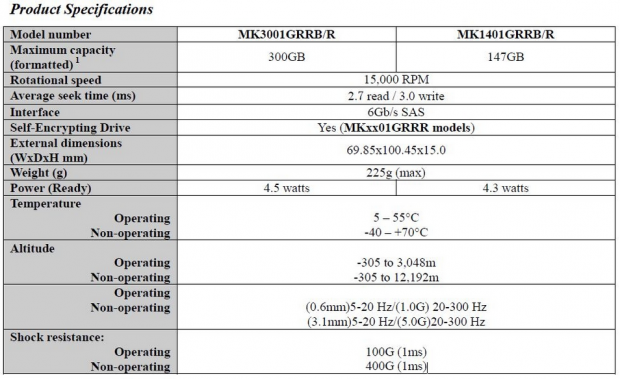
The MK01GRRB/R operates at 15,000 RPM, delivering a good combination of speed, capacity and agility. This series of HDDs also includes models that have integrated encryption that does not adversely affect performance.
The Toshiba HDDs come in a 2.5" form factor with a 15mm Z-Height. These HDDs also feature a 6Gb/s SAS connection to provide enterprise class features such as multipath and failover. SAS is known for its High Availability features and is a great fit for enterprise applications.
[img]2[/img]These HDDs are typically deployed in parity RAID configurations in large numbers. Performance variability from HDDs can lead to uneven performance in RAID scenarios, as the configuration is constrained to the slowest I/O from any device. Groups of HDDs that suffer poor maximum latency will effectively function at the maximum latency received from any individual drive.
This places the focus on consistent performance for better performance in RAID arrays. Today we will test eight Toshiba MK01GRRB/R drives in a RAID 5 configuration with arrays of 3, 5 and 8 drives. This testing will focus on spotting performance variability and the scaling of the solution employed.
Specifications, Test Bench and Methodology
Test Bench and Methodology
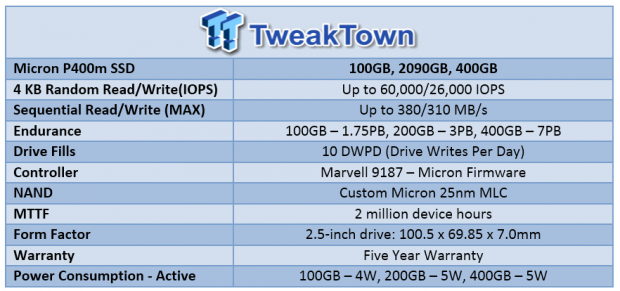
We utilize a new approach to HDD and SSD storage testing for our Enterprise Test Bench, designed specifically to target the performance of HDDs with a high level of granularity.
The Toshiba HDDs are tested in RAID 5 on a LSI 9265-8i controller. We use a 256K stripe with no read ahead and direct I/O.
Many forms of testing involve utilizing peak and average measurements over a given time period. While these average values can give a basic understanding of the performance of the storage solution, they fall short in providing the clearest view possible of the QOS (Quality Of Service) of the I/O.
'Average' results do little to indicate the performance variability experienced during the actual deployment of the device. The degree of variability is especially pertinent, as many applications can hang or lag as they wait for one I/O to complete. This type of testing illustrates the performance variability expected in these types of scenarios, including the average measurements, during the measurement window.
In reality, while under load all storage solutions deliver variable levels of performance that are subject to constant change. While this fluctuation is normal, the degree of fluctuation is what separates enterprise storage solutions from typical client-side hardware. By providing ongoing measurements from our workloads with one-second reporting intervals, we can illustrate the difference between different products in relation to the purity of the QOS. By utilizing scatter charts readers can gain a basic understanding of the latency distribution of the I/O stream without directly observing numerous graphs.
Consistent latency is the goal of every storage solution, and measurements such as Maximum Latency only illuminate the single longest I/O received during testing. This can be misleading, as a single 'outlying I/O' can skew the view of an otherwise superb solution. Standard Deviation measurements take the average distribution of the I/O into consideration, but do not always effectively illustrate the entire I/O distribution with enough granularity to provide a clear picture of system performance.
We only test below QD32 to illustrate the scaling of the device. However, low QD testing with enterprise-class storage solutions is a frivolous activity if not presented with higher QD results as well. The explosion of virtualization into the datacenter places focus on the high QD performance of the storage solution as the most important metric.
The first page of results will provide the 'key' to understanding and interpreting our new test methodology.
Specifications
4K Random Read/Write
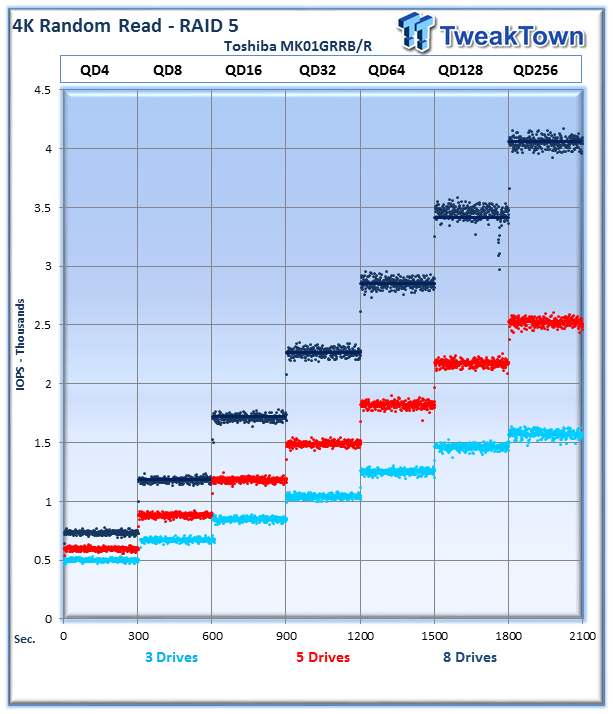
Each QD for every parameter tested includes 300 data points (five minutes of one second reports) to illustrate the degree of performance variability. The line for each QD represents the average speed reported during the five-minute interval.
4K random speed measurements are an important metric when comparing drive performance, as the hardest type of file access for any storage solution to master is small-file random. One of the most sought-after performance specifications, 4K random performance is a heavily marketed figure.
The read performance scales well, with a nice tight distribution of performance. We can observe that the 8-drive configuration averages 4,100 IOPS, the 5 drive 2,500 IOPS and the 3-drive configuration averages 1,600 IOPS.
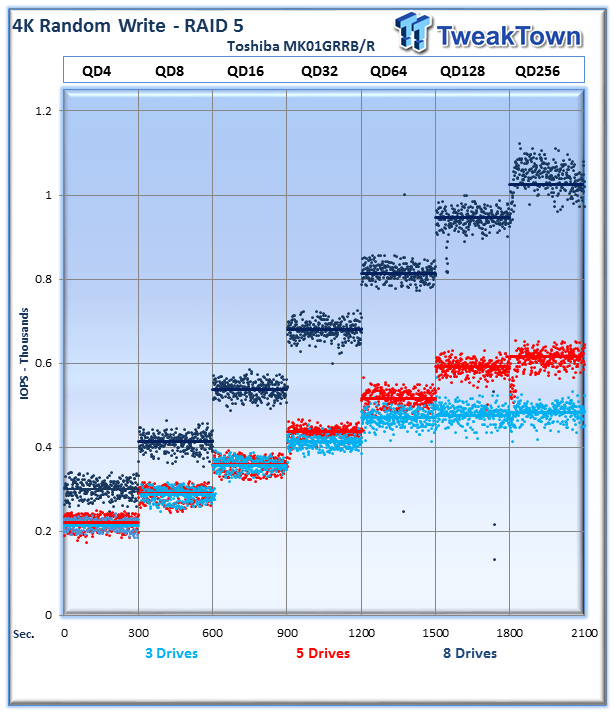
The 8-drive configuration, in dark blue, dominates the write testing. The 3 and 5 drive raidsets perform well, but do not scale as well at the lower queue depths. The 8-drive configuration tops out at an average of 1053 IOPS at QD 256, 5 drives come in at 600 IOPS, and the 3 drive musters 511 IOPS.
8K Random Read/Write
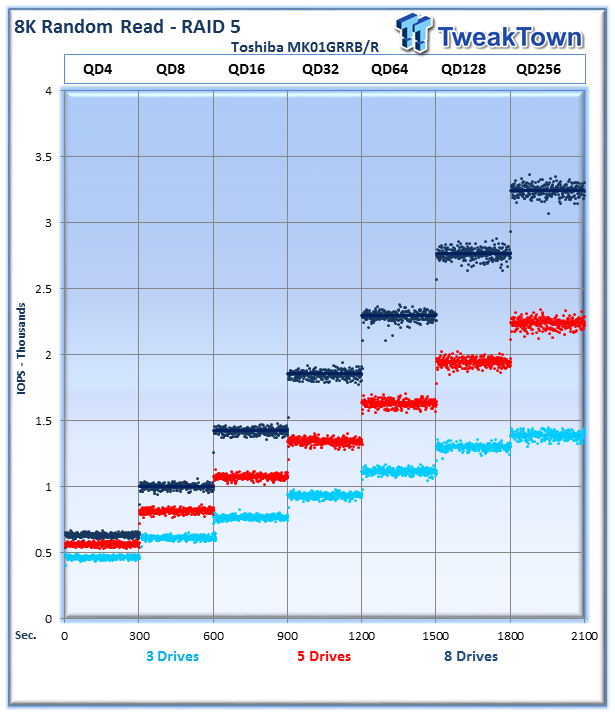
8K random read and write speed is a metric that is not tested for consumer use, but for enterprise environments this is an important aspect of performance. With several different workloads relying heavily upon 8K performance, we include this as a standard with each evaluation. Many of our Server Emulations will also test 8K performance with various mixed read/write workloads.
The Toshiba MK01GRRB/R drives perform well, with a nice linear scaling of performance in this commonly utilized file size. We can see the 8-drive configuration topping out at 3,200 IOPS on average at QD256, the 5-drive sets at 2,285 average IOPS and the 3-drive setup provides 1404 IOPS.
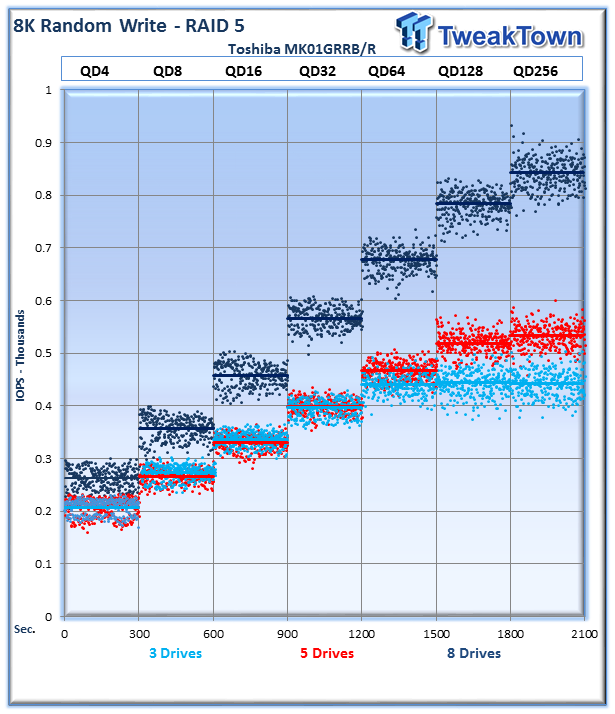
The 8K random write workloads exhibit much of the same characteristics of the 4K testing, with a bit of variability at the upper end. The 8-drive combination achieves average speeds of 824 IOPS at QD256, the 5 drives score 551 IOPS and the 3 drives score 450 IOPS.
128K Sequential Read/Write
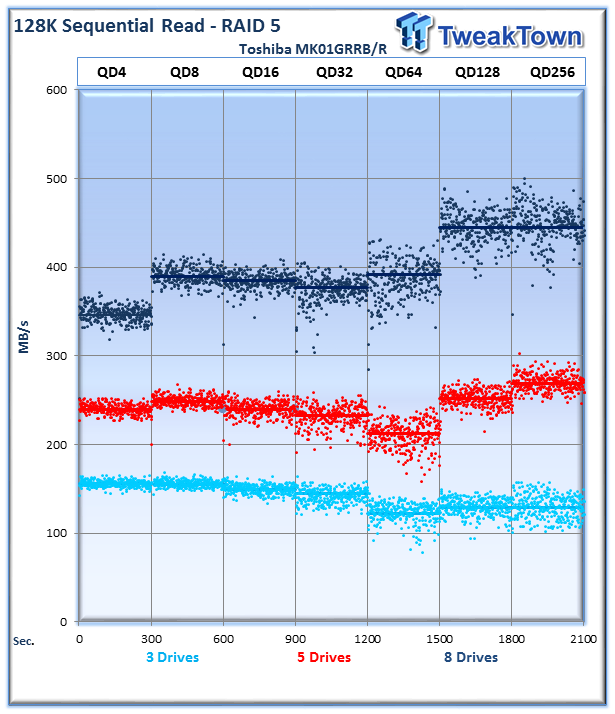
The 128K sequential speeds reflect the maximum sequential throughput of the SSD using a realistic file size actually encountered in an enterprise scenario. One area that HDDs continue to provide performance that is competitive with SSDs is with sequential access.
The RAID 5 provides relatively consistent high read speed across the gamut of queue depths. The 8-drive array averages 454MB/s at QD256, the 5 drives provide 280MB/s and the 3 drives score 119MB/s.
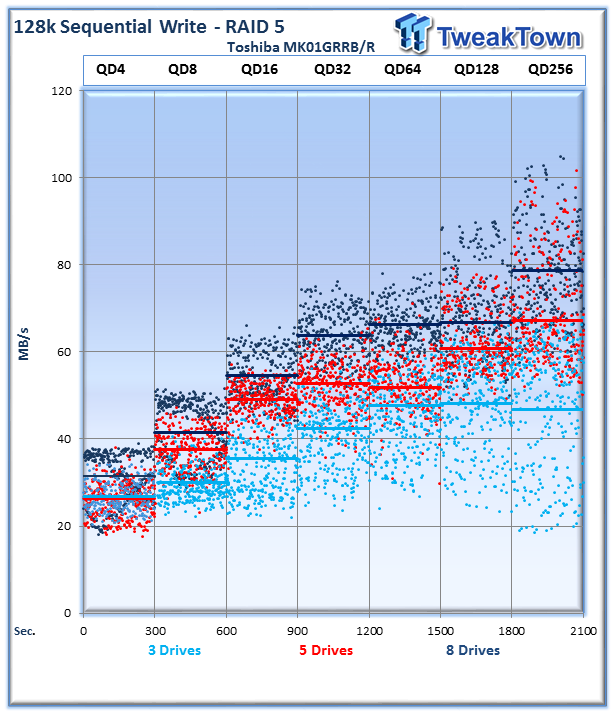
The write speeds exhibit more variability, which is likely partially due to the RAID code overhead. RAID incurs serious penalties in write performance, and here we can observe it significantly affecting the speed of the HDDs.
The 8-drive array provides 81MB/s at QD256, the 5-drive array provides 68MB/s, and the 3-drive array averages 50MB/s.
OLTP, Webserver and Workstation
OLTP
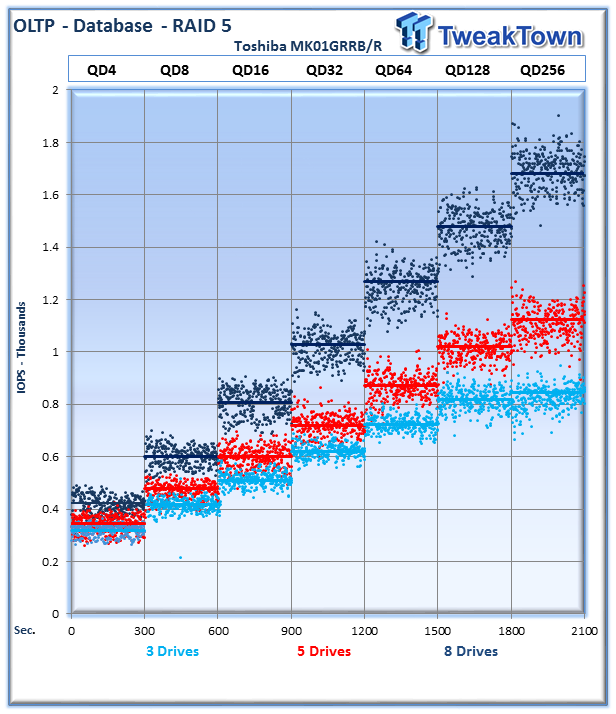
This test emulates Database and On-Line Transaction Processing (OLTP) workloads. OLTP is in essence the processing of transactions such as credit cards and high frequency trading in the financial sector. Enterprise SSDs are uniquely well suited for the financial sector with their low latency and high random workload performance. Databases are the bread and butter of many enterprise deployments. These are demanding 8K random workloads with a 66% read and 33% write distribution that can bring even the highest performing solutions down to earth.
The HDDs perform very well at this mixed read/write workload, providing a tight range of performance. The 8-drive array averages 1,720 IOPS at QD256, the 5 drives average 1,162 IOPS and the 3 drives come in at 884 IOPS.
Webserver
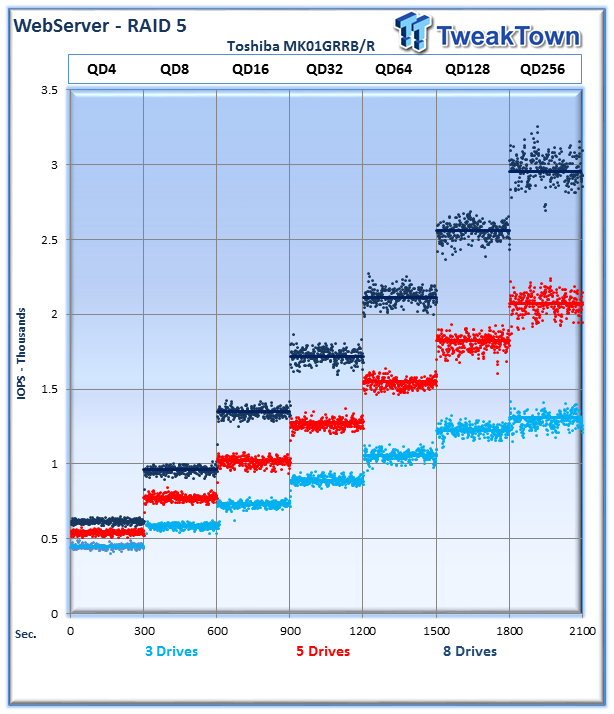
The Webserver profile is a read-only test with a wide range of file sizes. Web servers are responsible for generating content for users to view over the internet, much like the very page you are reading. The speed of the underlying storage system has a massive impact on the speed and responsiveness of the server that is hosting the websites, and thus the end user experience.
The 8-drive array averages just shy of 3,000 IOPS at QD256, the 5-drive array averages 2,144 IOPS and the 3-drive array averages 1,309 IOPS.
Workstation
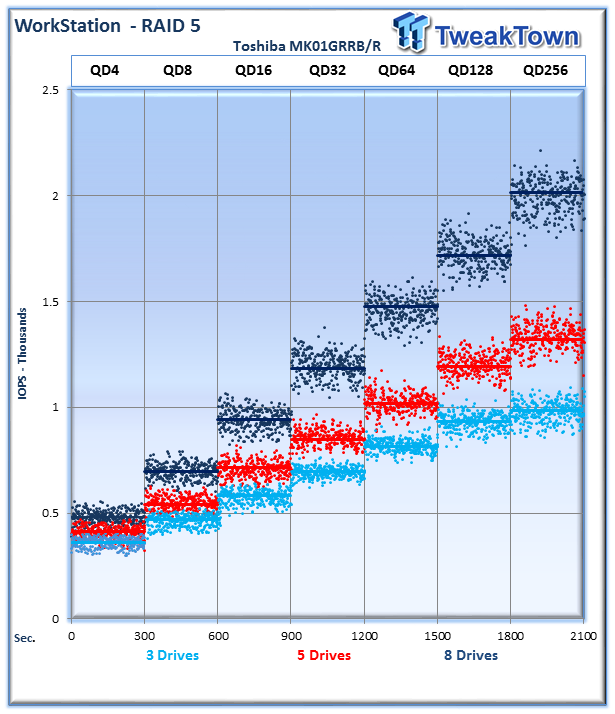
The Workstation profile emulates the usage patterns of a storage system on a typical user's workstation. This would be the closest to an actual operating system pattern that a user would experience on their desktop. This test is comprised of 8K random access with an 80% read and 20% write distribution.
The 8-drive array averages 2,049 IOPS at QD256, the 5-drive array averages 1,355 IOPS and the 3-drive array provides 980 IOPS.
Fileserver and Emailserver
Fileserver
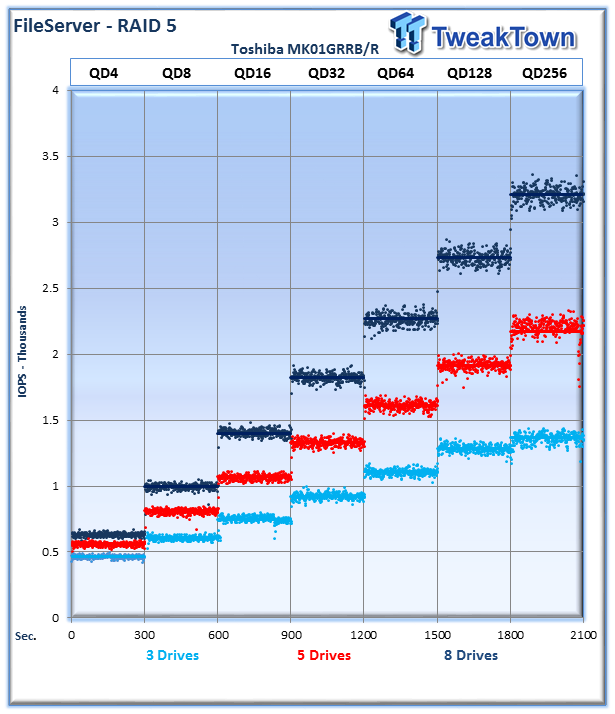
The File Server profile represents typical file server workloads. This profile tests a wide variety of different file sizes simultaneously, with an 80% read and 20% write distribution.
8 drives averages 3,200 IOPS at QD256, 5 drives provide 2,150 IOPS and 3 drives weigh in at 1,430 IOPS.
Emailserver
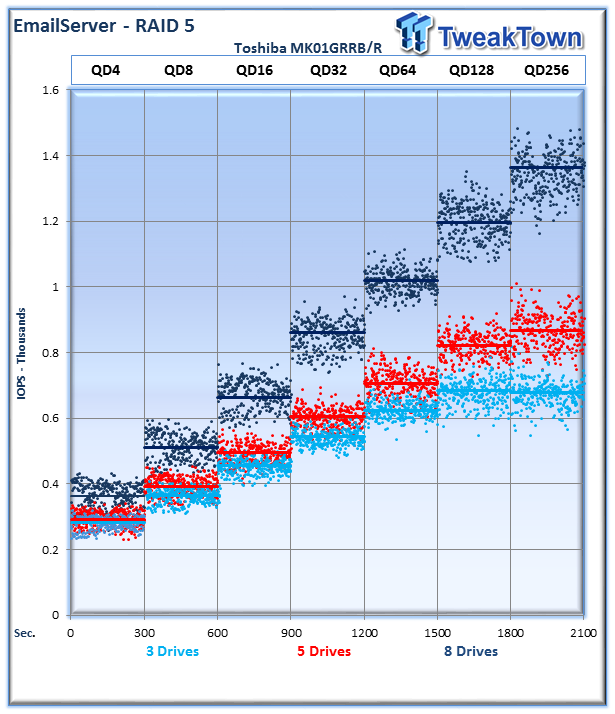
The Emailserver profile is very demanding 8K test with a 50% read and 50% write distribution. This application is indicative of the performance of the solution in heavy write workloads.
This heavy mixed read/write workload exhibits the more variability than the other tests. The 8-drive array provides an average of 1,350 IOPS at QD256, the 5-drive array provides 898 IOPS and the 3-drive array provides 713 IOPS.
Final Thoughts
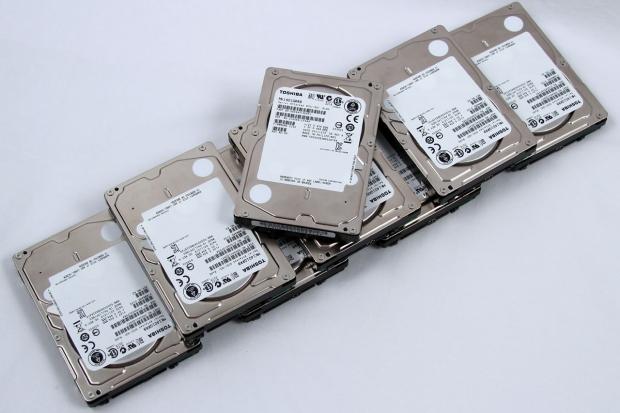
The performance of the different arrays that we tested with the Toshiba MK01GRRB/R drives exhibited expected scaling and consistent performance. The 15K 2.5" HDDs provide great performance in comparison with other drives and have many other benefits.
The increased performance density from these HDDs help to decrease power and cooling costs, and also eases the requirements for larger bulky HDDs. Space in the datacenter is at a premium, and with smaller racks becoming commonplace in all new installations, these types of solutions are in dire need.
SSDs have begun to challenge the 2.5" HDD market, but retain a higher price premium per GB. SSDs tend to command up to eight times the cost of a comparable 2.5" 15K HDD, relegating them to caching and tiering models in the majority of deployments.
While the uptake of MLC SSDs is hastening the conversion to SSDs, it must be taken into consideration that SSDs still only comprise 3% of the overall storage capacity in datacenters worldwide. The pace of data creation, and thus the need for storage, is exploding. Current estimates predict that the amount of stored data worldwide is doubling every two years.
SSDs can also require significant changes in the infrastructure of the deployment, with faster backplanes needed to capitalize on the increased speed. For existing infrastructure, SSDs aren't always the best option, and when more speed is required, 15K HDDs can fill the role.
The benefits over larger HDDs are very clear, with up to a 33% reduction in overall power consumption and tremendous gains in speed. The increasing use of caching and tiering provides an excellent application for these types of HDDs. Even in highly random workloads, 15K HDDs can provide significant performance increases.
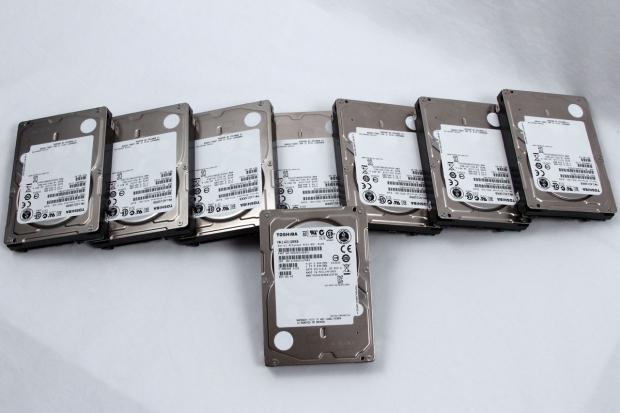
Overall the Toshiba MK01GRRB/R series is a great fit for those looking for high performance HDD's. We have been utilizing them with our tests of caching software and they provide the consistent performance required for our baseline results. As we move further with extended HDD testing from other vendors, the MK01GRRB/R series will set the bar against which others will be measured.

 United
States: Find other tech and computer products like this
over at
  United
Kingdom: Find other tech and computer products like this
over at
  Australia:
Find other tech and computer products like this over at
  Canada:
Find other tech and computer products like this over at
  Deutschland:
Finde andere Technik- und Computerprodukte wie dieses auf