


Our Verdict
Introduction, Drive Specifications, Pricing and Availability
My Digital Discount's newest SSD affords us our first look at Toshiba's 15nm TLC toggle flash. Lately, we've been inundated with TLC based drives and with the exception of Samsung's 850 EVO, they have all been a disappointment. So far, we've seen 16nm Hynix TLC flash, Micron 16nm TLC flash, and Toshiba A19nm TLC Flash. Both Hynix and Micron's TLC flash have proven to be big disappointments, topping out at barely 100 MB/s sustained write speeds which is slower than most traditional rotating platter HDDs. Even A19nm Toshiba TLC flash as served up by OCZ's Trion 100 has been a disappointment.
SSD manufacturers are looking to TLC (Triple Level Cell) flash to further decrease cost and at the same time boost capacity. Other than abysmal sustained write speeds, the main issue with most TLC-based SSDs continues to be cost. Typically, this new wave of TLC-based SSDs have not been priced competitively in comparison to value-centric MLC-based SSDs. They are a little lower in price, but when you factor in performance, not low enough for someone to choose a TLC based drive over a low-cost drive with an MLC (Multi Level Cell) flash array.
Today's TLC SSDs all have one thing in common, a pseudo-SLC (Single Level Cell) caching layer and the BP5e is no different. The 480GB drive we have on the bench has 8.4GB of its flash array programmed as an SLC cache. An SLC caching layer is designed to mask the TLC flash array's write performance. As long as writes fall within the capacity of this layer, they can be executed at up to 540MB/s sequential write speed. Transfers that exceed 8GB are written directly to the drive's TLC array at reduced speeds, and this is where we typically find current TLC SSDs (850 EVO excluded) writing at about 100 MB/s with our transfer testing. The BP5e has a flash array and a firmware revision for its Phison S10 controller that we have not tested before and may deliver better-sustained write performance; at least, that is what we are hoping for.
Does the BP5e 480GB TLC SSD perform well enough to be considered a viable alternative to the 850 EVO? Let's take a look.
The My Digital BP5e 480GB SSD ships as a bare drive, no value add's are included. My Digital's 480GB SATA III 2.5"x 7mm SSD is currently retailing for $124.99 at Amazon. At 26 cents per gigabyte, this is the lowest per GB cost we've seen for any SSD to date.
Specifications
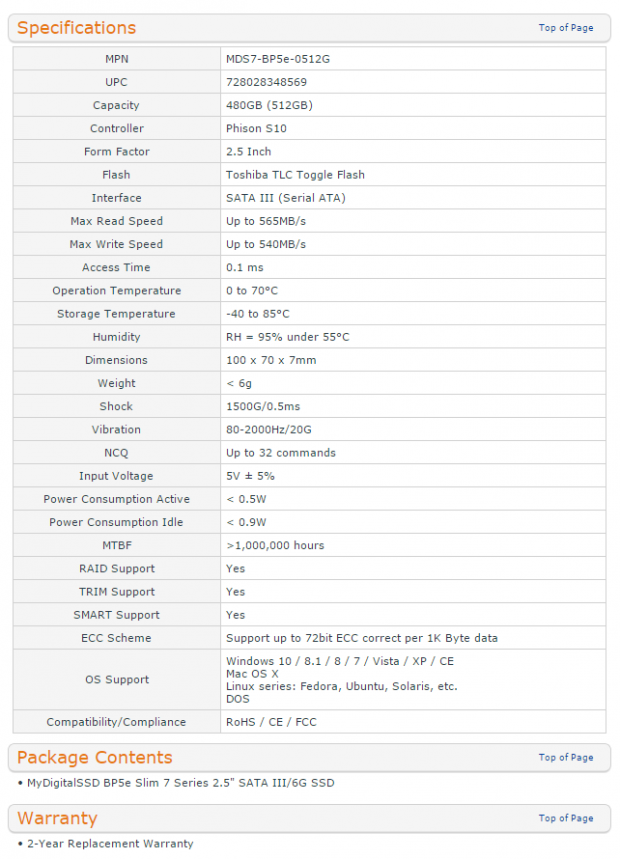
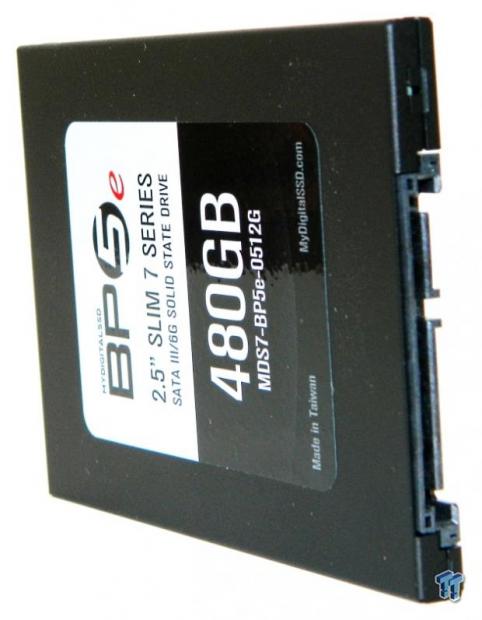
The My Digital (Bullet Proof) BP5e SATA III 2.5" x 7mm FF SSD is available in three capacities: 240GB, 480GB, and 960GB. Performance for the 480GB capacity we have on the bench is listed at up to 565 MB/s sequential read, 540 MB/s sequential write. Random performance is not given. MDD backs the BP5e with a standard three year limited warranty. No TBW (Total Bytes Written) limit is given or implied. However, we contacted Phison, and they told us that the 480GB BP5e should have a TBW of 160TB.
Drive Details
MDD BP5e 480GB SATA III SSD
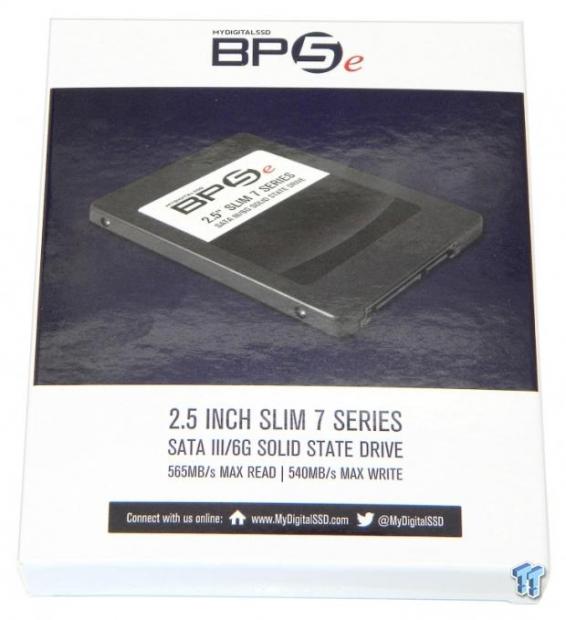
The BP5e retails in white and purple colored packaging. The front of the box features an image of the enclosed drive. Capacity, interface, and sequential speeds are listed as well.
Our Latest SSD Review Coverage
- Samsung 990 2TB SSD Review - Ninth Gen QLC at PCIe Gen4 Speeds
- Phison E37T SSD Controller Exclusive Preview - The Fastest DRAMless SSD Platform Yet
- Seagate FireCuda X1070 4TB SSD Review - A New Mainstream Contender
- Micron 3610 2TB SSD Review - DRAMless QLC at 11,000 MB/s
- SK hynix Platinum P51 2TB SSD Review - A Powerful Gen5 Alternative
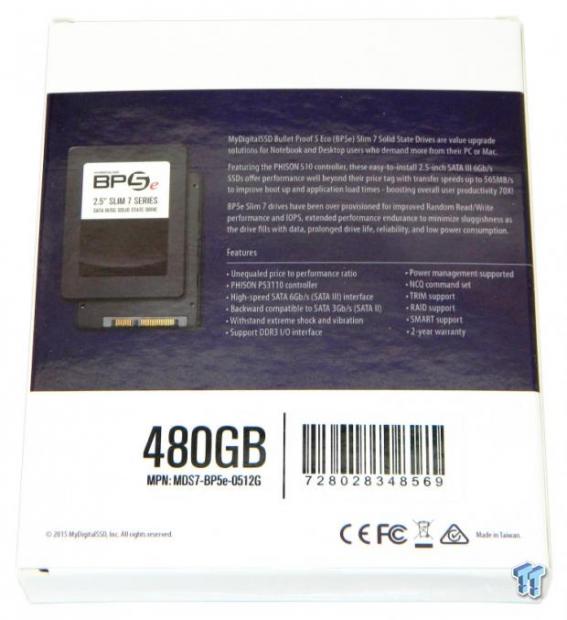
The rear of the packaging lists the drive's 2.5" x 7mm form factor, SATA 6Gb/s interface and various other features.
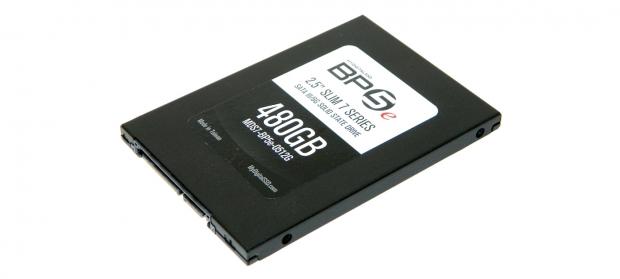
Contained within the packaging is the drive itself, nothing more.
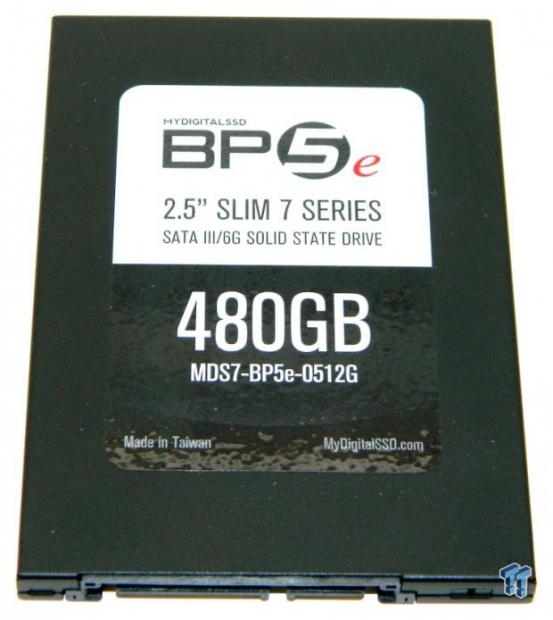
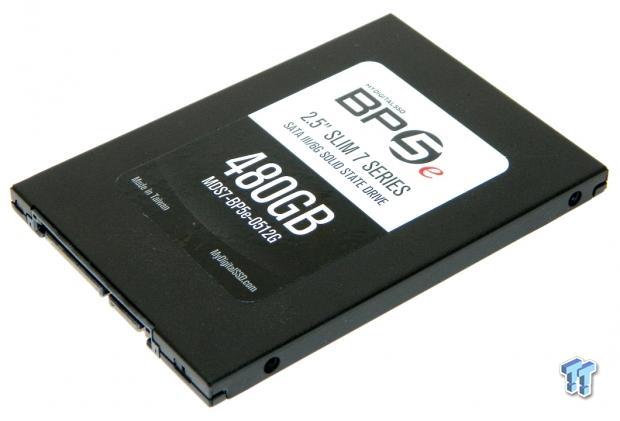
The front of the drive's black colored aluminum enclosure features an attractive manufacturer's label.
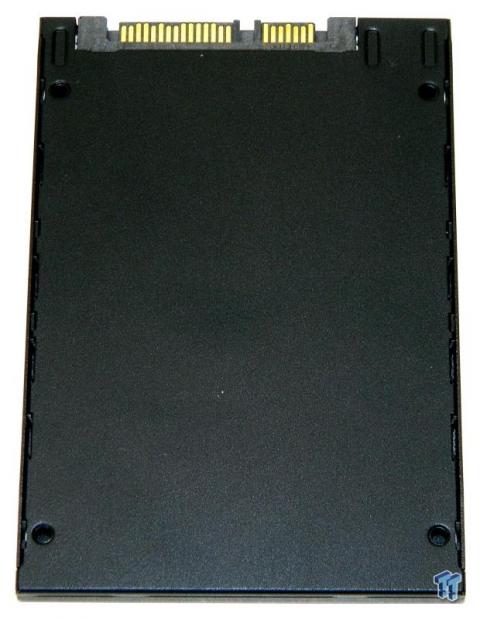
The back half of the drive's aluminum enclosure has no labeling.
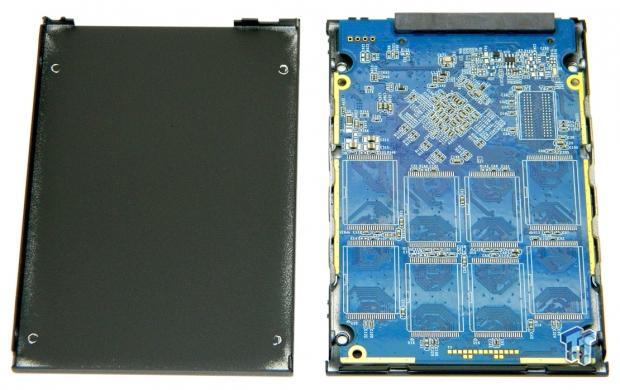
The drive's full-length PCB snaps into place. The entire enclosure is a screw-less design that snaps together.
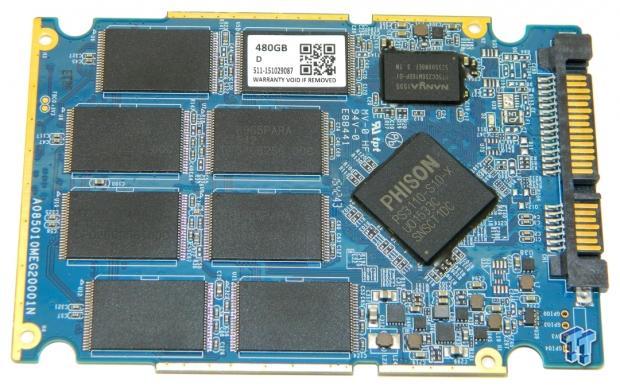
The drive's Phison PS3110 (S10) controller, eight flash packages, and DRAM cache package are located on this side of the full-length PCB.
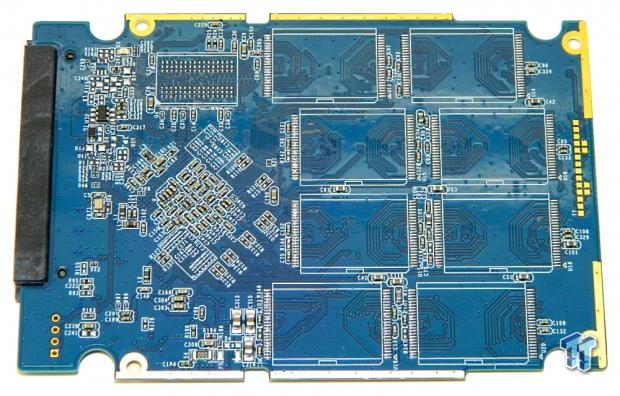
The 480GB model we are testing has no additional flash packages or any other major components on this side of the PCB.
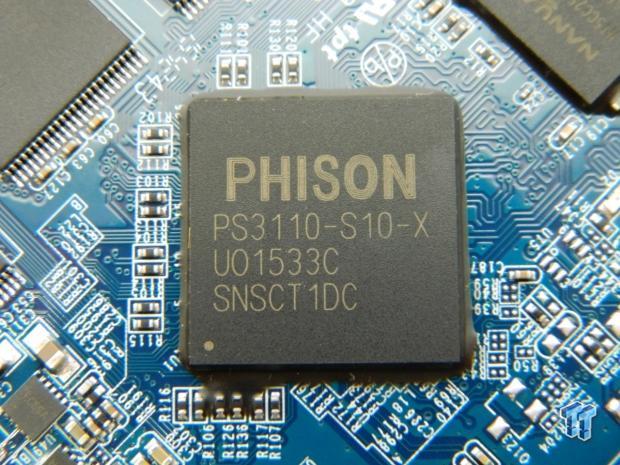
A close-in view of the 8-channel Phison S10 controller that powers the BP5e.
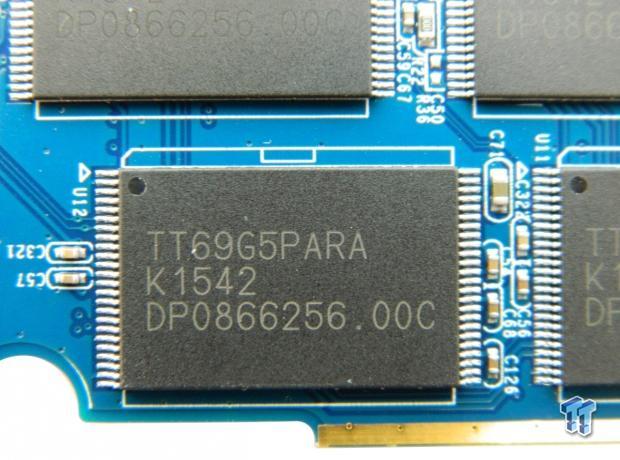
A close-in view of the drive's 15nm TLC flash packages.
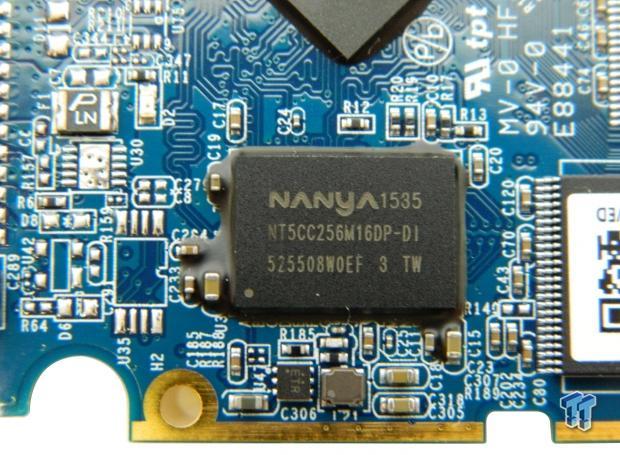
A close-in view of the drive's 512MB DDR3 DRAM cache package.
Test System Setup and Properties
Jon's Consumer SSD Review Test System Specifications
- Motherboard: ASRock Extreme9 Z97 - Buy from Amazon
- CPU: Intel Core i7 4790K @ 4.8GHz - Buy from Amazon / Read our review
- Cooler: Swiftech H2O-320 Edge - Buy from Amazon / Read our review
- Memory: Corsair Dominator DDR3 32GB 2400MHz - Buy from Amazon
- Video Card: Onboard Video
- Case: IN WIN X-Frame - Buy from Amazon / Read our review
- Power Supply: Seasonic Platinum 1000 Watt Modular - Buy from Amazon / Read our review
- OS: Microsoft Windows 10 Professional 64-bit - Buy from Amazon
- Drivers: Intel RAID option ROM version 13.0.0.2075 and Intel RST driver version 13.6.0.1002
We would like to thank ASRock, Crucial, Intel, Corsair, RamCity, IN WIN, and Seasonic for making our test system possible.
Drive Properties
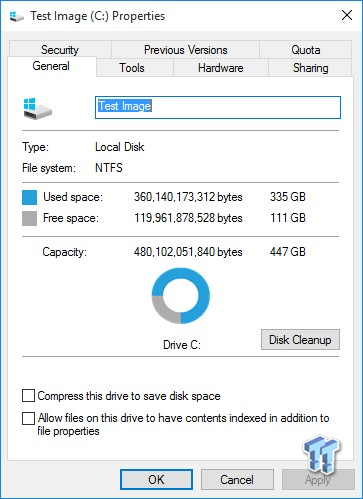
The majority of our testing is performed with our test drive as our boot volume. Our boot volume is 75% full for all OS Disk "C" drive testing to replicate a typical consumer OS volume implementation. We feel that most of you will be utilizing your SSDs for your boot volume and that presenting you with results from an OS volume is more relevant than presenting you with empty secondary volume results.
System settings: Cstates and Speed stepping are both disabled in our systems BIOS. Windows High-Performance power plan is enabled. Windows write caching is enabled, and Windows buffer flushing is disabled. We are utilizing Windows 10 Pro 64-bit OS for all of our testing except for our MOP (Maxed-Out Performance) benchmarks where we switch to Windows Server 2008 R2 64-bit.
Synthetic Benchmarks - ATTO & Anvil Storage Utilities
ATTO
Version and / or Patch Used: 2.47
ATTO is a timeless benchmark used to provide manufacturers with data used for marketing storage products.
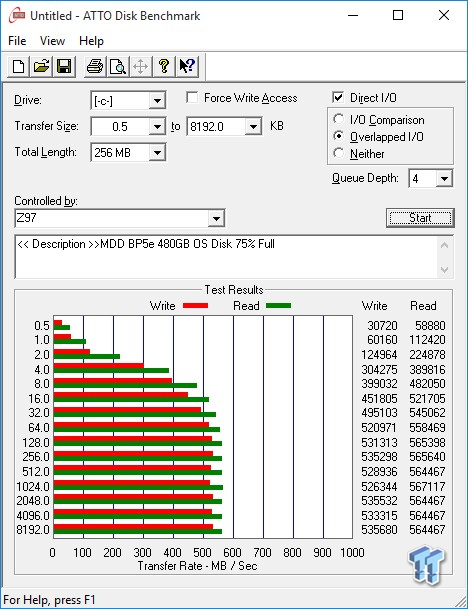
Sequential read/write transfers max out at 567/535 MB/s. Keep in mind this is our OS volume 75% full. We observe a nice ascending pattern, without any major dips like we have seen so often from a majority of planar TLC drives.
Sequential Write
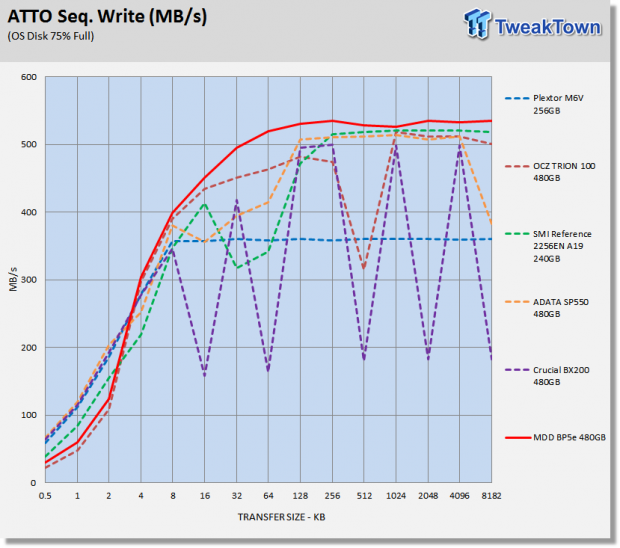
The BP5e easily beats out the rest of the drives in our test pool.
Sequential Read
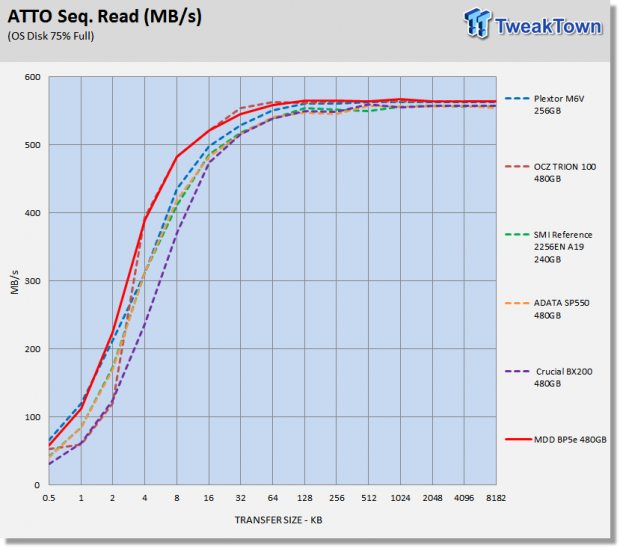
The BP5e and the TRION, are very similar drives in terms of hardware, but the BP5e has better low-end performance; overall another win for the BP5e.
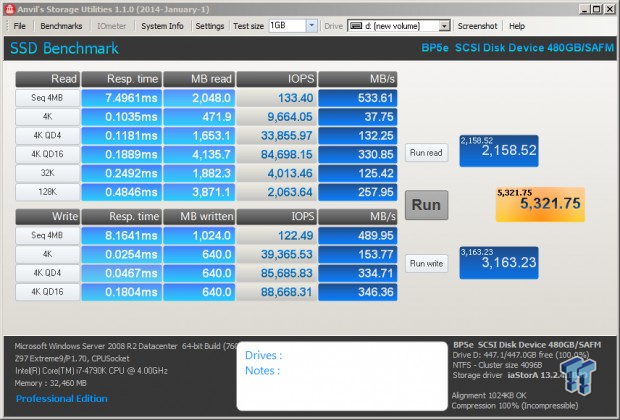
Anvil Storage Utilities
Version and / or Patch Used: 1.1.0
Anvil's Storage Utilities is a storage benchmark designed to measure the storage performance of SSDs. The Standard Storage Benchmark performs a series of tests; you can run a full test or just the read or write test, or you can run a single test, i.e. 4k QD16.
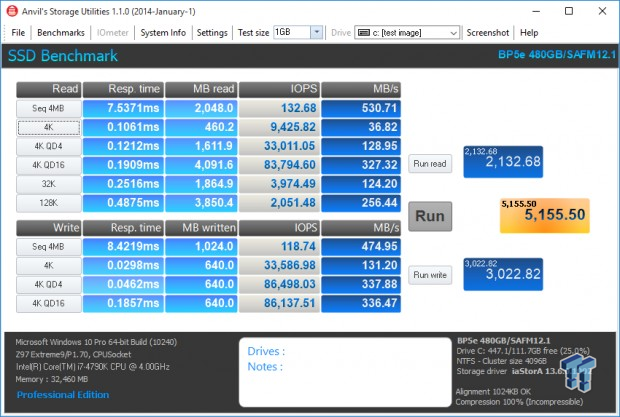
Scoring
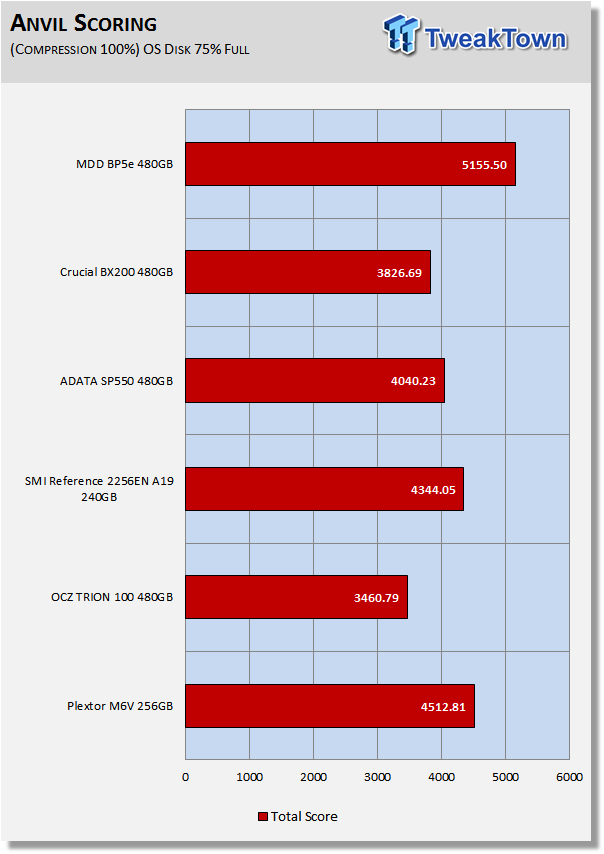
Anvil's scoring gives a good indication of a drive's overall performance. MDD got something right with the BP5e because it performs far better than its competition.
(Anvil) Read IOPS through Queue Depth Scale
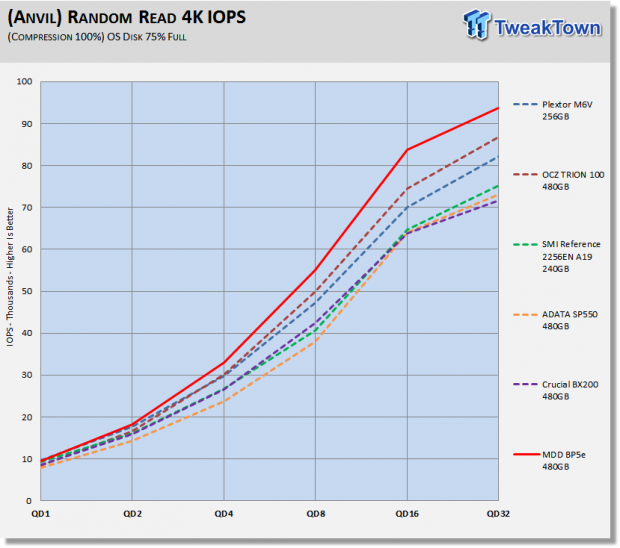
The BP5e is delivering 93,000 IOPS, easily surpassing OCZ's TRION 100, and leading all of the drives in our test pool from start to finish.
(Anvil) Write IOPS through Queue Scale
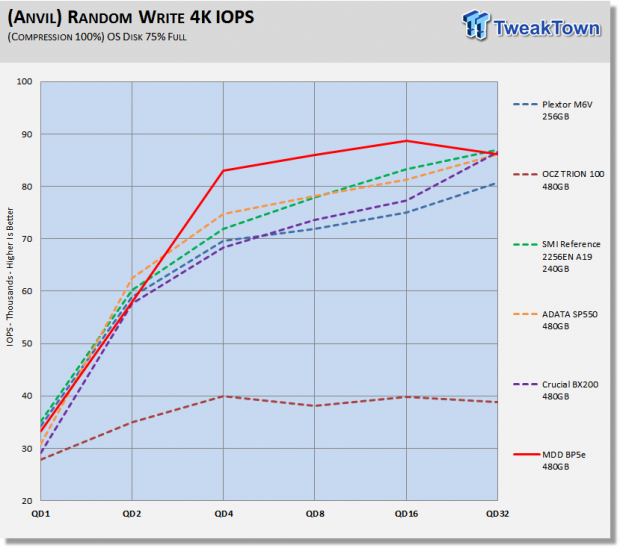
Despite very similar components, the BP5e delivers more than double the performance of OCZ's TRION 100. Again, the BP5e provides the best performance of the drives in our test pool.
Synthetic Benchmarks - CrystalDiskMark & AS SSD
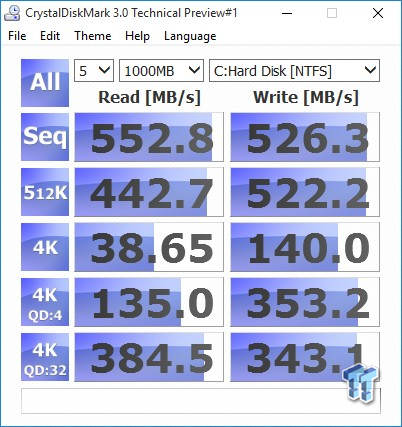
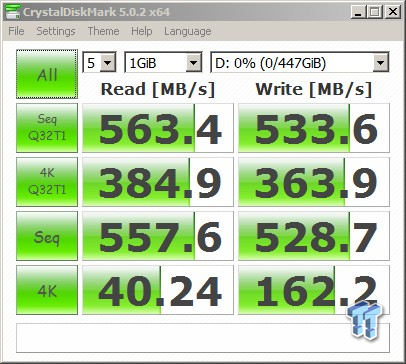
CrystalDiskMark
Version and / or Patch Used: 3.0 Technical Preview
CrystalDiskMark is disk benchmark software that allows us to benchmark 4k and 4k queue depths with accuracy. Note: Crystal Disk Mark 3.0 Technical Preview was used for these tests since it offers the ability to measure native command queuing at QD4.
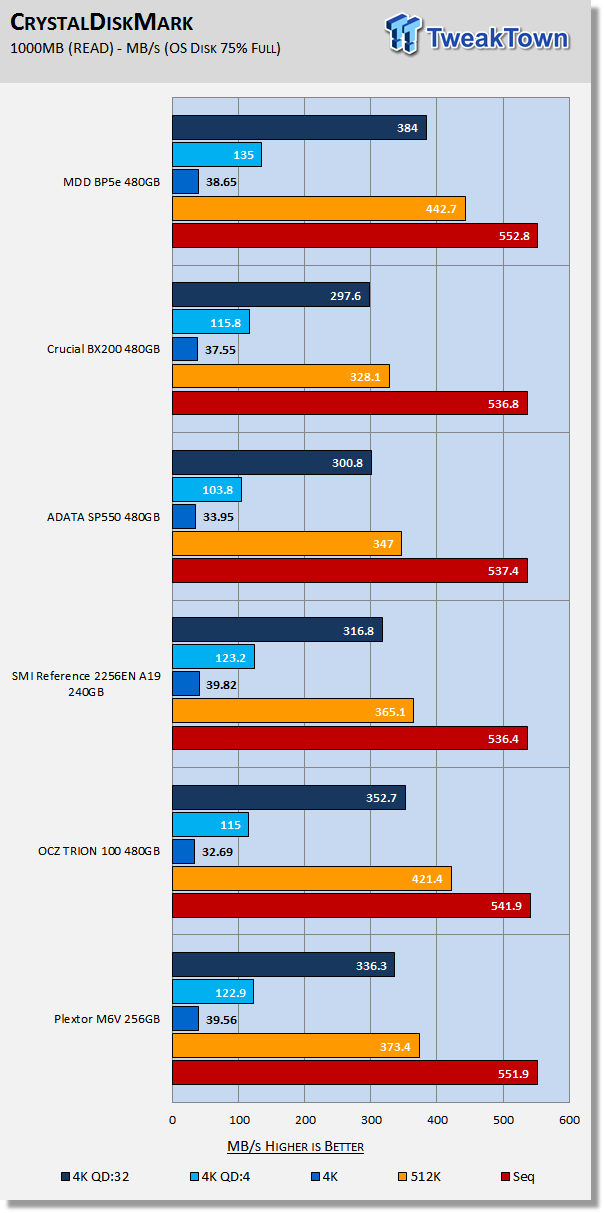
The BP5e leads the pack in four out of the five categories for the read portion of this test. The BP5e is even able to outperform the MLC-powered Plextor M6V.
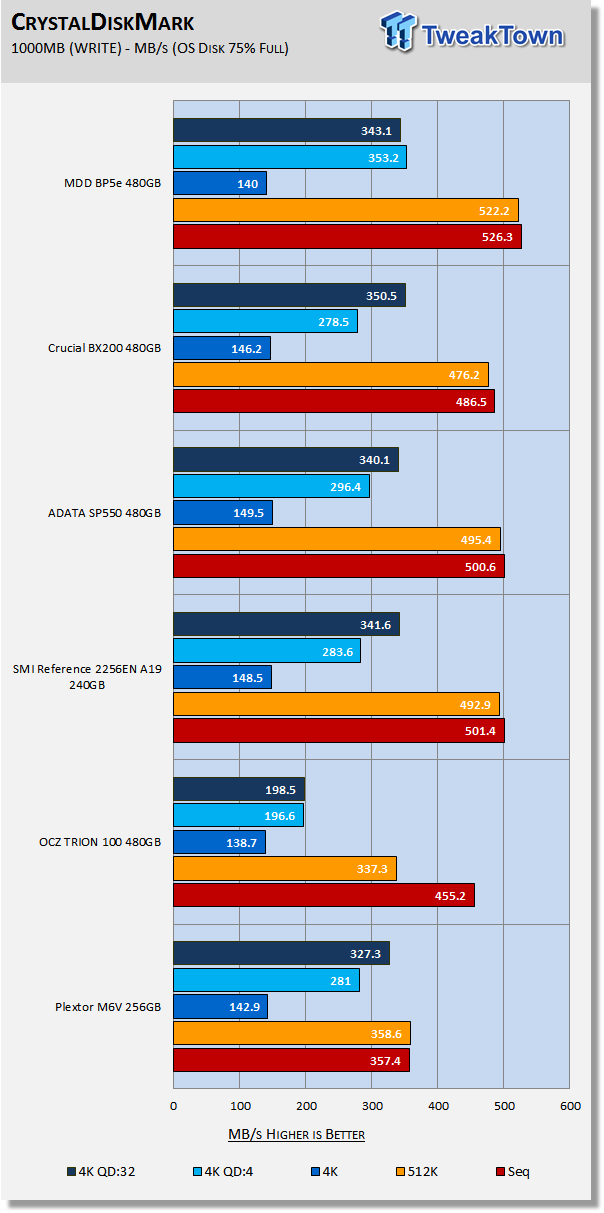
The BP5e wins 3 of the 5 categories of this test, again beating the rest of the drives in our test pool. So far, the BP5e is looking very fast.
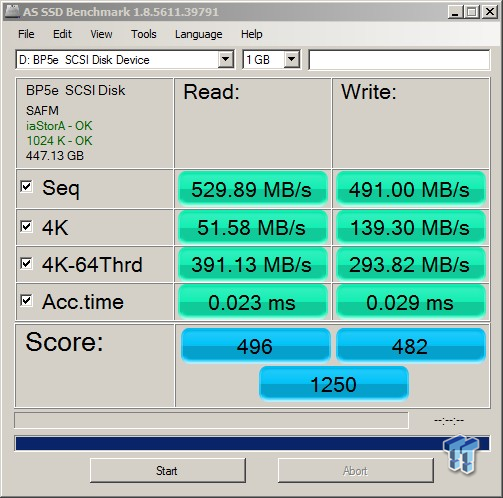
AS SSD
Version and / or Patch Used: 1.7.4739.38088
AS SSD determines the performance of Solid-State Drives (SSD). The tool contains four synthetic as well as three practice tests. The synthetic tests are to determine the sequential and random read and write performance of the SSD.
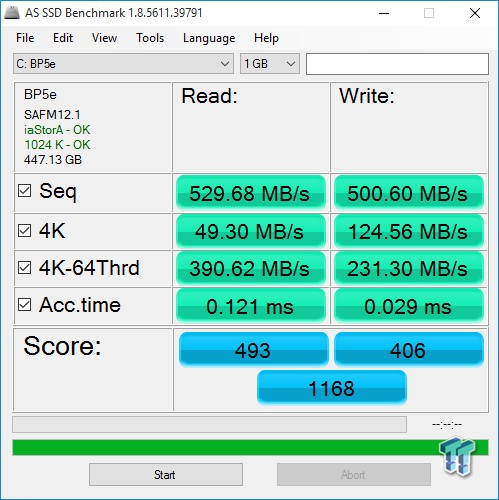
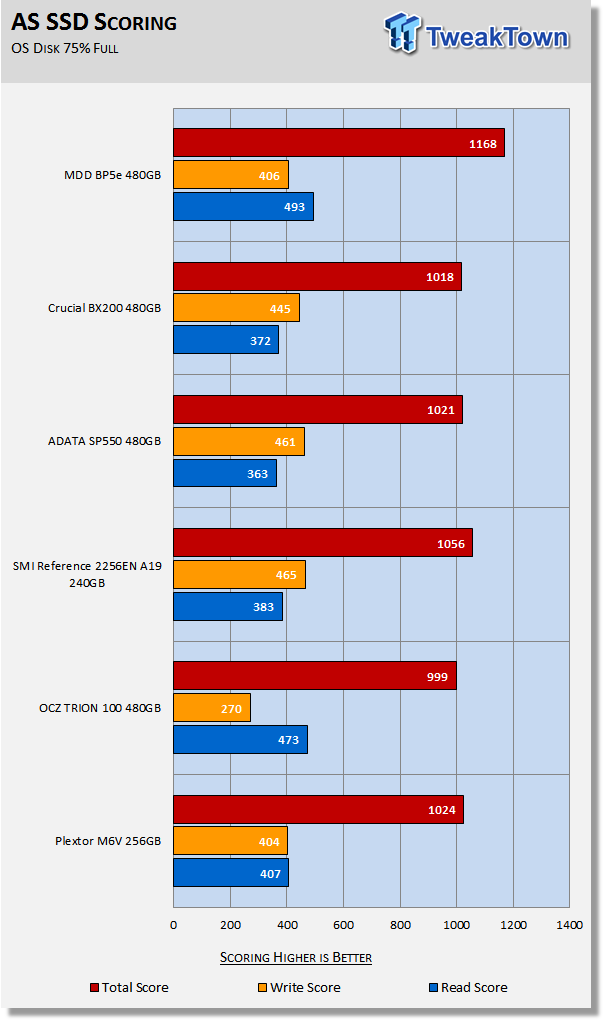
Again, the BP5e crushes the competition, solidifying its dominance with synthetic benchmarks.
Benchmarks (Trace-Based OS Volume) - PCMark Vantage, PCMark 7 & PCMark 8
Moderate Workload Model
We categorize these tests as indicative of a moderate workload environment.
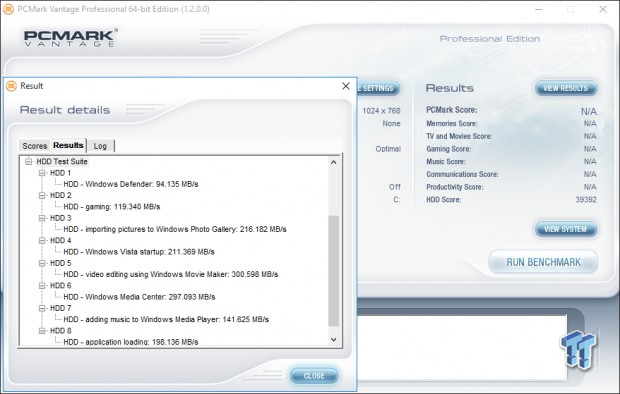
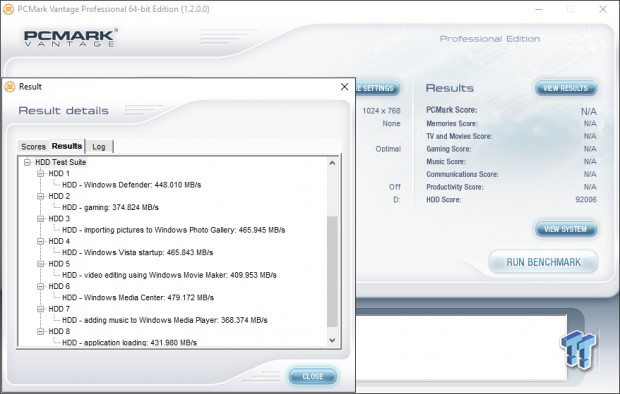
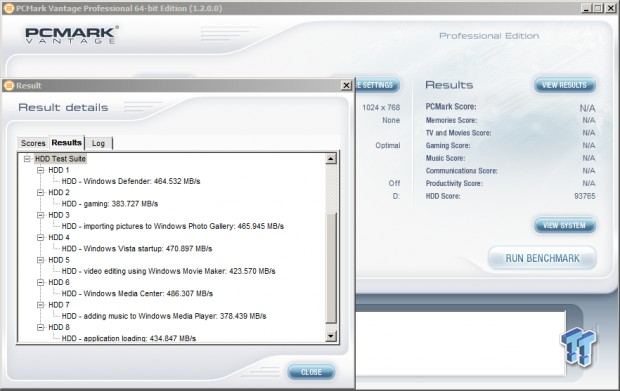
PCMark Vantage - Hard Disk Tests
Version and / or Patch Used: 1.2.0.0
The reason we like PCMark Vantage is because the recorded traces are played back without system stops. What we see is the raw performance of the drive. This allows us to see a marked difference between scoring that other trace-based benchmarks do not exhibit. An example of a marked difference in scoring on the same drive would be empty vs. filled vs. steady state.
We run Vantage three ways. The first run is with the OS drive 75% full to simulate a lightly used OS volume filled with data to an amount we feel is common for most users. The second run is with the OS volume written into a "Steady State" utilizing SNIA's guidelines. Steady state testing simulates a drives performance similar to that of a drive that been subjected to consumer workloads for extensive amounts of time. The third run is a Vantage HDD test with the test drive attached as an empty, lightly used secondary device.
OS Volume 75% Full - Lightly Used

OS Volume 75% Full - Steady State
Secondary Volume Empty - FOB
There's a big difference between an empty drive, one that's 75% full/used, and one that's in a steady state.
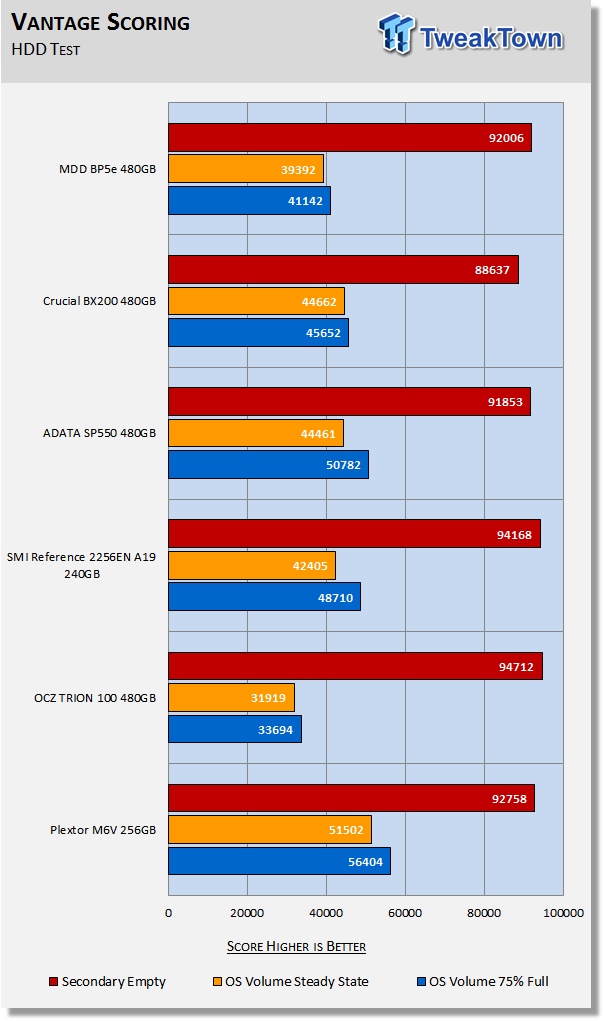
The important scores to pay attention to are "OS Volume Steady State" and "OS Volume 75% full." These two categories are most important because they are indicative of typical of consumer user states. When a drive is in a steady state, it means garbage collection is running at the same time it's reading/writing. This is exactly why we focus on steady state performance.
We see a nice improvement over OCZ's TRION 100, but the SMI-powered drives can deliver better workload performance. Moderate workload performance is one area where we would like to see some improvement for S10 powered SSDs.
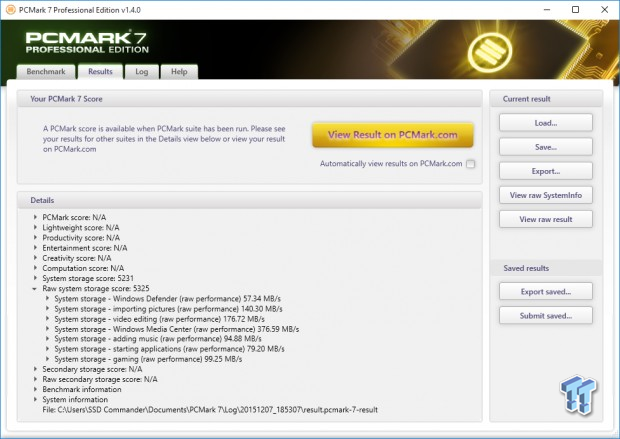
PCMark 7 - System Storage
Version and / or Patch Used: 1.4.0
We will look to Raw System Storage scoring for evaluation because it's done without system stops and, therefore, allows us to see significant scoring differences between drives.
OS Volume 75% Full - Lightly Used
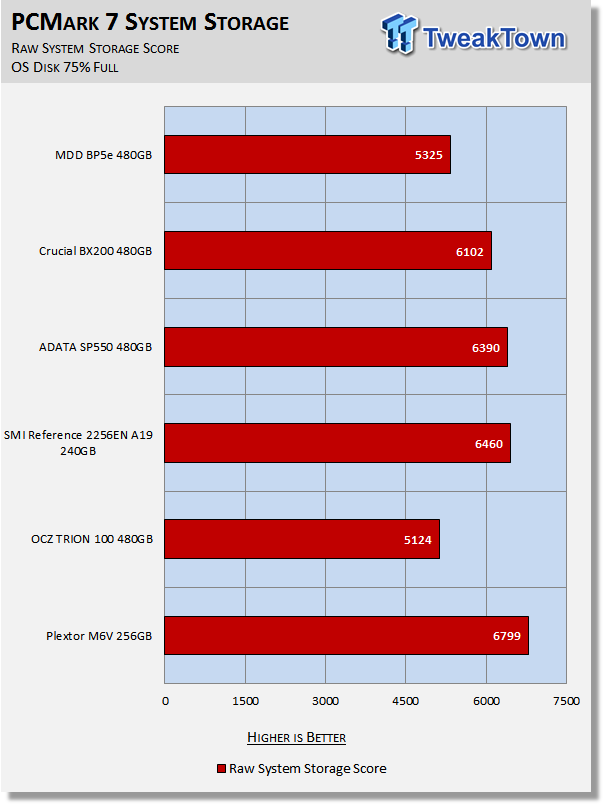
This test backs up our Vantage results. The BP5e is able to outperform the TRION 100, but the SMI-powered drives again deliver better moderate workload performance.
PCMark 8 - Storage Bandwidth
Version and / or Patch Used: 2.4.304
We use PCMark 8 Storage benchmark to test the performance of SSDs, HDDs, and hybrid drives with traces recorded from Adobe Creative Suite, Microsoft Office, and a selection of popular games. You can test the system drive or any other recognized storage device, including local external drives. Unlike synthetic storage tests, the PCMark 8 Storage benchmark highlights real-world performance differences between storage devices.
OS Volume 75% Full - Lightly Used
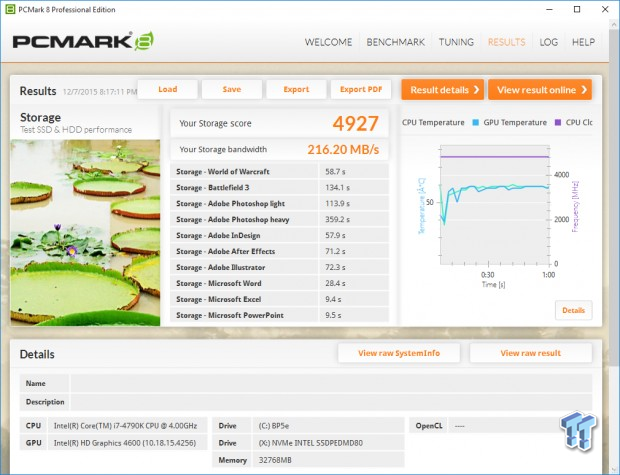
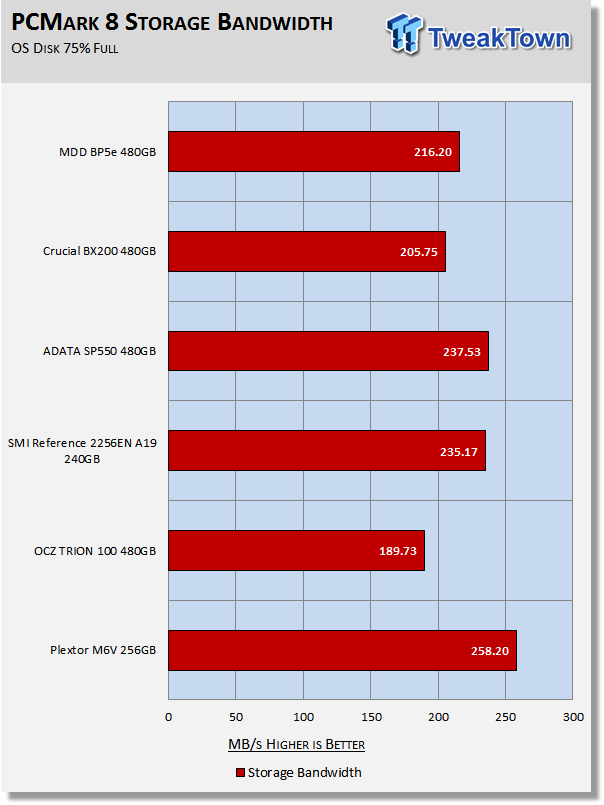
PCMark 8 is the most intensive moderate workload simulation we run. With respect to moderate workloads, this test is what we consider the best indicator of a drive's performance.
As the workloads get a little more intense, the BP5e performs better. This time, the BP5e is able to outperform the BX200 and the TRION 100.
Benchmarks (Secondary Volume) – Max IOPS, Disk Response & Transfer Rates
Iometer – Maximum IOPS
Version and / or Patch Used: Iometer 2014
We use Iometer to measure high queue depth performance. (No Partition)
Max IOPS Read
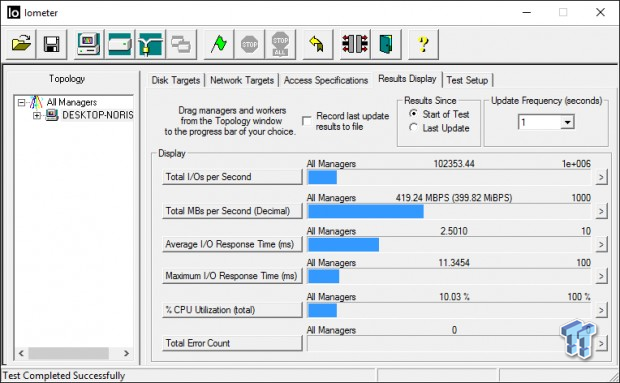
Max IOPS Write
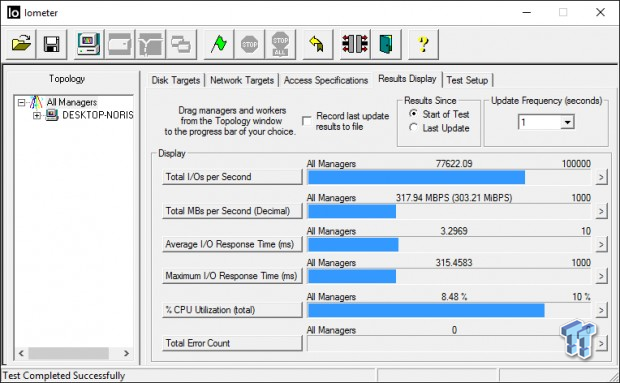
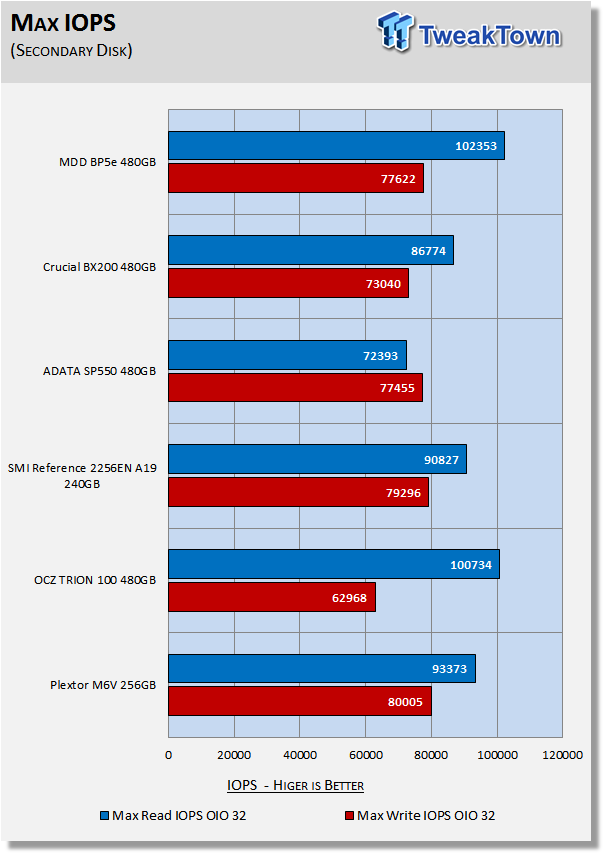
MDD doesn't list random 4k read/write performance for the BP5e, but we can say it's up to 102K/77K.
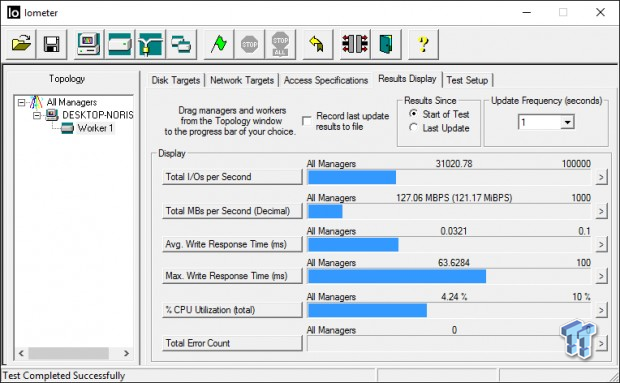
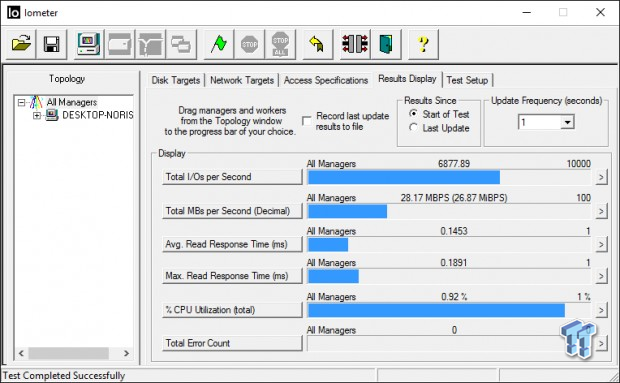
Iometer – Disk Response
Version and / or Patch Used: Iometer 2014
We use Iometer to measure disk response times. Disk response times are measured at an industry accepted standard of 4K QD1 for both write and read. Each test runs twice for 30 seconds consecutively, with a 5-second ramp-up before each test. We partition the drive/array as a secondary device for this testing.
Avg. Write Response
Avg. Read Response
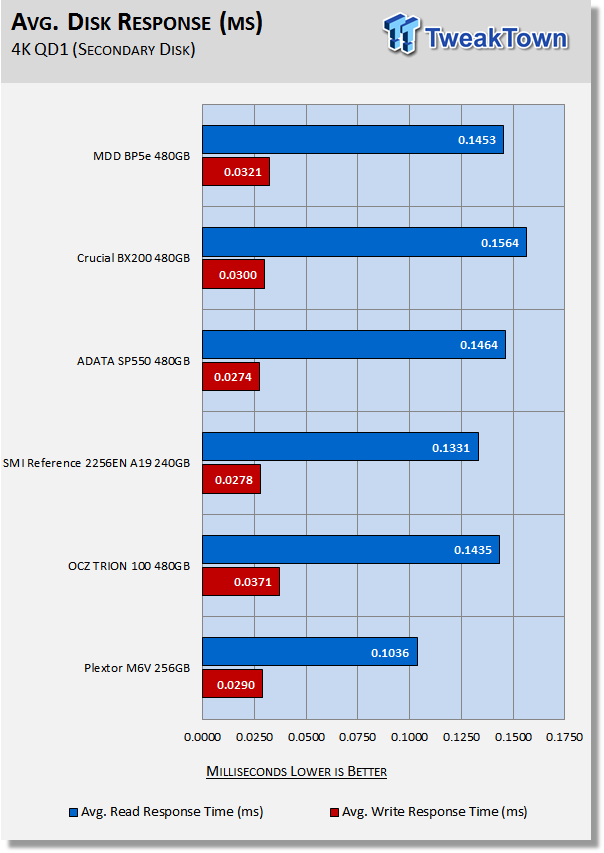
Response times are as expected for a TLC SSD.
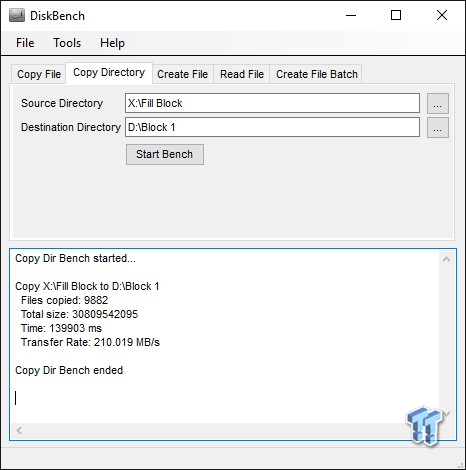
DiskBench - Directory Copy
Version and / or Patch Used: 2.6.2.0
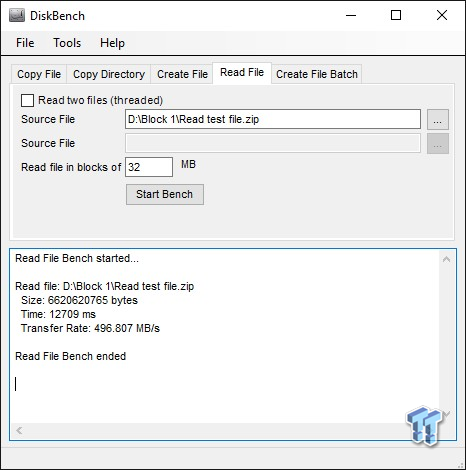
We use DiskBench to time a 28.6GB block (9,882 files in 1,247 folders) composed primarily of incompressible sequential and random data as it's transferred from our DC P3700 PCIe NVME SSD to our test drive. We then read from a 6GB zip file that's part of our 28.6GB data block to determine the test drives read transfer rate. Our system is restarted prior to the read test to clear any cached data, ensuring an accurate test result.
Write Transfer Rate
Read Transfer Rate
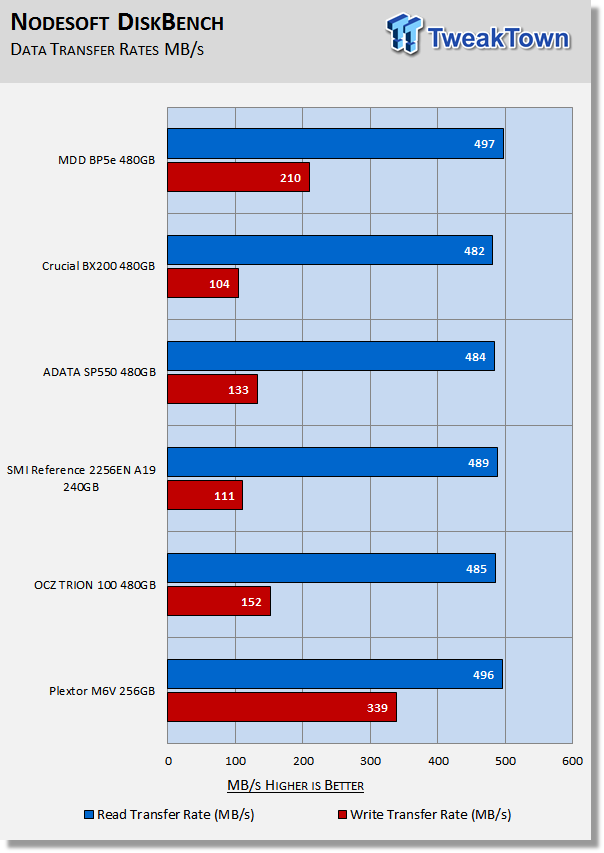
This is the unmasked write performance of S10 powered Toshiba 15nm TLC Flash. We are pleasantly surprised. The BP5e has much-better-sustained write performance than any of the competing TLC SSDs in our test pool.
Benchmarks (Secondary Volume) – PCMark 8 Extended
Futuremark PCMark 8 Extended
Heavy Workload Model
PCMark 8's consistency test simulates an extended duration heavy workload environment. PCMark 8 has built-in, command line executed storage testing. The PCMark 8 Consistency test measures the performance consistency and the degradation tendency of a storage system.
The Storage test workloads are repeated. Between each repetition, the storage system is bombarded with a usage that causes degraded drive performance. In the first part of the test, the cycle continues until a steady degraded level of performance has been reached. (Steady State)
In the second part, the recovery of the system is tested by allowing the system to idle and measuring the performance after 5-minute long intervals. (Internal drive maintenance: Garbage Collection (GC)) The test reports the performance level at the start, the degraded steady-state, and the recovered state, as well as the number of iterations required to reach the degraded state and the recovered state.
We feel Futuremark's Consistency Test is the best test ever devised to show the true performance of solid state storage in an extended duration heavy workload environment. This test takes on average 13 to 17 hours to complete, and writes somewhere between 450GB and 14,000GB of test data depending on the drive. If you want to know what an SSDs steady state performance is going to look like during a heavy workload, this test will show you.
Here's a breakdown of Futuremark's Consistency Test:
Precondition phase:
1. Write to the drive sequentially through up to the reported capacity with random data.
2. Write the drive through a second time (to take care of overprovisioning).
Degradation phase:
1. Run writes of random size between 8*512 and 2048*512 bytes on random offsets for 10 minutes.
2. Run performance test (one pass only).
3. Repeat 1 and 2 for 8 times, and on each pass increase the duration of random writes by 5 minutes.
Steady state phase:
1. Run writes of random size between 8*512 and 2048*512 bytes on random offsets for 50 minutes.
2. Run performance test (one pass only).
3. Repeat 1 and 2 for 5 times.
Recovery phase:
1. Idle for 5 minutes.
2. Run performance test (one pass only).
3. Repeat 1 and 2 for 5 times.
Storage Bandwidth
PCMark 8's Consistency test provides a ton of data output that we use to judge a drive's performance.
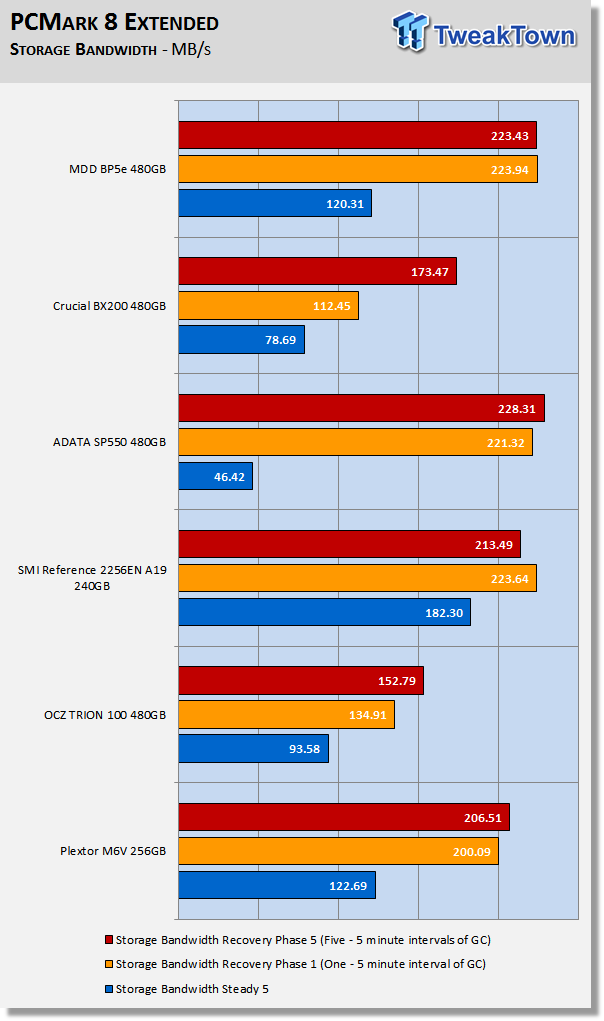
We consider steady state bandwidth (the blue bar) our test that carries the most weight in ranking a drive/arrays heavy workload performance. Performance after Garbage Collection (GC) (the orange and red bars) is what we consider the second most important consideration when ranking a drives performance. Trace-based steady state testing is where true high performing SSDs are separated from the rest of the pack.
Overall, the BP5e outperforms all but our SMI reference board. The BP5e struggles a bit with moderate workloads, but handles the heavy duty stuff quite well. The BP5e has excellent recovery performance and leads all drives in our test pool after five minutes of recovery.
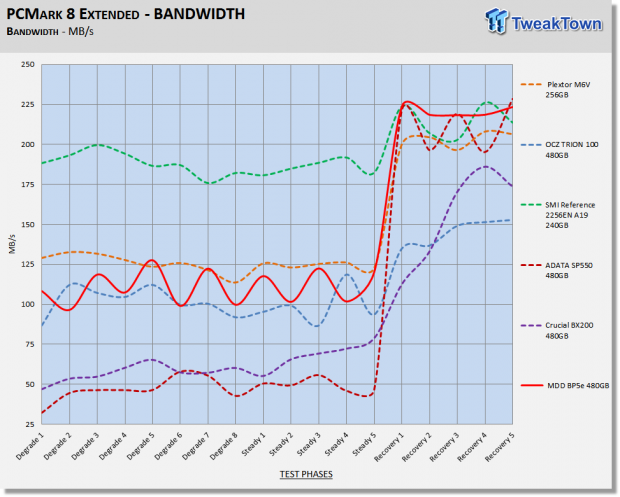
We chart our test subject's storage bandwidth as reported at each of the test's 18 trace iterations. This gives us a good visual perspective of how our test subjects perform as testing progresses. This chart sheds a little more light on how the drives perform as they progresses through the testing phases.
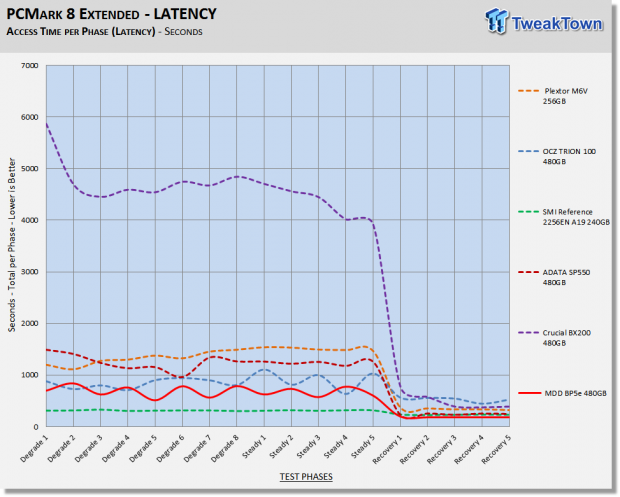
Total Access Time (Latency)
We chart the total time the disk is accessed as reported at each of the test's 18 trace iterations. The BP5e maintains excellent latency across all 18 phases of this brutal test.
Disk Busy Time
Disk Busy Time is how long the disk is busy working. We chart the total time the disk is working as reported at each of the tests 18 trace iterations.
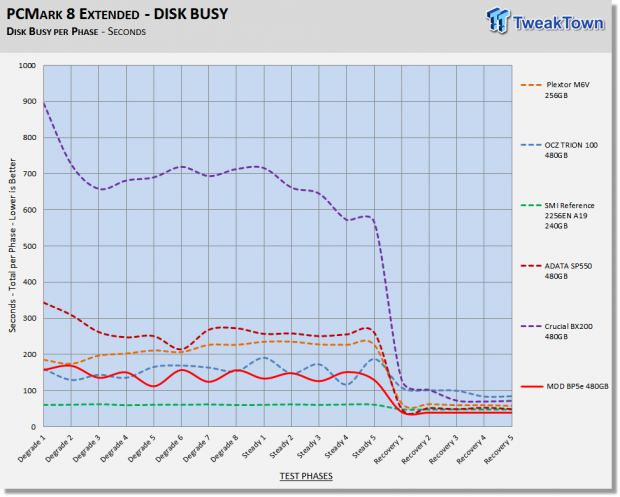
When latency is low, disk busy time is low as well.
Data Written
We measure the total amount of random data that our test drive/array is capable of writing during the degradation phases of the consistency test. Pre-conditioning data is not included in the total. The total combined time that degradation data is written to the drive/array is 470 minutes. This can be very telling. The better a drive/array can process a continuous stream of random data, the more data will be written.
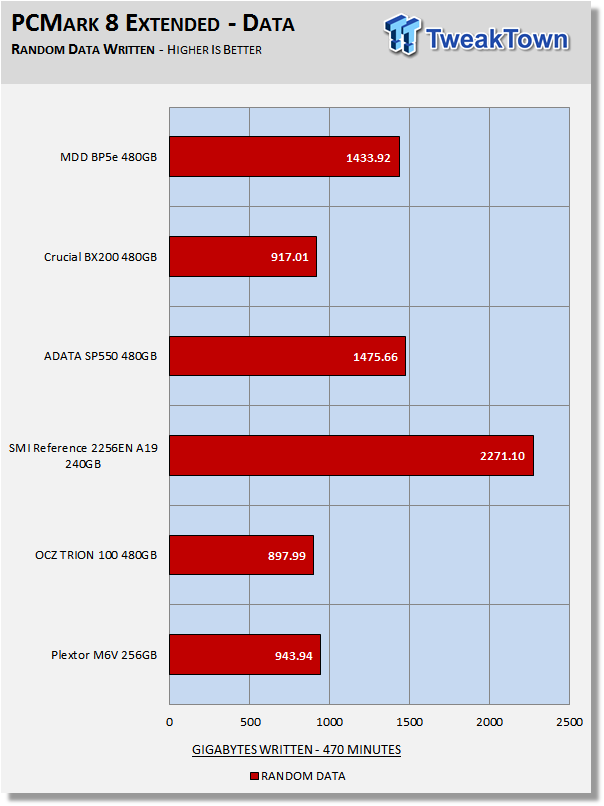
Combined read/write latency, capacity and overprovisioning are the biggest factors that determine the outcome of this portion of the test. Due to excellent latency, the BP5e is able to write a large amount of random data in 470 minutes.
Benchmarks (Secondary Volume) - 70/30 Mixed Workload
70/30 Mixed Workload Test (Sledgehammer)
Version and / or Patch Used: Iometer 2014
Heavy Workload Model
This test hammers a drive so hard we've dubbed it "Sledgehammer". Our 70/30 Mixed Workload test is designed to simulate a heavy-duty enthusiast/workstation steady-state environment. We feel that a mix of 70% read/30% write, full random 4K transfers best represents this type of user environment. Our test allows us to see the drive enter into and reach a steady state as the test progresses.
Phase one of the test preconditions the drive for 1 hour with 128K sequential writes. Phase two of the test runs a 70% read/30% write, full random 4K transfer workload on the drive for 1 hour. We log and chart (phase two) IOPS data at 5-second intervals for 1 hour (720 data points). 60 data points = 5 minutes.
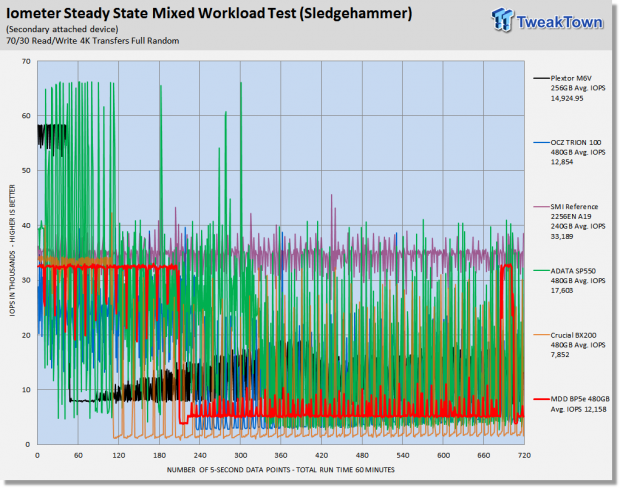
What we like about this test is that it reflects reality. Everything lines up, as it should. Consumer drives don't outperform Enterprise-Class SSDs that were designed for enterprise workloads. Consumer drives based on old technology are not outperforming modern Performance-Class SSDs, etc.
Here we see that the S10 controller struggles a bit with mixed workloads. This is our only gripe with the S10; mixed workload performance. Phison is working on this, and we fully expect to see better workload performance through future firmware updates.
Maxed-Out Performance (MOP)
This testing is just to see what the drive is capable of in an FOB (Fresh Out of Box) state under optimal conditions. We are utilizing Windows Server 2008 R2 64-bit for this testing. Same Hardware, just an OS change.
Final Thoughts
As it stands, every TLC SSD that hits the market will find itself compared to the 850 EVO. None can compete regarding overall performance, which is why we did not include the 850 EVO in our test pool. That means we need to look at performance with pricing factored in to determine if a TLC drive will receive a TweakTown recommendation. There are only two TLC SSDs we've reviewed that are priced far enough below the 850 EVO to even consider as an alternative to the 850 EVO.
The first is Crucial's BX200, which is priced about $30 below the 850 EVO, but its performance is so bad that we cannot recommend it to our readers. The other is My Digital's BP5e. The BP5e is priced even lower than the BX200, coming in at about $35 less than an 850 EVO. Price is not enough though, performance also needs to be good enough so that saving $35 makes sense. We do feel that My Digital's BP5e has been able to accomplish this feat. The BP5e 480GB SATA III SSD handily outperforms the competition with synthetic testing, performing nearly as well as the 850 EVO at a significantly lower cost per gigabyte. Also, the BP5e is capable of almost double the sustained write performance of most competing TLC SSDs. When compared to other planar TLC flash on the market, Toshiba's 15nm TLC is looking pretty good.
We are very happy with the SSD experience that the My Digital BP5e 480GB SATA III SSD delivers. While running the BP5e as our OS disk loaded up with data to 75% of its capacity, the drive still provided an outstanding user experience. This is quite the opposite of what we've experienced from the competition; they get loaded up with data, and there is a noticeable decrease in expected responsiveness. It has been awhile since My Digital brought a new SSD to market and they are very excited about the BP5e, as they should be, because the BP5e is TweakTown recommended. It's planar TLC done right and at the right price.
Pros:
- Awesome Synthetic Performance
- Acceptable Sustained Write Performance
- Lowest Price Per GB on the Market
Cons:
- Moderate Workload Performance
 Samsung 990 2TB SSD Review - Ninth Gen QLC at PCIe Gen4 Speeds
 HighPoint Rocket 1604L Gen5 x16 NVMe Software RAID AIC Review: half the price with full 59 GB/s speed
 UGREEN NASync DXP4800 GT Review: powerful 4-bay NAS with AMD Ryzen and dual 10GbE ports
 Phison E37T SSD Controller Exclusive Preview - The Fastest DRAMless SSD Platform Yet
 Seagate FireCuda X1070 4TB SSD Review - A New Mainstream Contender
 God of War Laufey gets a release date and Kratos is making a return
 GTA 6 trailer 3 expected to arrive within two weeks, according to insider
 Thieves stole 16 RAM sticks from Chinese eSports hotels, arrested
 Lisuan LX7G100 GPU achieves playable FPS in system with no Intel AMD or NVIDIA hardware inside
 Elder Scrolls 6 roadmap not affected by layoffs, Bethesda says
 Intel and AMD are locking Chinese customers into long-term CPU deals as server chip prices climb more than 40%
 Ubisoft CEO says Sony's PlayStation disc shutdown will not disturb the industry too much
 Vibe coding is flooding the App Store with new apps - on track for record submissions in 2026
 Geekbench 7 is out with CUDA support, smarter multi-core scoring, and new AI workloads across all major platforms
 GTA 6 physical copies in Japan have a 170-day expiration date
 Thrustmaster T.Flight HOTAS 5 MSFS Edition Review
 SteelSeries Arctis Nova Pro Omni Wireless Headset Review - One Headset to Rule Them All
 SteelSeries Arctis Nova 7 Wireless Gen 2 Headset Review - New and Improved, But Is It Enough?
 AMD Ryzen 7 7700X3D Review - Days of Future Past
 ASUS ExpertBook Ultra (Panther Lake) 14" Business Laptop Review
 ASUS ROG Raikiri II Xbox Wireless Controller Review - Ready to Take Control
 MOZA FMP18 Panel Bundle Review: authentic F/A-18 Hornet cockpit controls for flight sims
 Micron 6600 ION 245.76TB Enterprise SSD Review - Best in Class Programming Speeds
 MOZA MA3F EFCM Flight Control Module Review: authentic Airbus A320 autopilot panel for simulators
 The Ultimate Guide to Personalizing Your Windows 11 Taskbar
 How to Turn Your Windows Laptop Into a Second Monitor with Miracast and Wireless Display in Minutes
 6 Mistakes to Avoid When Buying a Windows Laptop
 I capped Windows Update's bandwidth with Delivery Optimization, and my downloads stopped choking
 I use this decade-old free tool that finds files faster than Windows Search does
 I install and update most of my apps with this Windows command now, and I stopped downloading sketchy installers
 Hisense U6SF 65-inch MiniLED TV: High Performance Meets Leisurely Convenience
 I stopped digging through Windows menus after I set up this one folder
 Don't sell your Windows laptop until you do these things
 6 PC cleaning mistakes to avoid for safer hardware maintenance