Introduction

SMART Storage Systems was recently acquired by SanDisk. It's a major acquisition that brings significant advantages for both companies. SMART now comes under the umbrella of one of the world's largest producers of NAND and has direct access to the fab. The combination of SMART's IP with SanDisk's already-expansive portfolio and decades of NAND innovation creates a new path forward for SanDisk's enterprise SSD portfolio.
SanDisk gains valuable controller technology from SMART, a company that prides itself on offering the lowest cost-per-TBW (Terabytes Written) ratio in the industry, and the IP behind Guardian Technology. The Guardian Technology is SMART's suite of advanced NAND management techniques that radically extends the useable life of NAND, allowing the use of consumer-grade MLC in enterprise environments.
The release of the CloudSpeed 1000E is a great example of SanDisk's new IP at work. The SATA 6Gb/s 7mm 2.5" SSD offers up tremendous endurance specifications that are among the highest attainable with consumer-class MLC flash. We were impressed with the performance offered by the CloudSpeed 500, and expanding upon the 500's endurance and performance, while simultaneously shrinking down to Toshiba 19nm, is quite the feat. SanDisk and Toshiba produce 19nm NAND together from their Flash Forward LTD joint venture, making the use of their 19nm MLC a great move for SanDisk as they move forward with SMART.
The CloudSpeed family of SSDs includes two models, the 1000 and the 1000E. The 1000 comes in standard capacities of 120GB, 240GB, 480GB and 960GB with 6% overprovisioning. For users that require more endurance there is the 1000E, with its 22% overprovisioning, offering higher endurance at capacities of 100GB, 200GB, 400GB and 800GB.
The Guardian Technology suite increases the endurance up to 3,070TBW for the 1000 model, and a whopping 7,680TBW for the 1000E. This segmentation allows users to select an SSD that accurately reflects the need of their environment, but aside from endurance and a slight tick in random write speed, the key features of the SSDs remain the same. Both models feature Tier-one OEM firmware, a key consideration with SanDisk now having enterprise SSDs qualified with six of the top seven storage OEMs.
The sustained throughput for both models weighs in at 450 MB/s read and 350 MB/s write, with the 1000 offering 80/20K read/write IOPS, and the 1000E experiences a slight write performance bump to 80/25K IOPS. Enterprise-class features is SMART's forte, so third generation power management (EverGuard) via power capacitors is a standard feature on their products. Data reliability is spec'd for 1 in 10E18 bits read, a 100X increase over the minimum required by the JEDEC JESD 218 spec for enterprise-grade SSDs. In the event of an error, the SSD can rebuild up to an entire NAND block. Data security comes in the form of AES-256, full data path protection and an impressive MTBF of 2.0 million hours.
The NAND shrink allows for high-capacity SSDs that will challenge many 2.5" HDDs for slots, and thermal monitoring protects the SSD from overheating in these dense configurations. Pairing this with a 5-year warranty sweetens the deal. So, let's now take a closer look at the performance of the new CloudSpeed 1000 Series over the next few pages.
SMART CloudSpeed 1000 and 1000E Architecture

Before assembly, SMART subjects all NAND to an extensive re-characterization, which reassigns more accurate P/E Ratios to the NAND. Aggregated flash management ensures that there is an even distribution of different classes of NAND present to benefit the whole. Once assembled the Guardian Technology Platform takes over and the NAND settings are monitored and adjusted constantly.
This keeps the NAND perfectly in tune over the life of the SSD. The award-winning Guardian Technology Platform is SMART's proprietary approach consisting of three integral components.
FlashGuard
As NAND geometries shrink, endurance also shrinks and data errors multiply, creating difficulties hampering the introduction of low endurance MLC NAND into the datacenter. Data errors are typically solved with ECC (Error Correction Code). ECC can reach a diminishing point of returns when powerful ECC algorithms create excessive overhead, leading to performance degradation and higher latency. SMART utilizes adaptive DSP (Digital Signal Processing) in concert with advanced ECC algorithms to combat these data errors.
NAND is typically programmed for retention and wear metrics during NAND processing, and the settings are never altered. Adaptive programming dynamically adjusts flash parameters over the course of the SSDs life, tailoring the NAND settings at the base level. This creates exponential increases in endurance of the underlying NAND. Typical SSDs can only achieve wear leveling on each NAND package. Aggregated Flash Processing treats all of the flash elements as a whole and provides global cross-die wear leveling.
DataGuard
DataGuard provides full data path protection and the F.R.A.M.E. (Flexible Redundant of Memory Elements) functionality. F.R.A.M.E. is a cross-die data redundancy feature, similar to parity, which allows for data reconstruction in the event of a catastrophic event, such as a flash page or even an entire NAND block failure.
EverGuard
EverGuard is a third generation host power-loss protection approach that protects against unexpected power interruptions. An array of discrete ploy-Tantalum capacitors provides power to flush all data in transit to the NAND during loss of power. These Tantalum capacitors are rated for high temperature environments and do not experience degradation over time.

There are additional architectural features that reduce the power hold up time requirements, with advanced controller power management, and lower pages reserved for power-down writes.
SMART CloudSpeed 1000E Internals


The SMART CloudSpeed 1000E comes in a 7.5mm z-height metal casing. The 2.5-inch 7.5mm form factor is well suited for slim applications.

The case comes apart easily once four screws are removed. The thermal pad actually sets flush with the PCB on the opposite side of the controller, wicking heat away from the rear through the BGA mounting.

The rear of the PCB holds eight of the BGA-mounted 32GB NAND packages. The Toshiba NAND is actually jointly manufactured with SanDisk through their Flash Forward venture.

Power loss protection comes in the form of five capacitors on the bottom edge of the PCB, and an additional 15 emplacements on the rear of the PCB. This provides the SSD with enough power hold-up to flush data to the lower NAND pages. There are two DRAM packages, for a total of 512MB, above the Marvell controller.

The CloudSpeed 1000 marks a switch from the LSI SandForce controller with the CloudSpeed 500 to the Marvell 88SS9187-BLD2. This key step allows more flexibility for firmware customization, an important consideration for deploying the custom SMART firmware that allows the Guardian Suite to provide a 5X improvement in endurance over client SSDs.
Test System and Methodology


We utilize a new approach to HDD and SSD storage testing for our Enterprise Test Bench, designed specifically to target long-term performance with a high level of granularity.
Many testing methods record peak and average measurements during the test period. These average values give a basic understanding of performance, but fall short in providing the clearest view possible of I/O QoS (Quality of Service).
'Average' results do little to indicate the performance variability experienced during actual deployment. The degree of variability is especially pertinent, as many applications can hang or lag as they wait for I/O requests to complete. This testing methodology illustrates performance variability, and includes average measurements, during the measurement window.
While under load, all storage solutions deliver variable levels of performance. While this fluctuation is normal, the degree of variability is what separates enterprise storage solutions from typical client-side hardware. Providing ongoing measurements from our workloads with one-second reporting intervals illustrates product differentiation in relation to I/O QOS. Scatter charts give readers a basic understanding of I/O latency distribution without directly observing numerous graphs.
Consistent latency is the goal of every storage solution, and measurements such as Maximum Latency only illuminate the single longest I/O received during testing. This can be misleading, as a single 'outlying I/O' can skew the view of an otherwise superb solution. Standard Deviation measurements consider latency distribution, but do not always effectively illustrate I/O distribution with enough granularity to provide a clear picture of system performance. We use histograms to illuminate the latency of every I/O issued during our test runs.
Our testing regimen follows SNIA principles to ensure consistent, repeatable testing. We attain steady state through a process that brings the device within a performance level that does not range more than 20% during the measurement window. Forcing the device to perform a read-write-modify procedure for new I/O triggers all garbage collection and housekeeping algorithms, highlighting the real performance of the solution.
We measure power consumption during precondition runs. This provides measurements in time-based fashion, with results every second, to illuminate the behavior of power consumption in steady state conditions. Power consumption can cost more over the life of the device than the initial acquisition price of the hardware itself. This significantly affects the TCO of the storage solution. We also present IOPS-to-Watts measurements to highlight the efficiency of the storage solution.
Our test pool features SSDs of varying capacity and it is important to bear this in mind when viewing results. The first page of results will provide the 'key' to understanding and interpreting our new test methodology.
4K Random Read/Write

We precondition the CloudSpeed 1000E for 18,000 seconds, or five hours, receiving reports on several parameters of workload performance every second. We then plot this data to illustrate the drives' descent into steady state.
This chart consists of 36,000 data points. This is a dual-axis chart with the IOPS on the left and the latency on the right. The light green dots signify IOPS during the test, and the olive green dots are latency measurements during the test period. We place latency data in a logarithmic scale to bring it into comparison range. The lines through the data scatter are the average during the test. This type of testing presents standard deviation and maximum/minimum I/O in a visual manner.
Note that the IOPS and Latency figures are nearly mirror images of each other. This illustrates the point that high-granularity testing can give our readers a good feel for the latency distribution by viewing IOPS at one-second intervals. This should be in mind when viewing our test results below.
We provide histograms for further latency granularity below. This downward slope of performance happens very few times in the lifetime of the device, typically during the first few hours of use, and we present the precondition results only to confirm steady state convergence.

Each QD for every parameter tested includes 300 data points (five minutes of one second reports) to illustrate the degree of performance variability. The line for each QD represents the average speed reported during the five-minute interval.
4K random speed measurements are an important metric when comparing drive performance, as the hardest type of file access for any storage solution to master is small-file random. One of the most sought-after performance specifications, 4K random performance is a heavily marketed figure.
The CloudSpeed 1000E averages 67,919 IOPS with a 4K random read workload at QD256. This falls in right below the Samsung SM843, which is impressive. The Samsung SM843 has long held the top read speed in our testing, but the CloudSpeed gives it a run for the money in this test. We also note the massive speed increase compared to the previous generation CloudSpeed 500.

Garbage collection routines are more pronounced in heavy write workloads. This leads to more variability in performance. The CloudSpeed 1000E exhibits a very tight performance range at the middle of the chart, averaging a whopping 28,333 IOPS in steady state. This is well over the SMART's conservative rating of 25,000 IOPS.
The CloudSpeed 500 featured significant variability in this test and an average speed that was below that of the 1000E version. The significant increase in performance consistency for the 1000E is very encouraging, and the DC S3500 and the SM843 fall behind with nearly half the write speed of the 1000E.

Our write percentage testing illustrates the varying performance of each solution with mixed workloads. The 100% column to the right is a pure write workload of the 4K file size, and 0% represents a pure 4K read workload.
The CloudSpeed 1000E cuts through the clutter, exhibiting tight consistent performance that beats the other SSDs. The CloudSpeed 500 has a higher average in the 40-90% range, but significant variability muddies the water.

The CloudSpeed 1000E delivers a very tight latency range reflective of its consistent performance, with 35.4% of I/O's (3,007,151) falling into the 8-10ms range, 28.6% at 10-20ms, and 27.6% at 6-8ms.

We record the power consumption measurements during our precondition run. We calculate the stated average results during the last five minutes of the test, after the device has settled into steady state.
The CloudSpeed 1000E averages 3.31 Watts during the test period. These is the highest power consumption from the test field, but with much higher performance, the efficiency numbers below are more pertinent.

IOPS to Watts measurements are generated from data recorded during our precondition run, and the stated average is from the last five minutes of the test.
The CloudSpeed 1000E delivers 6,416 IOPS per Watt while under the 4K write workload. This is a slightly lower than the 500, but the 1000E enjoys a lead over the other competing SSDs.
8K Random Read/Write


8K random read and write speed is a metric that is not tested for consumer use, but for enterprise environments this is an important aspect of performance. With several different workloads relying heavily upon 8K performance, we include this as a standard with each evaluation. Many of our Server Emulations below will also test 8K performance with various mixed read/write workloads.
The average 8K random read speed of the CloudSpeed 1000E nudges the Intel out for second place with an average of 40,788 IOPS at QD256, while the Intel DC S3500 achieves 39,413 IOPS.

The average 8K random write speed of the CloudSpeed 1000E falls slightly below the older 500, but exhibits a much tighter performance envelope. The average speed of the 1000E is 14,630 IOPS, well above the Seagate and Intel offerings.

The CloudSpeed 1000E provides resilience to heavier write workloads in our testing.

The 1000E delivers a very tight latency range, with 80.3% of I/O's (3,515,397) at 10-20ms, and 19.5% in the 20-40ms range.

Power consumption for the 1000E averages 4.36 Watts during the measurement window. While this is higher than the other SSDs, it provides higher performance, reflected in the IOPS to Watts testing.

The CloudSpeed 1000E averages 3,333 IOPS per Watt, an improvement over the 500, and higher than the competing SSDs.
128K Sequential Read/Write

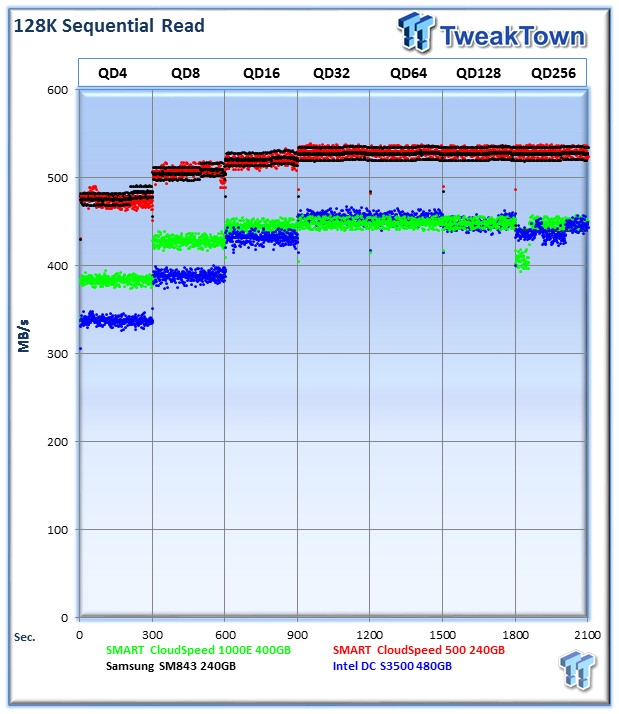
The 128K sequential speeds reflect the maximum sequential throughput of the SSD using a realistic file size encountered in an enterprise scenario.
The CloudSpeed 1000E provides an average of 441 MB/s of sequential read speed, below the CloudSpeed 500 and the SM843.

The 1000E provides rock-steady write performance with an average of 437 MB/s, second only to the SM843. Performance is very consistent in comparison to the DC S3500, which has a widely spread performance pattern.

The CloudSpeed 500 still holds the crown for heavy write percentage workloads with sequential data, but the 1000E manages to match, or beat, the rest of the pool in this test.

The 1000E is remarkably consistent, delivering 99% of I/O at 60-80ms, and .72% at 80-100ms.

The CloudSpeed 1000E averages 2.23 Watts during the measurement window.

The 1000E averages 78 MB/s per Watt, the lowest of the test pool.
Database/OLTP and Webserver
Database/OLTP

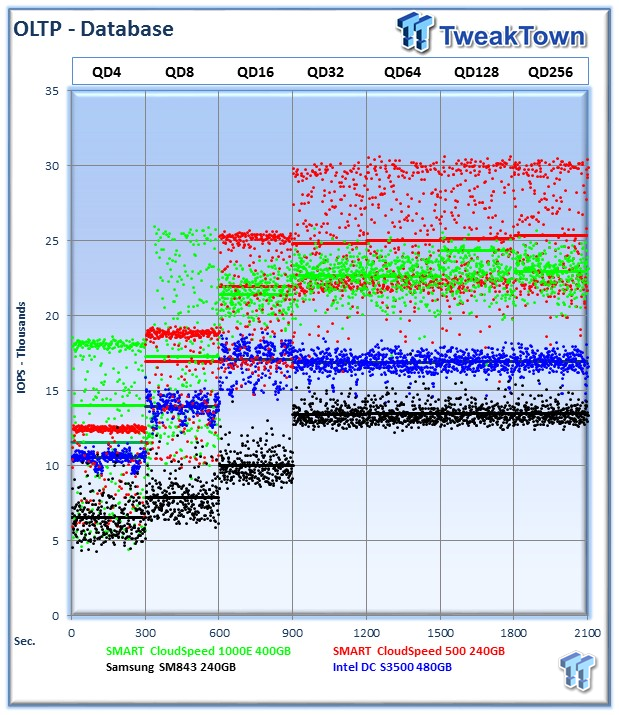
This test emulates Database and On-Line Transaction Processing (OLTP) workloads. OLTP is in essence the processing of transactions such as credit cards and high frequency trading in the financial sector. Enterprise SSDs are uniquely well suited for the financial sector with their low latency and high random workload performance. Databases are the bread and butter of many enterprise deployments. These are demanding 8K random workloads with a 66% read and 33% write distribution that can bring even the highest performing solutions down to earth.
The CloudSpeed 1000E averages 22,945 IOPS at QD256.
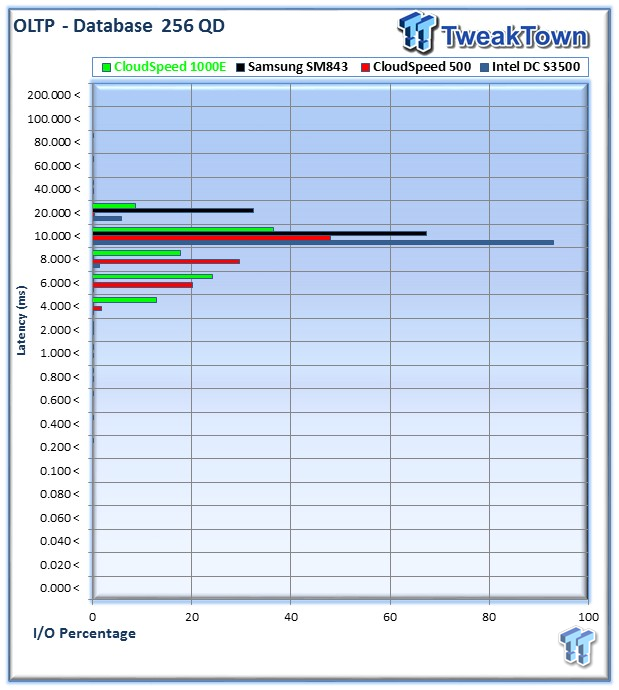
The CloudSpeed 1000E provides 36.4% of I/O at 10-20ms, 24% at 6-8ms, 17.6% at 8-10ms, and 12.8% in the 4-6ms range.

The 1000E averages 3.76 Watts during the precondition run.

The 1000E nudges past the SM843 with 6,101 IOPS per Watt.
Webserver
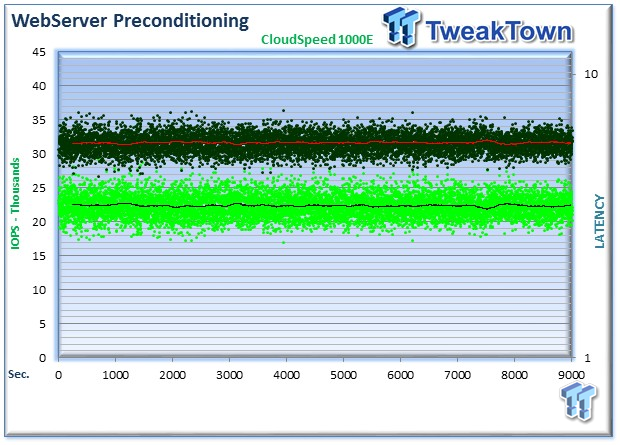

The Webserver profile is a read-only test with a wide range of file sizes. Web servers are responsible for generating content for users to view over the internet, much like the very page you are reading. The speed of the underlying storage system has a massive impact on the speed and responsiveness of the server that is hosting the website, and thus the end-user experience.
The 1000E averages 6,746 IOPS at QD256. The DC S3500 manages to beat the 1000E slightly, while the SM843 continues to flaunt its impressive skills in read-centric workloads.

The 1000E provides 71.9% of I/O at 10-20ms, 22.4% at 8-10ms, and 5.5% at 6-8ms.
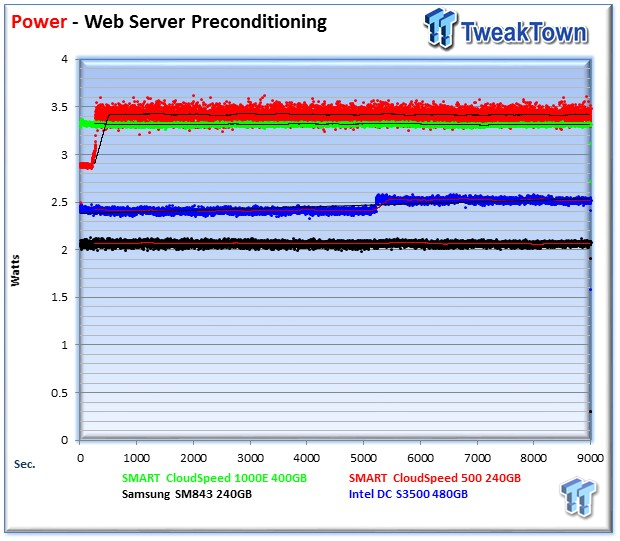
The 1000E averages 3.31 Watts during the measurement window.

The 1000E averages 6,746 IOPS per Watt.
Fileserver


The File Server profile represents typical file server workloads. This profile tests a wide variety of different file sizes simultaneously, with an 80% read and 20% write distribution.
The CloudSpeed 1000E averages 32,354 IOPS at QD256, falling into second place.
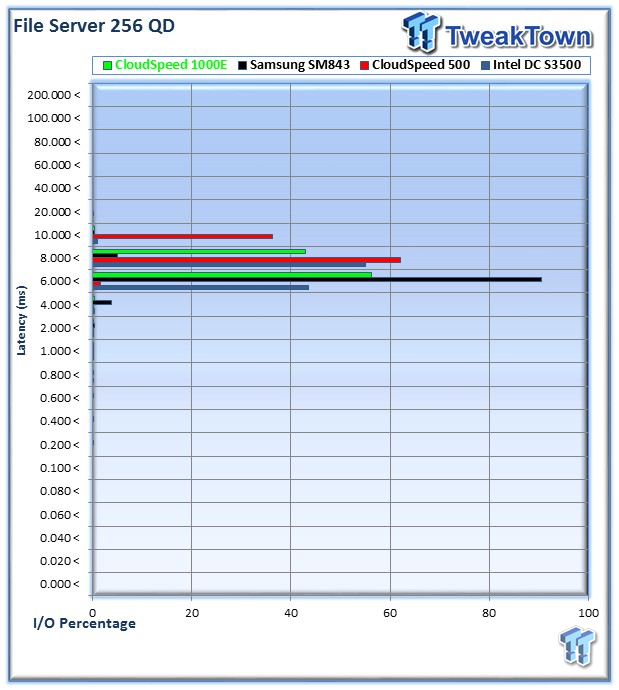
The 1000E provides 56.3% of I/O at 6-8ms, and 42.8% at 8-10ms.

The 1000E averages 3.32 Watts in steady state.
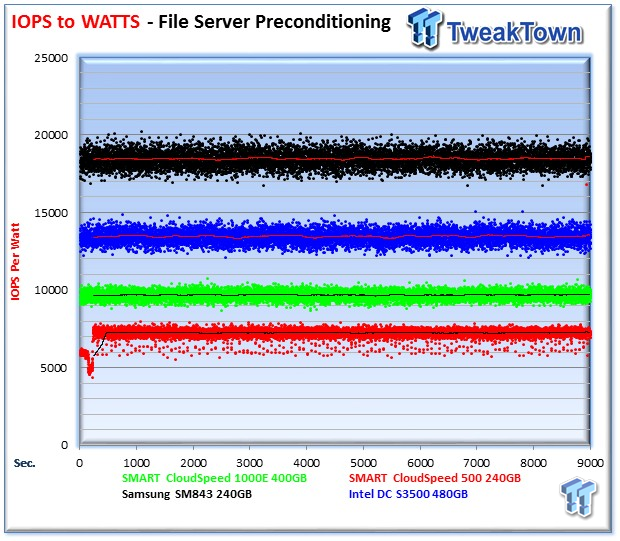
The 1000E averages 9,711 IOPS per Watt, placing third in the test.
Final Thoughts

Gartner predicts that by 2017, SSD prices will fall 35 percent, but the reliability of the flash will also decline nearly 30 percent. The economy of scale for MLC has kicked in, and the continued use of MLC as it shrinks will provide a lower price point and increased density. This reduction in NAND reliability requires new approaches to combat increasing error rates and lower P/E ratios. Guardian Technology, developed by SMART and now integrated into SanDisk's portfolio, provides a significant advantage as the NAND lithography shrinks.
Maintaining high performance while increasing reliability can be a precarious balancing act. The CloudSpeed 1000E performed well in our testing, outperforming the competing SSDs and improving over the CloudSpeed 500 in several key metrics. One of the key performance improvements revolved around performance consistency. We noted a considerable increase in consistency, creating a tight performance envelope in write-heavy workloads. This consistency translates well to application performance and boosts performance in RAID environments.
The read speed of the CloudSpeed 1000E also increased, and in some workloads approached the SM843, which has long held the top spot in read performance in the value segment. Another impressive aspect was the power efficiency of the 1000E - it outperformed the other SSDs in the majority of our IOPS-to-Watts tests.
With the CloudSpeed 1000E featuring predictable performance and solid performance results, our attention turns to the endurance. Endurance should always be a driving factor behind any SSD purchasing decision. Small differences in price can equate to large differences in performance and endurance, and for those that wade into the value market, it is important to take a number of factors into consideration. From the chart above, we can see the massive increase in endurance from the CloudSpeed 500 to the 1000 Series. This big increase in endurance, while simultaneously shrinking the NAND, is nothing short of phenomenal.

In comparison to the SSDs from the competition, the CloudSpeed series offers from three to 13 times the endurance of similar capacity SSDs. While incrementally higher up-front purchasing costs can dissuade some from choosing SSDs with higher endurance, the increased endurance pays off over the service life of the unit.
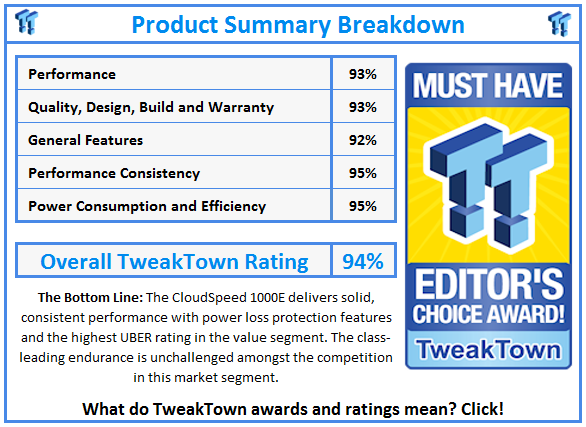
The CloudSpeed also has an impressive 10E18 UBER, and includes the power capacitors and extended five-year warranty. Wrapping these features into a svelte 7mm 2.5" form factor with speeds of 450 / 350 MB/s sequential read/write and 80/20K read/write IOPS for the 1000, and 80/25K IOPS for the 1000E, creates an SSD that delivers well in performance, endurance and reliability.

 United
States: Find other tech and computer products like this
over at
  United
Kingdom: Find other tech and computer products like this
over at
  Australia:
Find other tech and computer products like this over at
  Canada:
Find other tech and computer products like this over at
  Deutschland:
Finde andere Technik- und Computerprodukte wie dieses auf