
Introduction

When we went notebook shopping for a model that accepted both SATA III and mSATA, we had a difficult time. Many of the major notebook manufacturers use mSATA in their popular models, but don't list the open slot as a feature or even its existence. We finally choose the Lenovo W530 for its ability to handle two SATA III 2.5" form factor drives and the presence of an onboard mSATA slot under the keyboard. I have a long time love affair with Lenovo notebooks as well, so that played a role as well.
The Lenovo W530 and its consumer counterpart T530 are not advertised with mSATA. The product specifications don't mention mSATA, the official videos don't comment on mSATA, but you can configure the unit with a cache drive and often times that is code for an mSATA slot.
That said, just mentioning a SSD/HDD cache arrangement doesn't always mean the presence of mSATA, as I found out two weeks ago. Now that I have a number of mSATA drives on hand and one of my daily use notebooks is getting up there in age, I went shopping at the local big box retailers for a new notebook. I actually went out to look at $500 - $700 models and came home with a Samsung 7-Series 17" ultrabook. As advertised in the store, the 7-Series comes with a 500GB HDD and an 8GB cache drive. The advertised specs worked out well because my plan was to replace the HDD with an Intel DC S3700 800GB SSD and replace the mSATA drive with the Mushkin 480GB mSATA. After returning home, I found the mSATA drive was actually an iSSD from SanDisk. A controller and NAND flash combined on a single chip and soldered to the motherboard. Lesson learned, just because a notebook says cache doesn't always mean mSATA.
Over time we'll see an increase in both of these solutions and the inclusion of another, m.2 also known as NGFF. Until Haswell hits the market, NGFF is on the back burner, but till then mSATA leads the performance category, and will expand into even more areas.
A number of desktop motherboards already have mSATA slots, with GIGABYTE leading the way with the most mSATA equipped models. Intel's new NUC platform uses mSATA as well. The mSATA drive in the NUC is the new 525 Series that we're looking at today.
Let's take a look at the specifications and the features of Intel's new 525 Series.
Specifications, Pricing and Availability

Intel does a very good job publishing SSD specifications. The Intel 525 Series is comprised of six product SKUs separated by capacity size. The capacity sizes offered are 30GB, 60GB, 90GB, 120GB, 180GB and 240GB. We have five in the lab and will share our thoughts today.
With such a wide range of capacity sizes, it would be difficult for Intel to release a series wide spec sheet with all the same performance metrics for each model. We've seen other companies do that in the past, but Intel took the time to do it right and educate the public.
The two highest capacity models (240GB and 180GB) share the exact same specifications even though they have a different number of NAND flash chips. The 90GB and 180GB models are the only 525 Series SSD with only three NAND flash chips, the others use four 25nm chips. The claimed performance is 550MB/s sequential read, 520MB/s sequential read. Random IOPS comes to 50K read and 60K write. Further down the capacity scale we found varying levels of performance, but as with most other SSDs, the larger the drive, the better the performance.
Intel's 525 Series uses LSI SandForce's SF-2281 controller and pairs it with Intel 25nm synchronous flash. Intel used the standard 2281 controller and not the new B02 stepping that further reduces power consumption. This caught us off guard since we already have B02 silicon in the lab from other manufacturers. Using reliable and proven controllers is the Intel way so jumping on B02 just because it's new and a little better doesn't fit Intel's model.
The four largest capacity sizes ship with a five year warranty and the 30GB size has a three year warranty. Newegg has stock listed for all six sizes. The 30GB ($59.99), 60GB ($109.99), 90GB ($139.99), 120GB ($169.99), 180GB ($229.99) and 240GB ($289.99) all fail to pass the $1 per GB mark that we like to see. Only a few retail mSATA drives meet that mark and as far as I know the 525 Series is the only retail mSATA drive to use 5K P/E cycle flash.
Intel's SSD Toolbox works with the 525 Series like most other Intel SSDs. This adds to the overall value since the software brings many nice features to the product.

Intel 525 Series mSATA SSDs

We found the same brown box packaging for the 525 Series drives at Newegg. Your drive will arrive in a small brown box with an identification label on the top.

Inside the box we found an anti-static bag with the drive inside a plastic carrier.


Here we get our first look at an Intel 525 Series. The label shows the model number, serial number, capacity size and so on.

All 525 Series SSDs use a LSI SandForce SF-2281 controller and pair the controller with 25nm NAND flash.


The two odd capacity sizes (90GB and 180GB) use only three NAND flash chips to achieve their capacity size.

I can start my own mSATA basketball team!
Benchmarks - Test System Setup and ATTO Baseline Performance
Desktop Test System

Lenovo W530 - Mobile Workstation
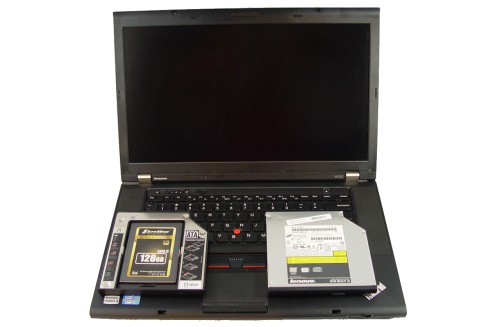
We use two systems for SSD testing. The desktop runs a majority of the tests and the Lenovo W530 runs the notebook power tests as well as the real-world file transfer benchmark.
ATTO Baseline Performance
Version and / or Patch Used: 2.34
ATTO is used by many disk manufacturers to determine the read and write speeds that will be presented to customers.
Intel 525 Series 240GB:

Despite only using four of the eight channels in the SF-2281, the 240GB mSATA 525 Series performs a lot like a 2.5" 520 Series SSD. We nearly broke into the 560MB/s range when reading in ATTO. When writing data to the 240GB drive, we nearly hit 535MB/s, all at QD4.
Intel 525 Series 30GB:

At the other end of the capacity scale, the 30GB 525 Series came very close to 560MB/s as well. The write performance at QD4 topped 391MB/s, which is much higher than Intel's claimed 275MB/s.
Benchmarks - Sequential Performance
HD Tune Pro
Version and / or Patch Used: 4.00
Developer Homepage: http://www.efdsoftware.com
Product Homepage: http://www.hdtune.com
HD Tune is a Hard Disk utility which has the following functions:
Benchmark: measures the performance
Info: shows detailed information
Health: checks the health status by using SMART
Error Scan: scans the surface for errors
Temperature display
HD Tune Pro gives us accurate read, write and access time results and for the last couple of years has gained popularity amongst reviewers. It is now considered a must have application for storage device testing.
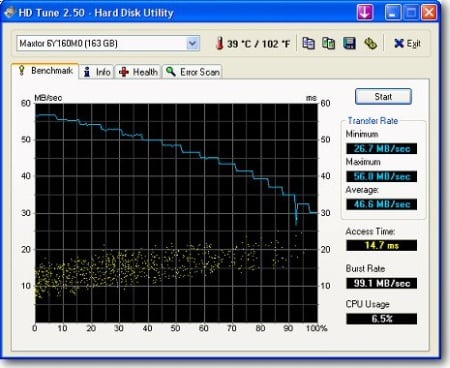

Intel's specifications had the read performance of all the 525 Series products really close to each other and we see that in our first sequential read test.

The sequential write performance was all over the place on the Intel specs, but we didn't find as much variation with the drives right out of the box and when using compressible data. As the drives fall out of FOB state the write speed decreases.
Benchmarks - AIDA64 Random Access Time
AIDA64 Random Access Time
Version and / or Patch Used: 1.60
Developer Homepage: http://www.aida64.com
Product Homepage: http://www.aida64.com
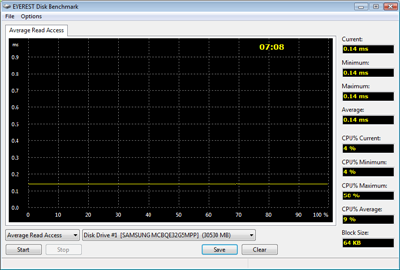
AIDA64 offers several different benchmarks for testing and optimizing your system or network. The Random Access test is one of very few if not only that will measure hard drives random access times in hundredths of milliseconds as oppose to tens of milliseconds.
Drives with only one or two tests displayed in the write test mean that they have failed the test and their Maximum and possibly their Average Scores were very high after the cache fills. This usually happens only with controllers manufactured by JMicron and Toshiba.

The 240GB 525 scored lower read latency when compared to the other 525 Series products. The 525 Series had higher read latency than the other drives on the chart including others using LSI SandForce controllers.
In our testing with 2.5" drives, the higher read latency arrived with later 5-Series firmware. That leads us to believe Intel moved away from firmware based on older 3-Series SandForce firmware.

The write access times stayed in line with older SandForce based drives.
Benchmarks - CrystalDiskMark
CrystalDiskMark
Version and / or Patch Used: 3.0 Technical Preview
Developer Homepage: http://crystalmark.info
Product Homepage: http://crystalmark.info/software/CrystalDiskMark/index-e.html
Download here: http://crystaldew.info/category/software/crystaldiskmark
CrystalDiskMark is a disk benchmark software that allows us to benchmark 4K and 4K queue depths with accuracy.
Key Features:-
* Sequential reads/writes
* Random 4KB/512KB reads/writes
* Text copy
* Change dialog design
* internationalization (i18n)
Note: Crystal Disk Mark 3.0 Technical Preview was used for these tests since it offers the ability to measure native command queuing at 4 and 32.

CDM uses incompressible data and gives us our first look at worst-case scenario performance. The 525 Series 30GB takes the biggest hit and doesn't scale nearly as high as the other 525 drives when the queue depths ramp up.

4K write performance with incompressible data really shows how the performance scales from the 30GB to the 240GB model rather well.
Benchmarks - PCMark Vantage Hard Disk Tests
PCMark Vantage - Hard Disk Tests
Version and / or Patch Used: 1.0.0
Developer Homepage: http://www.futuremark.com
Product Homepage: http://www.futuremark.com/benchmarks/pcmark-vantage/

PCMark Vantage is the first objective hardware performance benchmark for PCs running 32 and 64 bit versions of Microsoft Windows Vista. PCMark Vantage is perfectly suited for benchmarking any type of Microsoft Windows Vista PC from multimedia home entertainment systems and laptops to dedicated workstations and high-end gaming rigs. Regardless of whether the benchmarker is an artist or an IT Professional, PCMark Vantage shows the user where their system soars or falls flat, and how to get the most performance possible out of their hardware. PCMark Vantage is easy enough for even the most casual enthusiast to use yet supports in-depth, professional industry grade testing.
FutureMark has developed a good set of hard disk tests for their PCMark Vantage Suite. Windows users can count on Vantage to show them how a drive will perform in normal day to day usage scenarios. For most users these are the tests that matter since many of the old hat ways to measure performance have become ineffective to measure true Windows performance.
HDD1 - Windows Defender
HDD2 - Gaming
HDD3 - Windows Photo Gallery
HDD4 - Vista Startup
HDD5 - Windows Movie Maker
HDD6 - Windows Media Center
HDD7 - Windows Media Player
HDD8 - Application Loading

Our daily use software reads more than it writes data to the drive. Opening programs, running virus scans, playing back media, these tasks read from the drive more than they write to it.
On the previous page we observed the increased write performance as the drives increased in capacity, but we also observed small file read performance at low queue depths running fairly steady. Here we see what the low queue depth read performance does for our daily use software. All of the drives are very fast for day-to-day use.
Benchmarks - PCMark Vantage - Drives with Data Testing
For a complete breakdown on the Drives with Data Testing please read this article. You will be able to perform this test at home with the files provided in the article - full instructions are included.
- Brief Methodology
SSDs perform differently when used for a period of time and when data is already present on the drive. The purpose of the Drives with Data testing is to show how a drive performs in these 'dirty' states. SSDs also need time to recover, either with TRIM or onboard garbage collection methods.
Drives with Data Testing - 25%, 50%, 75% Full States and Dirty / Empty Test
Files needed for 60 (64GB), 120 (128GB), 240 (256GB)
60GB Fill - 15GB, 30GB, 45GB
120GB Fill - 30GB, 60GB, 90GB
240GB Fill - 60GB, 120GB, 160GB
Empty but Dirty - a test run just after the fill tests and shows if a drive needs time to recover or if performance is instantly restored.

I never imagined testing a 30GB SSD when I built the 15GB block of data for fill testing. The blocks only fit one of the fill slots on the 30GB drive, the orange bar on the chart is the empty but used state.
Benchmarks - Anvil Storage Utilities
Anvil Storage Utilities
Version and / or Patch Used: RC5
So what is Anvil Storage Utilities? First of all, it's a storage benchmark for SSDs and HDDs where you can check and monitor your performance. The Standard Storage Benchmark performs a series of tests, you can run a full test or just the read or the write test or you can run a single test, i.e. 4K DQ16.
Anvil Storage Utilities is not officially available yet but we've been playing with the beta for several months now. The author, Anvil on several international forums has been updating the software steadily and is adding new features every couple of months.
The software is used several different ways and to show different aspects for each drive. We've chosen to use this software to show the performance of a drive with two different data sets. The first is with compressible data and the second data set is incompressible data. Several users have requested this data in our SSD reviews.
QD32 Random Read

Here we scale IOPS by queue depth. Companies like to talk about their maximum IOPS performance and many new SSDs achieve near 100K IOPS when reading and writing. Desktop computers and notebooks rarely get to high queue depths so the IOPS performance we should really be concerned about comes from lower queue depths.
QD32 Random Write

Only a few of our mSATA drives have ran this test so only a few made it to the chart. The Intel 525 Series does well in both tests and the performance scales as the drive sizes increase.
Benchmarks - BootRacer
BootRacer - System Boot Time
Version and / or Patch Used: 4.0
Developer Homepage: Greatis
Product Homepage: BootRacer
Download here: http://www.greatis.com/bootracer/download.htm
Note: In this test we use the Lenovo W530 Mobile Workstation loaded with an operating system and several program files. The data on the drive at the time of the test is 45GB. The second test, 50GB Free, was ran with the drives filled with block data until only 50GB of free capacity remained.

The build out for the notebook test only scales down to 120GB capacity sizes so the 30GB and 60GB are done for the rest of the day.
The boot time remains fairly constant as the drives fill with data. There is always going to be a bit of a slow down as anyone with an SSD knows, but the SandForce architecture doesn't store as much data on the NAND as is written to the host. The end result is higher performance over time with less fatigue.
Benchmarks - DiskBench
DiskBench - Directory Copy
Version and / or Patch Used: 2.6.2.0
Developer Homepage: Nodesoft
Product Homepage: DiskBench
Download here: http://www.nodesoft.com/diskbench/download
Note: In this test we use the Lenovo W530 Mobile Workstation and a SuperSSpeed S301 SLC 128GB SSD to move a 15GB block of data to and from the target drive. This is part of our real world test regiment. Roughly 45GB of data resides on the target drive before the '15GB Block' is transfer. The 15GB Block is the same data we built for the Data on Disk Testing and is a mix of compressible and incompressible data.

We've covered the consistent read performance of the 525 Series and how it stays fairly straight across the range of products and as well as the scaling write performance. Here both of these topics return as we move data to and from the drives.
Benchmarks - Power Testing
Bapco MobileMark 2012 1.5
Version and / or Patch Used: 2012 1.5
Developer Homepage: http://www.bapco.com
Test Homepage: http://www.bapco.com
MobileMark 2012 1.5 is an application-based benchmark that reflects usage patterns of business users in the areas of office productivity, media creation and media consumption. Unlike benchmarks that only measure battery life, MobileMark 2012 measures battery life and performance simultaneously, showing how well a system design addresses the inherent tradeoffs between performance and power management.

There is a very interesting battery life test here that we don't get to show very often. I have to bring you up to speed first, though.
The MyDigitalSSD BP4 controller is the current battery life champ in the 2.5" form factor. It will remain there until a Team SandForce partner bring a B02 controller to market. Interestingly enough, as I type this, I'm testing another B02 early sample in my test rig. Anyhow, lower power at idle and in use doesn't always equate to longer battery life in this test and in the real-world.
Let's look at the next chart.
PCMark Vantage HDD Tests - Power Draw

Here we see a power trace, the amps pulled during a PCMark Vantage run. MDSSD's BP4 uses less power at idle and less power under load than the Intel 525 Series 240GB. In the battery life chart, the Intel 525 Series 240GB outperformed the MDSSD BP4. The reason for this is disk busy time. You have to average the amount of power drawn for the entire time the system is on the battery. Since the 240GB 525 Series is faster, it's active less. The BP4 on the other hand is slower and it has to run at the higher power state for longer to accomplish the same tasks.
This is the first time since we started testing SSD power that we've been able to show this point crossing over. The Vantage run takes around 15 minutes and there are 2800 samples so it's difficult to show the affect here, but the battery test with these two drives takes around 290 minutes (for the 240GB 525 and 288 minutes for the BP4). The battery life test also spends more time writing data to the target drives than Vantage. This is why we chose to use this form of power testing instead of just listing maximum, average and minimum power draw. All of the mSATA drives were tested with the appropriate 3.3v power and not 5v thanks to Intel helping us modify a 2.5" to mSATA adapter.
To help with any confusion, the BP4 2.5" is much faster than the mSATA version. Even though the 2.5" uses 5v and the mSATA uses 3.3v, you get better battery life from the 2.5", also due to disk busy time.
Final Thoughts

Even after m.2 (NGFF) comes later this year, the mSATA standard will live on. There are thousands of devices on the market that already with mSATA and manufacturers are not going to abandon the standard. mSATA will live on and be more popular than ever as more companies release small form factor PCs. We've seen several tiny systems come through our email box and Intel even has its own NUC project as well. These reasonably priced small form factor systems are about the size of a home network router, too small for 2.5" drives.
The Intel 525 Series isn't flash, it doesn't ship with a decked out accessory package and it's really not all that exciting. We've seen mSATA drives before and many with LSI SandForce controllers. The 525 Series is a product that gets the job done and comes from one of the most reliable SSD manufacturers in the business. The existing Intel SSD software tools seamlessly work with the 525 Series making this new series an extension of the 2.5" 520, one of the very best, most reliable SSDs on the market today.
Intel did impress us with its wide capacity range for the 525 Series. 60GB, 120GB and 240GB are common in the mSATA market, but Intel also brought 30GB in and it works well for embedded device and has the potential to be a potent cache drive. The 90GB and 180GB capacity sizes fill price points previously open.
The 525 Series does come at a higher price than most of the other mSATA drives we've tested, but we've yet to run across another mSATA drive with a five year warranty, 5K P/E cycle flash and of course Intel's lengthy validation process. Add on the deluxe Intel SSD Toolkit and all of these factors should help you absorb the additional amount needed to purchase a quality Intel SSD.

 United
States: Find other tech and computer products like this
over at
United
States: Find other tech and computer products like this
over at  United
Kingdom: Find other tech and computer products like this
over at
United
Kingdom: Find other tech and computer products like this
over at  Australia:
Find other tech and computer products like this over at
Australia:
Find other tech and computer products like this over at  Canada:
Find other tech and computer products like this over at
Canada:
Find other tech and computer products like this over at  Deutschland:
Finde andere Technik- und Computerprodukte wie dieses auf
Deutschland:
Finde andere Technik- und Computerprodukte wie dieses auf  Fallout 76's player base might primarily be on console
 FCC restores net neutrality
 The Apple Vision Pro's marketing chief has left Apple after 36 years
 The fourth season of the popular Apple TV+ show Trying has its first trailer
 Watch the trailer for Apple TV+ docuseries Hollywood Con Queen Right Here
 ACEMAGIC AD08 "Core i9 11900H" Mini PC Review
 Lenovo ThinkPad X1 Carbon Gen 12 Review
 ASUS ROG Swift Pro PG248QP Gaming Monitor Review - Frames, frames, and more frames
 FlexiSpot C7B-Mesh Ergonomic Office Chair Review
 Samsung G8 34-inch QD-OLED Gaming Monitor Review - 175Hz for $900
 ASRock NUCBOX-155H Mini PC Review
 NuPhy Air96 V2 Wireless Mechanical Keyboard Review
 TEAM T-FORCE Siren DUO360 RGB Liquid CPU Cooler Review
 AVerMedia Live Streamer ULTRA HD Review
 AVerMedia Live Gamer 4K 2.1 Review
 Building the Ultimate Home Entertainment Server with an ASUSTOR NAS and Viper Gaming NVMe SSDs
 Everything you need to know about the latest ASUS NUC Mini PCs - NUC 14 Pro and ROG NUC
 How to Overclock Your GPU and Boost Your PC Gaming with ASUS GPU Tweak III
 ASUS's AMD Radeon RX 7000 Series GPU lineup has something for every gamer
 ASUS OLED Premium Care defends the ROG Swift OLED PG32UCDM gaming monitor from burn-in