Introduction
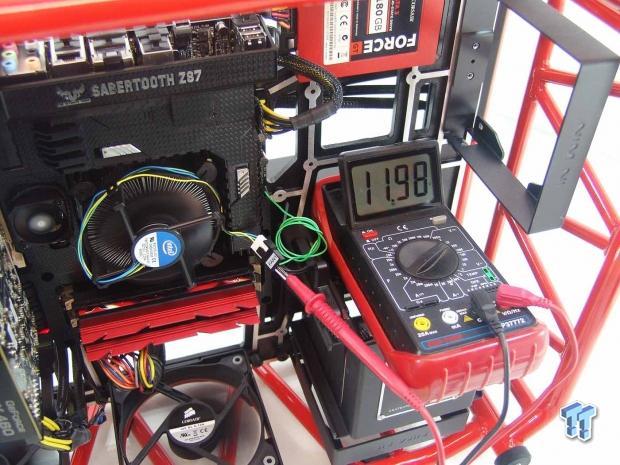
Just like with the surge of twin tower coolers and all of the various AIO coolers that are now on the market, the hardware that needs to be cooled by it seems to get revised just as fast. This means that while our Intel 2600K CPU based test system is still a valid system to use, as I would bet there are quite a few readers still using systems of that age or even older. Here at TweakTown we like to stay on top of the latest and greatest that everyone has to offer. With the introduction of the mainstream Intel Haswell processors, we thought it had been a couple of generations of Intel processors, and was time for us to make the leap to a new test bed system for all of these new coolers that are flooding the market.
Since the days of the older system, there have been a few advances in the way the processors are designed, and these changes make cooling the newer CPUs a much tougher job than it had been previously. First off is the way the Haswell CPU has power supplied, and how it uses the voltage once it is inside of the CPU. The second thing that will make manufacturers of CPU coolers shiver in their boots is the introduction of the AVX 512 that will make any cooler I have yet to test buckle under the stress.
Therefore we have tested many applications, many coolers, and in every way we could think might have an impact on the coolers ability, and have devised a system of testing that is new to our readers, but on that same note, is something that anyone could do at home and reproduce, as long as all the variables match what we are using.
The overall idea here is to show the system we will be testing with, along with how we got to that conclusion. You will be seeing images of all of the hardware with brief explanations of why we chose those components. You will also be given all of the steps and conditions surrounding the testing system, and why we do what we do to fill the charts with results for you to find the best CPU cooler for your needs. I will also be providing some of the older coolers in the new charts as a marker for you to be able to judge all of the other coolers I tested.
This way we can move forward with some relevance to the older charts, and not just leave all of them in the dust with no real way to see how all of the older coolers would stack up to today's new computing hardware as well.
The Test System Components
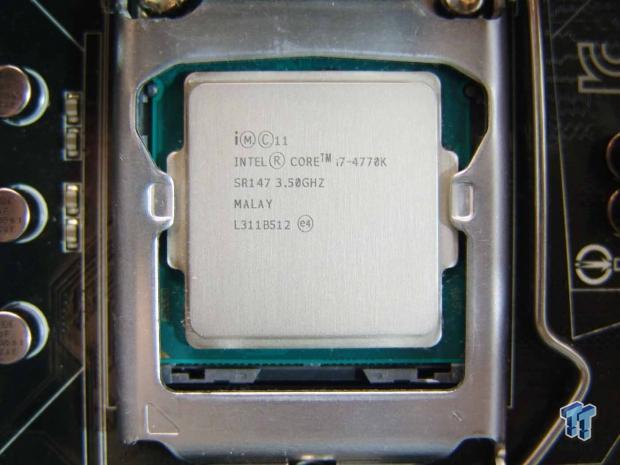
The main, and most important component of the new test system, is the retail version of the Intel i7 4770K. You can see that batch number of the CPU, but many out there will tell you it's far less relevant to the overclocking potential than on any previous series of processors. As far as 4770K processors go, we definitely found a top-end chip to use in this system.
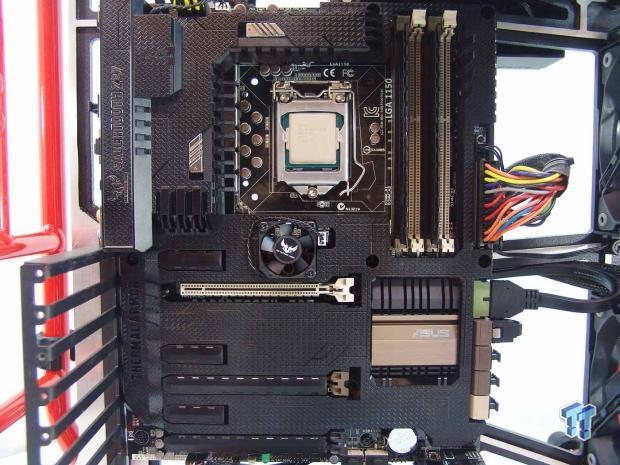
We of course needed a motherboard to run the 4770K, and we went to ASUS for this. While we had originally asked for the Maximus VI Extreme, after some discussion back and forth, we opted for the Sabertooth Z87, which you are looking at now. Reason being is that the board in the image offers many thermal sensors in the motherboard as well as an extra three sensors that we can attach anywhere we want to. As for the Tactical Armor, it will be left in place for testing, but we have found that some coolers will have to mount differently just to fit the Armor on both the top and bottom of the motherboard.
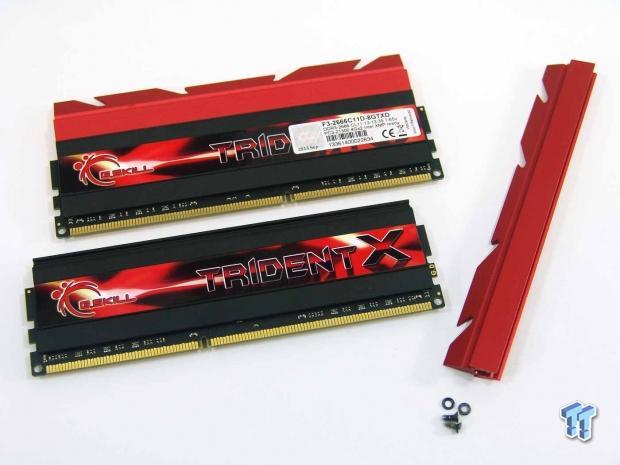
We also originally contacted Corsair to supply some memory for this system, but we had since found that the Vengeance Pro series of memory has heat spreaders on them that caused issues with some of the cooler mounting. Instead of making them naked and taking the risk of ripping an IC from the PCB, we decided that the G.Skill kit was much better suited for our needs, both in speed capabilities to work the IMC of the 4770K, as well as having the removable tops to allow coolers to pass over the top.
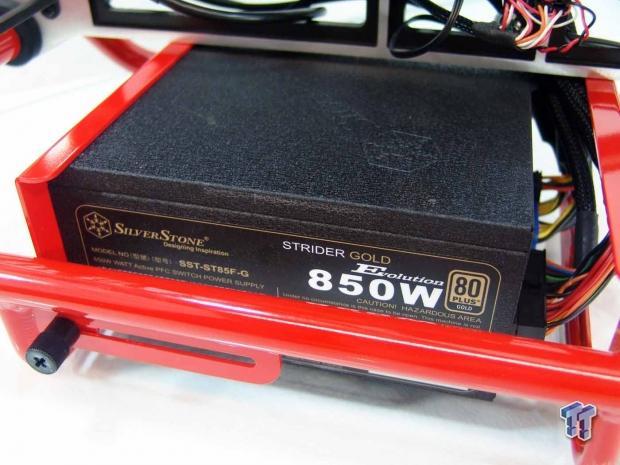
To power the system we stuck with the same SilverStone PSU that has given us two years of dedicated and unwavering service. We chose the Strider Gold Evolution in the 850W flavor so that we would have plenty of power, could take advantage of the wiring modularity to keep things clean, and due to the fact that it is more than enough power for our needs, so we should never stress this PSU beyond the scope of its 80 PLUS Gold rating.
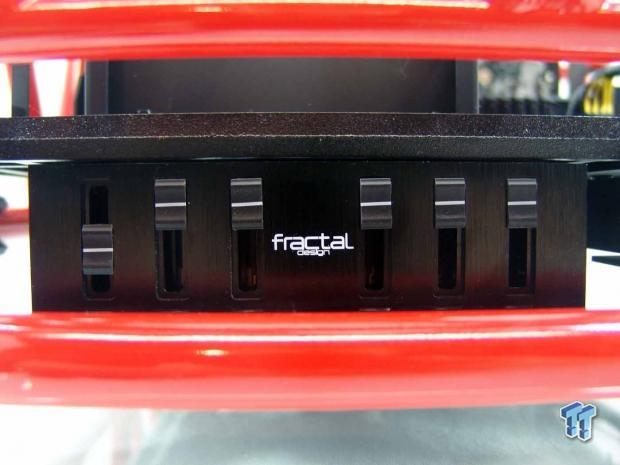
For finite control of the fans of the CPU coolers in our testing, we opted to slide the Adjust 108 from Fractal Design into the ODD bay. The reason behind this is so that we can set the fans speeds outside of the BIOS to ensure that there is no oddities or adjusting going on during tests. With the capability of 36W per channel, and the fact that this will allow fan adjustments from 6.75V to 11.98V, it will suffice for our needs quite well.
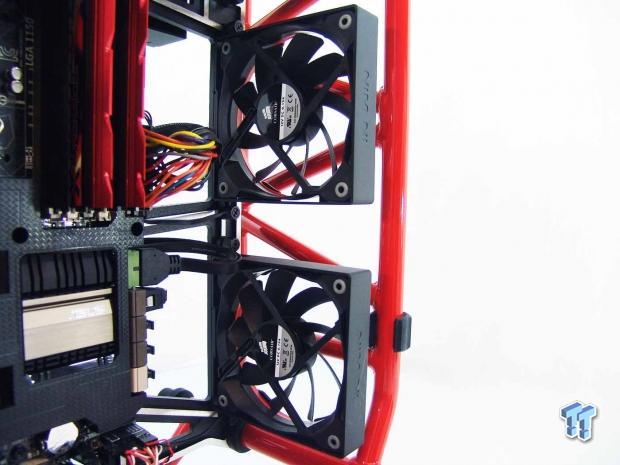
Not necessarily a component that is vital to the functionality of any of the others, we have also installed a pair of chassis fans this time around. The older testing was done on the X-Frame from InWin, and it provided no such love to the design. With the newer D-Frame now in play, we added a pair of Corsair CO-9050002-WW, AF120 Quiet Edition fans. There were two reasons for this choice. One was the super low noise level of 21dBA that will allow these fans to spin in near silence. The second and most important was to provide some airflow to the chassis much like a normal tower chassis would have, as well as giving large passive solutions a better chance in our charts.
Software and Settings
Testing is a really simple matter, and I planned to make it so anyone out there can replicate my results with just a few downloaded applications. First you will need CPU-z 1.66.1 to confirm the processor speed and voltage, as well as confirming the memory speed and timings. Something else that is now incorporated is a cache or ring bus speed that is addressed in CPU-z as the NB speed in the memory tab.
Next we decided that to follow the thermal results, RealTemp 3.70, as it is likely the most accurate measuring tool of the actual core temperatures inside of the CPU. To read the fan speeds and thermal probes, we have chosen to use AIDA64 3.00.2590 because it was the latest release when the test system was built. On a side note, we will not be updating any of this software for the entirety of this test system to take out any variables or additions that may cause a fluctuation in our results.
All of our testing is done at 24C with a degree margin of error (23.5C to 24.5C is allowable) and the humidity is controlled between 40 - 50%, both in winter and summer testing.
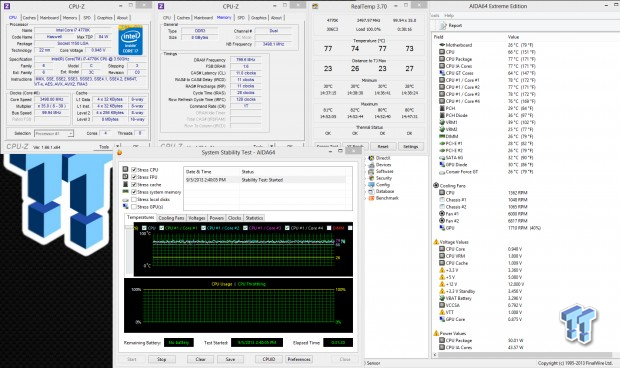
What we will be addressing as the "stock" level of the cooler testing is more of a plug and play concept. The theory here is to see how the CPU cooler in question will perform out of the box, using everything it was designed to do, to try to maintain a comfortable level of both temperatures and noise with the use of Speed Step, C-States, and PWM control of the fans (when applicable). This gives an idea of what the cooler is capable of under conditions that a lot of our readers will be using the coolers, and will provide a base number to get an idea of the coolers efficiency to rid the CPU of its heat.
At this time we will be using a profile in the motherboard to be sure that this level of testing is always exactly the same. In this profile, we left the fan controls set to allow the PWM control of the fans speeds, and the only thing we changes was the voltage supplied to the CPU. Instead of letting the motherboard fluctuate this voltage, we will be using the solid and stable voltage of 0.95V, while the CPU runs at 3500MHz with all cores active.
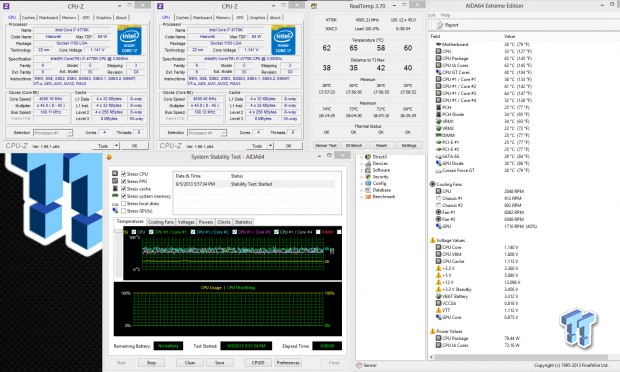
As for other things in this level of testing that will play a part in the thermals we track, the memory is running at 1600MHz at CAS 11 (default memory SPD values). The VTT is automatically set to 1.016V and the System Agent voltage is resting at 0.816V for all of the stock level testing we do. As for the results in the image, this is what we saw with the stock Intel cooler that was provided with the 4770K, and you can see why the right CPU cooler is so important with these new processors.
For the "overclocked" settings, even here things are very easy to set up. Going back to the BIOS we changed to manual settings for the overclocking, but only needed a couple of steps to get my settings stable. First thing I did was to set the multiplier to 45. The reasoning behind why we stopped here was twofold. First there is the amount of heat that gets produced when overclocking these processors. The second and more important reason for us was that this is the average overclock achievable by most 4770K CPUs. Once the CPU speed is set, we then addressed the memory by activating the XMP profile allowing the sticks to run at 2666MHz at CAS 11. The last thing to do is to find the baseline for the CPU voltage to be able to be stable in all testing we can throw at it before we ever moved into the actual testing. We have found the voltage at this level to be fully stable at 1.140V with the CPU speed set to 4500MHz and the Ring Bus sitting at 3900MHz. Again we set this to a profile so we can just flip back and forth between stock and overclocked conditions, and as long as the ambient temperature and humidity is similar, we can replicate these results time and time again.
Stock Fan and Thermal Testing
Now that we have our profiles set and we are ready to get some testing done with this system, it is time to discuss how we achieve the results that we report. After applying thermal paste to the cooler in question, we plug the fan into the Adjust 108 and allow the fan or fans to run at full speed for an hour prior to any testing to allow the bearings a bit of time to break in to maybe allow better speeds, or possibly even silence the bearing a bit for better audio results.
To obtain the base sound level, we then take the slider on the Adjust down to 7.5V then record what is presented in the charts. Once that is completed, we move the fan power plug back to the motherboard as the "stock" profile for this system allowing the motherboards PWM settings to change the fan speed as needed. It is at this point that we let the system idle for 15 minutes and open all of the software and place it around the desktop.
The last thing opened is RealTemp, and even here there needs to be about 30 seconds of time to find the lowest numbers for idle results. We still will not report the idle temperatures in a chart, but it will be discussed in each review. This is also where we obtain the base RPM, or in the case of any water cooling including AIOs, the pump speed and noise level is also recorded.
At this point we take a screen shot for reference, and average the four core temperatures that are found in RealTemp for our final result at this level. It is at this time that we do record the audio levels for the "Sound Pressure Level - 7.5V" chart.
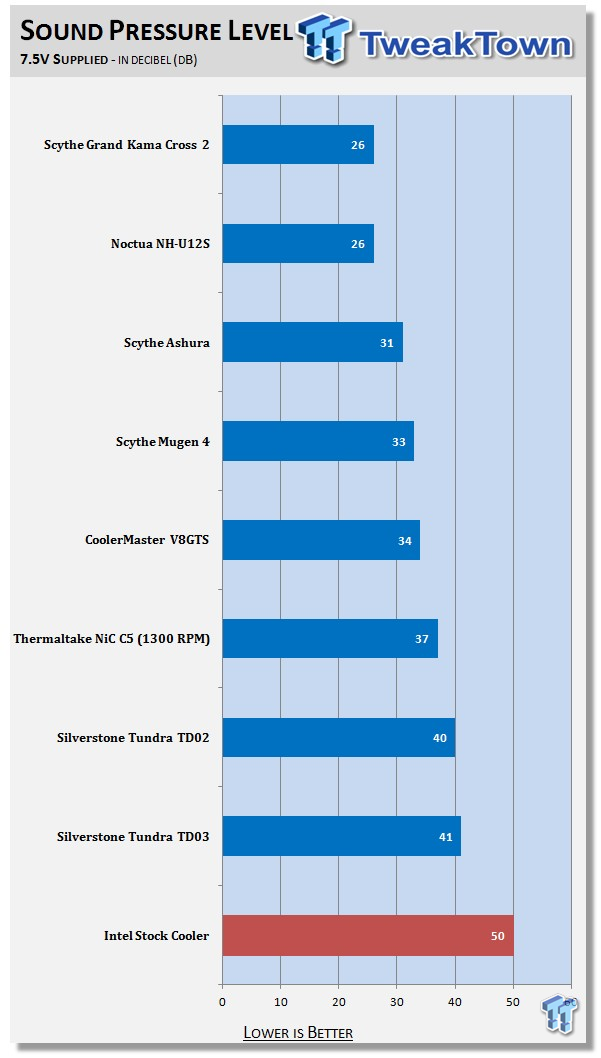
Since we tested the older system in the same fashion, even getting the trusty meter back out to verify, all audio results were very similar, if not the same as they were before, and we added the Intel stock cooler with a red bar for reference.
To obtain the "load" results for the stock settings, it is then time for AIDA64 to come into play. It used to be that we used Intel Burn Test, but with the new advanced instructions that are available in its code, the level of heat produced from this sort of testing is almost uncontrollable for any CPU cooling solution, even with water it is tough. This is why we chose AIDA64's System Stability Test. AIDA64 has these instruction sets as well, but you need to change things around to make them work the CPU like IBT would. In our testing, the test is opened and run in its default configuration. This means that Stress CPU, Stress FPU, Stress Cache and Stress System Memory are all checked. In this configuration, you will find something that is very close to what an intensive gaming session would show, and is why we decided this setting of the test is more appropriate.
After 30 minutes of testing with the D-Frame in the standard ATX configuration, we again take a screen shot for reference, average the individual maximum core temperatures, and report these findings in what is labeled the "Temps - Stock" temperature chart.
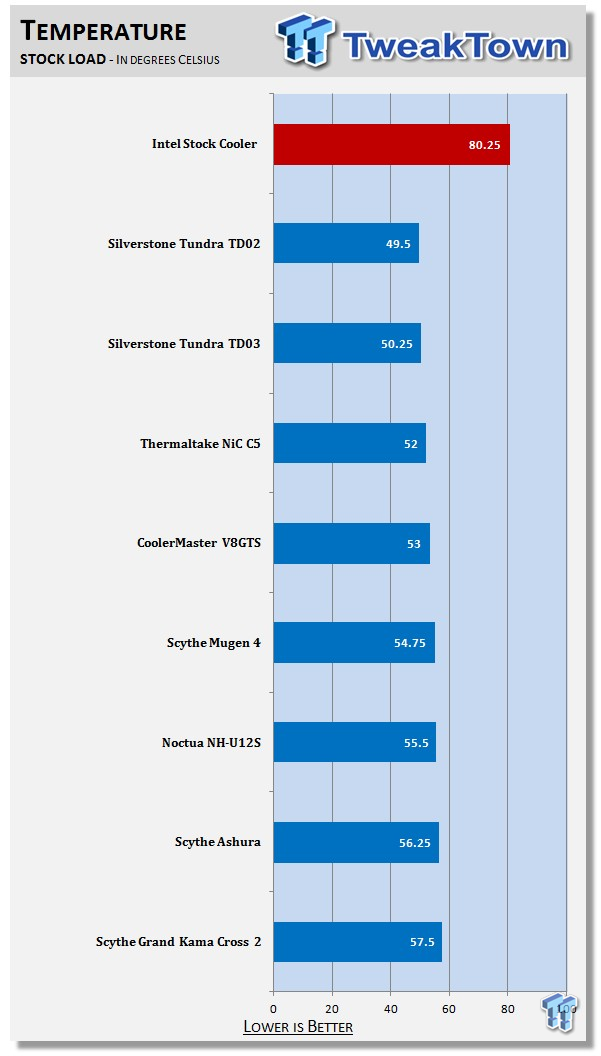
These are the stock results of the Intel stock cooler and a few others I have brought from the last system over to the new system to provide some relevance to my older charts that were tested on the 2600K based system. I have also set the stock cooler at the top with a red bar as reference to just how far away from those results the good coolers really are.
Overclocked Testing

Once the stock testing is completed, we jump into BIOS, swap out to the overclocked profile, and boot the system. At this point the fan is again connected to the Adjust 108 to receive full power the entire time for this round of testing. To verify the fan RPMs, or even a pump for that matter, we simply add a wire to the third pin of the fan connection and run it to the motherboard's fan connections to allow AIDA64 to show us the RPM of the fans and pumps.
We then continue with the same 15 minute idle period to allow the system to cool down sufficiently from the last run. It is at this point that we look at the thermals to obtain the result we will discuss for idle when overclocked, but again, that metric will not show in any charts. We also pull out the meter and gauge the audio levels with the fans at their maximum RPM.
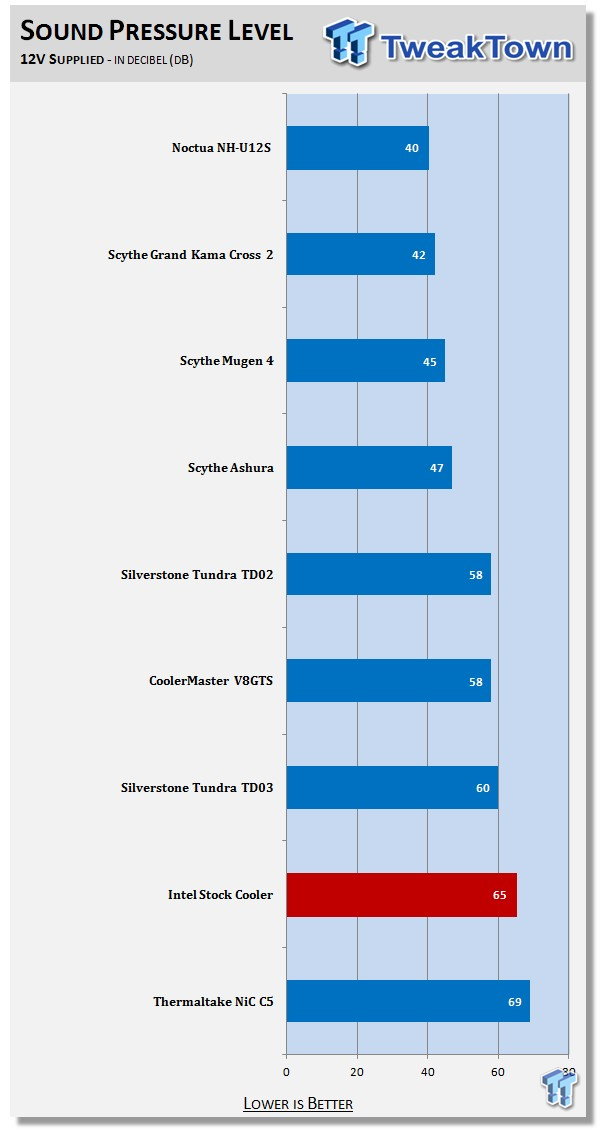
As a result of the testing, we now have this as our new Sound Pressure Level - 12V chart. Again we will always have the stock cooler marked in red.
We then run AIDA64 just like when we were testing for the stock levels, just that this time around the processor is much faster, and with the memory at 2666MHz, the IMC is also working hard. After 30 minutes of testing, we grab a screen shot for reference, but there is still a bit more to our methodology. Before taking the average of the results displayed in RealTemp, there is more to think about.
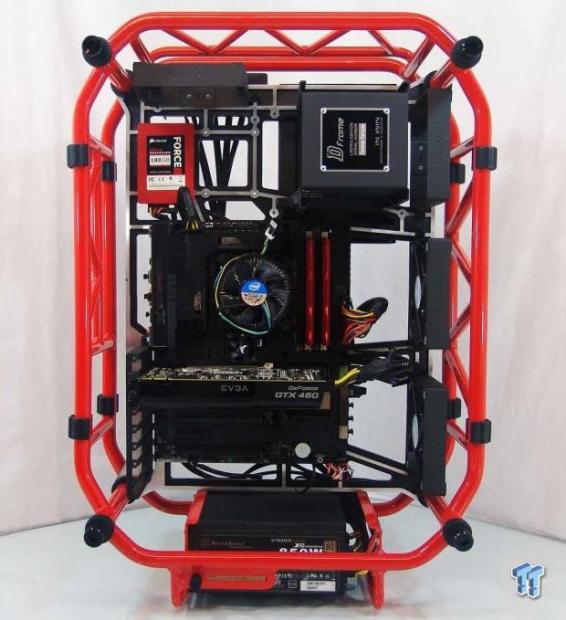
Since the chassis is positioned like this from the plug and play stock results that we record, the ATX orientation of the D-Frame when sitting on the PSU is only one way we test all coolers that hit our labs.
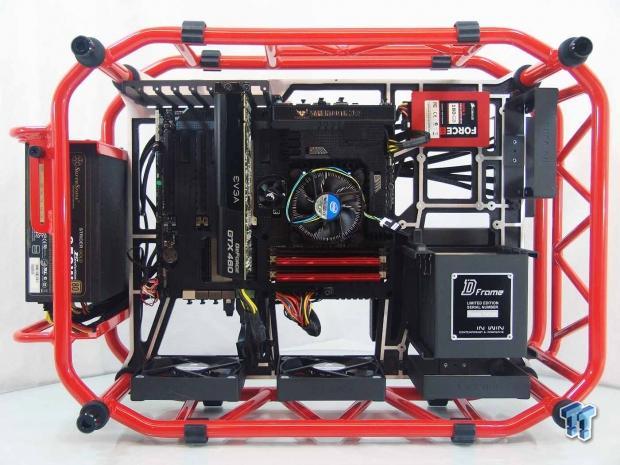
Since this chassis as well as many SilverStone choices out there have a 90 degree orientation of the motherboard, and they offer a bottom to top flow of air, so we also run a series of tests in this position.
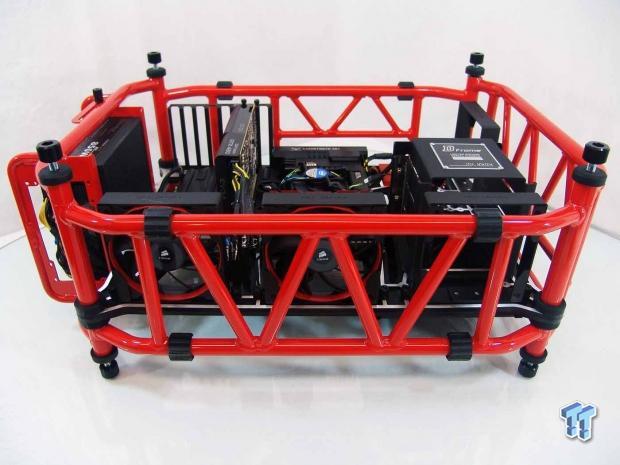
Then there are open air systems like the one housing this system, as well as HTPCs, and others that use a flat layout for the motherboard. That means we also take this orientation into consideration in our many runs.
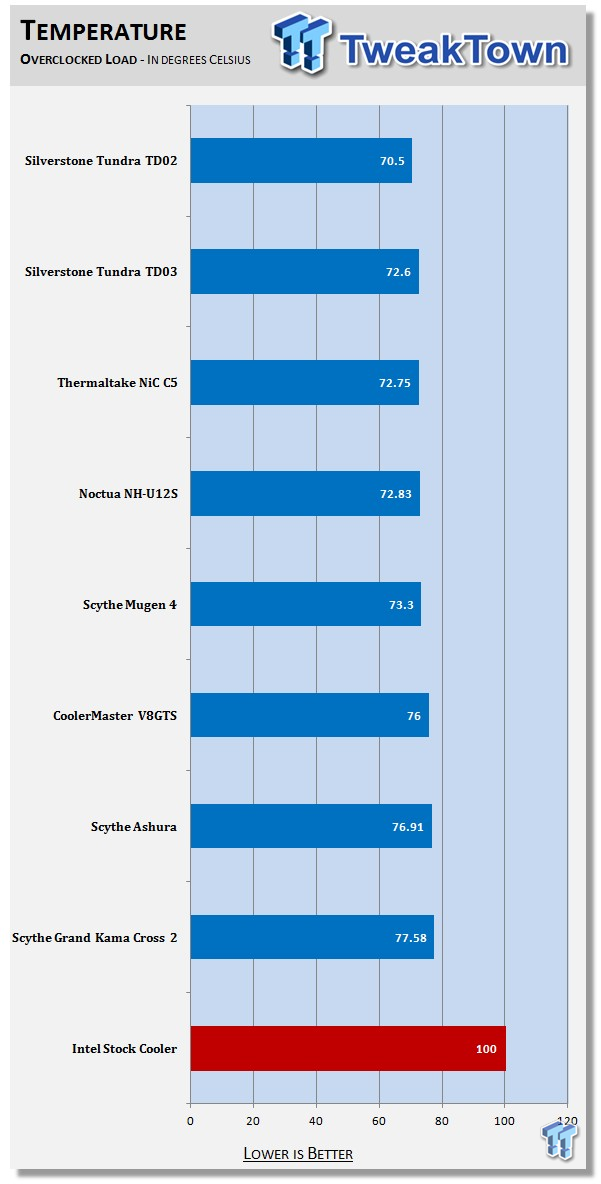
Once all three tests are run twice with a different application of thermal paste between each set of three passes, we not only take the average of each run, but we also then average all six testing sessions to come up with the thermal results that are listed in our Temperature - Overclocked Load chart that is shown here.
Final thoughts
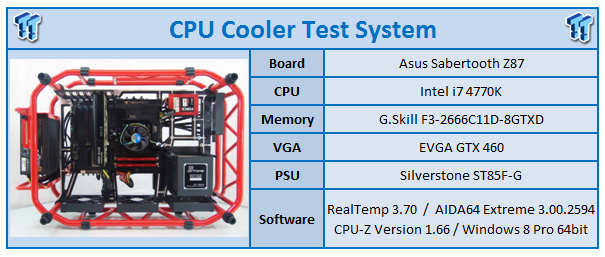
Of course we also will need to update the test system chart that will be found in all the new reviews as well as a special thanks to all of the new companies that came together to put this system together and allow us at TweakTown to stay relevant and bring you the most updated information to make a much more wise choice to cool today's processors.
This brief summary of our testing methodology and the sneak peek at the new charts show you that cooling these new processors is very serious business if you plan to overclock your processor. Considering there are some manufacturers out there revising coolers that were originally designed years ago and just got updated hardware, I believe those type of companies will slowly be weeded out as near incapable of handling what these new processors can push. You can see that even with the AIO testing, while it is an improvement over standard air cooling solutions, there is a hefty price premium to consider for only two and a quarter degrees between the best AIO and the best air cooler on the charts.
Hopefully you can better understand the reasoning behind this methodology, and why we took such great lengths to pay attention to orientation, and added chassis airflow to offer the cooler a secondary source of air, instead of it sitting alone in the D-Frame doing all the work itself. This way, even with the open air system, you get a sense of how they should do inside of a normal chassis, with such air flow being provided in them. Also the orientations bring other things into play like the weight of the cooler, and if the hardware is secure enough to allow similar results in all orientations. If there is instances where the thermal results show that maybe a certain cooler is lacking in some way, or which orientation performs the best, these things will also be addressed in the reviews as well.
As of this moment this concludes the aspects, reasoning, methodology, and the lengths we go to while delivering our readers more of what they need to know and less of the marketing babble that may sway you when looking at the cooler in a store. As we get more coolers arriving at the labs, you will soon see that those companies that aren't always innovating something new will be left on the side of the road as the coolers that have all their ducks in a row will sail on past them with this new testing system.
Let this be a warning to both my readers and my review sample suppliers, all coolers are not created equal. As the enthusiast market continues to change, the cooler that will leave you comfortable with the results provided are going to become fewer and fewer, until there is some sort of work done to use new materials that are affordable to the masses and can take us to the days of the TRUE, and huge thermal gains to be had from a new idea in cooling.
I really hope that day comes soon, and that I am still here to provide you with that information when it does happen.


 United
States: Find other tech and computer products like this
over at
  United
Kingdom: Find other tech and computer products like this
over at
  Australia:
Find other tech and computer products like this over at
  Canada:
Find other tech and computer products like this over at
  Deutschland:
Finde andere Technik- und Computerprodukte wie dieses auf