
Introduction

Up until now we have observed SSD manufacturers quoting different performance numbers for each capacity size in a product line. The most obvious came in 2009 when some manufacturers listed as many as four distinct performance envelopes in their Indilinx Barefoot products with all divided by capacity. The Indilinx Barefoot products weren't the only ones listing footnotes about performance, Intel had a few of their own as well.
There are many reasons why smaller capacity drives can be generally slower than higher capacity drives. Without boring you with technical details, we will just briefly touch on technical side. The first possible reason a smaller drive performs less than a higher capacity drive can be linked directly to the flash memory itself. Some smaller drives use smaller flash memory that does not perform as well as larger capacity flash. The next issue and what we saw mostly in 2009 and early 2010 were smaller than 128GB drives that were using less of the available channels on the controller. You can think of these channels as being like Serial ATA (SATA), a point to point connection, just this time between controller and flash memory. If you reduce capacity simply by reducing the number of memory chips, then most likely you are not able to run all of the channels available in a controller.
The Intel V Series is a very good example of this. If you go back through the SSD reviews where we took the drives apart, you can see that some of the 64GB drives had open spots on the PCB that were not occupied by flash. The 128GB drives used all of the available PCB openings and the 256GB drives double stacked the flash. At that point you can think of each available spot on the PCB as being its own IDE connector with a master and slave. The tech doesn't come out to that exactly, but you can kind of get the picture this way.
So here we are in 2010 and there are two players on the enthusiast field at this time, Marvell and SandForce. We have already shown that even though the Crucial RealSSD C300 (that uses the Marvell controller) has a blazing fast read speed for both the 128 and 256GB capacity sizes, the write speed changes with the capacity. We will be able to see this in the benchmark performance charts today, but if you want a full breakdown with all of the details please be sure to read our review of the Crucial RealSSD C300 128GB.
Let's take a look at the Vertex 2 specifications, get in some pricing information from our sponsor MyDigitalDiscount.com and get started with testing.
Specifications, Pricing and Availability

OCZ Technology has a hand full of products that use the SandForce SF-1200 controller. The Vertex 2 line is the flagship consumer model and enjoys a special firmware that allows for higher 4K IOPS than the baseline model, the Agility 2. Looking at the spec sheet for the Vertex 2, we can see that the marketing literature refers to this as 'Max IOPS Firmware." You can read a full review of the OCZ Vertex 2 100GB model here at TweakTown. We also covered the new extended capacity Vertex 2 E 120GB model.
Keeping with the subject, we see on the specifications sheet for the Vertex 2 line that all eight available models that range in capacity from 50GB to a massive 480GB share the same read and write specifications, 285MB/s and 275MB/s.

To illustrate why matching performance claims of the SandForce SF-1200 controlled Vertex 2 through the capacity range was so interesting to me, I present the specifications for the original OCZ Vertex, an Indilinx Barefoot controlled drive. Here we see that performance in 2009 was all over the place, but the peak performing drive was the 128GB model with 250MB/s read and 180MB/s write claimed speeds. The performance envelope of the 32GB Vertex was quite different. OCZ accurately claimed read speeds of 230MB/s and write speeds of 135MB/s. If you read a review of the 128GB model, the one most commonly used in testing, but you only had the funds to purchase a 32 or 64GB model, you might have been in for a bit of a surprise without researching the purchase beforehand.
I should point out that even with such a large peak difference in data throughput, the 32 and 64GB drives still had access times much lower than any traditional platter based drive. For most users it is the access time that makes SSDs so much faster than traditional drives. You can build a RAID array of traditional platter drives and get throughput numbers that put a single SSD to shame, but when it comes to real world daily use a SSD would still feel 20 times faster. The lower access times and ability to read and write small files faster because of the access time is really where the "feel" of a fast system comes from. No other single component in your system can be upgraded, not the processor, video card nor memory and give you the same feel of a speed increase than swapping a platter drive to an SSD.
I am going to try and pull this off and not sound like a paid advertisement, but it will be difficult since I am a fan of My Digital Discount. I will go ahead and interject that I am not paid by them, nor am I even keeping the drives they provided that allowed this article to take place. I know Matt and Doug on a personal level and we all speak a couple of times a week. I wouldn't give them this free publicity if I didn't believe in what they are doing.
That said, MyDigitalDiscount.com is in a sense the Walmart of SSDs. They buy large and look to move high volumes of products by offering the products at a much lower cost. In many cases their margins are not more than the cost of lunch per sale. Another well known company used to work this way a few years ago, but has since started to push for higher profits on the most in demand items, usually exactly what TweakTown readers are looking to purchase. Just to be clear, a company's business model is their business and they can choose to run their company how they please. As a consumer with a mortgage, car payments and kids, I am looking to keep as much of my money as possible while still consuming the items I want. I am looking for the best deal and that is where My Digital Discount comes in.
At the time of writing My Digital Discount and OCZ Technology joined forces to bring you SandForces - 4 - less. That was my cheesy line and not theirs.
Right off the bat My Digital Discount has the lowest prices on the extended capacity Vertex 2 drives. Those prices are 60GB (184.99), 120GB (344.99) and 240GB (649.99). OCZ Technology has sweetened the deal with a 20 Dollar mail in rebate for the 60GB model (after MIR price, 164.99), 25 Dollar MIR for the 120GB (after MIR price, 319.99) and 30 Dollar MIR for the 240GB (after MIR price, 619.99).
To put these figures into perspective, the Newegg price on the OCZ Vertex 2 120GB model was 354.00 at the time of writing and it was out of stock. So right from the start you are saving 10 USD with MDD and after the MIR round 35 USD. At my house that is a couple of Transformer toys for my boys or enough for my wife and I to hit a movie together, like at the theater and not at home. Not only would I be able to get the fastest consumer SandForce SF-1200 drive on the market to speed up my computer system, but I would also get to be the hero for the weekend by taking the wife to see some romance movie that she wanted to see. There are some nice rewards that come with that as well. Cloud 9 times two, something like that.
The OCZ Technology Vertex 2

It's a Vertex three way, and we were just talking about Cloud 9.

Here we see the two extremes, the 60GB Vertex 2 on the left and the 240GB on the right. On this side of the PCB we can see that the two drives look identical. The same PCB is used for both; this is what I refer to as the Super Cap PCB since it is the same one that went out with the SF-1500 enterprise drives that use a capacitor on the other side, part of the 1500's enterprise feature set. We will have a full review of the revised and now headed to retail Vertex 2 Pro in a few weeks if all goes as planned.

These two drives are identical for the most part. I had to keep the aluminum cover with each PCB or I couldn't tell them apart. This is the 60GB model.

The 240GB model is shown here. The only difference we could see on this side was the model number on the flash chips. With both drives using 16 total, it only makes sense that the flash model numbers would be different.

On the back side of the PCBs we get confirmation that both models do in fact have 16 NAND flash modules. This means that the full channel capabilities of the SF-1200 are used on both the 60 and 240GB model. Since I had already dissected the 100 and 120GB drives in previous articles, I can say for certain that they also use the Super Cap PCB and 16 flash modules.
Now that we have seen the inside of the Vertex 2 drives from top to bottom, it is time to verify if the 60, 100, 120 and 240GB drives all share equal performance.
Test System Setup and ATTO Baseline Performance

We would like to thank the following companies for supplying and supporting us with our test system hardware and equipment: AVADirect, GIGABYTE, Cooler Master, LSI and Noctua.
You can read more about TweakTown's Storage Product Testing Workstation and the procedures followed to test products in this article.
Today we will be presenting performance data for four OCZ Vertex 2 SSDs in different capacities. There was one small difference between firmware on the drives. The 100 and 120GB were tested with early firmware while the 60 and 240GB drives used MP1 firmware like what you would get on your drive from My Digital Discount right now. This article was sponsored by My Digital Discount, the low cost SSD supplier that can make you a hero. In all seriousness, go check these guys out. They sell more than just solid state drives and use the same sales model for nearly all of their products.
For comparison products we changed things up a bit today to simplify things. Instead of showing you the performance of ten to twelve drives, we cut it down to the four OCZ Vertex 2 drives supplied by My Digital Discount and will be presenting that data up against an Intel X25-M G2 80GB. The last drive in the charts is the fastest SATA 6G platter drive on the market, the Western Digital VelociRaptor 600GB.
I heard from more than a few of the readers when I said in the VelociRaptor 600GB review that I was underwhelmed by its performance. In that review I didn't post any SSD numbers since I typically don't like showing platter drives against SSDs; you will see why today. Since this isn't really a review of anything other than Capacity vs. Speed differences with the Vertex 2 drives, we will have a little fun at the same time and show some true SSD dominance over platter drives.
ATTO Baseline Performance
Version and / or Patch Used: 2.34
ATTO is used by many disk manufacturers to determine the read and write speeds that will be presented to customers.

OCZ Vertex 2 E, 60GB

OCZ Vertex 2, 100GB

OCZ Vertex 2 E, 120GB

OCZ Vertex 2 E, 240GB
We are off to a really good start. It is like dejà vu over and over with these performance numbers. All of the drives even share the same 4K High IOPS firmware that shows up in ATTO as an additional 40 to 50MB/s in the 4K write test when compared to standard SandForce SF-1200 firmware drives.
ATTO is the industry standard for claimed performance. Here we see that OCZ Technology had it right at least officially with the claimed performance.
Benchmarks - HD Tune Pro
HD Tune Pro
Version and / or Patch Used: 4.00
Developer Homepage: http://www.efdsoftware.com
Product Homepage: http://www.hdtune.com
HD Tune is a Hard Disk utility which has the following functions:
- Benchmark: measures the performance
- Info: shows detailed information
- Health: checks the health status by using SMART
- Error Scan: scans the surface for errors
- Temperature display
HD Tune Pro gives us accurate read, write and access time results and for the last couple of years has been gaining popularity amongst reviewers. It is now considered a must have application for storage device testing.
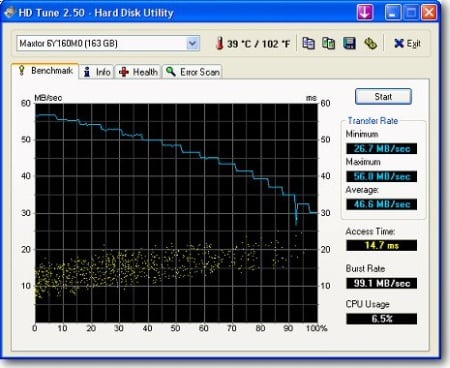
Read Tests

The read speed test had the 60GB starting off a little slow, but only for a split second. The slight dip at first shows up in the minimum category, but the average speed shows that the slight stumble was very brief. Instead of a stumble it was more like tripping over an ant. Aside from that everything is looking good across the board.
Write Tests

The write speed test was quite a bit different. Here we see the 60GB drive running into an issue. Let's look at the actual graphs from the run and compare the 60GB to the 240GB that shares the same firmware revision.

OCZ Vertex 2 E, 60GB

OCZ Vertex 2 E, 240GB
To be honest, I really didn't expect this since the word around the internet water cooler is that the 60GB is just as fast as the larger drives. That said, this is exactly why I wanted to test and write this article.
Here we see that the two drives peak at nearly the exact same spot; the problem is that the minimum and average write speed across the disk is much lower on the 60GB model. With all of the drives being tested in the same sequence and this being the second test that I ran, there was zero chance of the 60GB drive being in anything other than a new state. All drives were also tested fresh out of the sealed retail package.
What will be interesting is if a real world performance drop can be found in significant tests. We have seen SSDs stumble in HD Tune's Write Test before due to the cache filling up, but perform very well in real world tests. The difference here is that the SF-1200 does not use a DRAM cache buffer. This may be a clue into unraveling the inner workings of a controller that SandForce can be pretty tight lipped about.
Let's press on and see what we can find out from the synthetics and then see how everything pans out in real world tests.
Benchmarks - Everest Random Access Time
Everest Random Access Time
Version and / or Patch Used: 4.60
Developer Homepage: http://www.lavalys.com
Product Homepage: http://www.lavalys.com
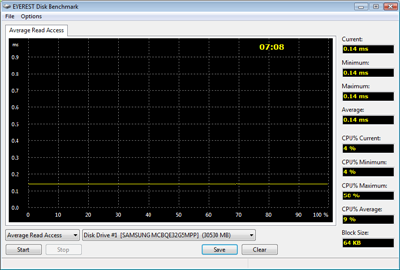
Everest Ultimate and Corporate Edition offer several different benchmarks for testing and optimizing your system or network. The Random Access test is one of very few if not only that will measure hard drives random access times in hundredths of milliseconds as oppose to tens of milliseconds.
Drives with only one or two tests displayed in write the write test mean that they have failed the test and their Maximum and possibly their Average Scores were very high after the cached fills. This usually happens only with controllers manufactured by JMicron.
Read Tests

SSD manufacturers always get a big kick out of seeing their access times compared to platter drives. Here we see the fastest consumer platter drive on the market and the only 10K RPM consumer series, the Western Digital VelociRaptor. The 10K RPM part is a bit important since it is what gives the VR such low access times for a platter drive.
Aside from the serious ass kicking we see the Vertex 2 drives dishing out here, we are trying to focus our attention elsewhere. Notice the scaling that happens when looking at the chart from bottom to top. Here we see read access times cut nearly in half from the smallest to the largest in the test. The two middle drives offer us perfect markers in between even though the 100 and 120GB drives are physically identical.
Write Tests

The write access test shows nearly identical performance for the Vertex 2 drives.
If you were wondering why I don't like including platter drives in my SSD performance charts, this is why. The platter drives really minimize the differences between the SSDs. Then again, we are measuring SSDs in thousands of a second; how much more minimal can it really get?
Benchmarks - Crystal Disk Mark
CrystalDiskMark
Version and / or Patch Used: 3.0 Technical Preview
Developer Homepage: http://crystalmark.info
Product Homepage: http://crystalmark.info/software/CrystalDiskMark/index-e.html
Download here: http://crystaldew.info/category/software/crystaldiskmark
CrystalDiskMark is a disk benchmark software.
Key Features:-
* Sequential reads/writes
* Random 4KB/512KB reads/writes
* Text copy
* Change dialog design
* internationalization (i18n)
Note: Crystal Disk Mark 3.0 is not available to the public yet, but the Technical Preview does allow us to test 4K performance at queue depths of 4 and 32 in addition to 1. The current release Crystal Disk Mark only shows us QD 1.
Read Tests

Here we are looking at 4K performance and 4K at two different queue depths. The SF-1200 is an 8 channel controller with 2 bit lanes. Only one is active at a time, but we still see great scaling with NCQ.
Everything is nearly identical until we get to the 4K: QD32 test. Here we see the 60GB Vertex 2 step up and hit one out of the ball park while the other drives were hitting triples.
NCQ is working on the VR, but with 4K numbers like that can you really consider a 1.5MB/s increase progress when compared to the SandForce SF-1200?
Write Tests

The write test shows identical performance for all of the Vertex 2 drives other than the 60GB model. Here we see what looks to be a brick wall at 100MB/s. Interestingly enough, it is still faster than the Intel X25-M G2 80GB drive.
Benchmarks - PCMark Vantage Hard Disk Tests
PCMark Vantage - Hard Disk Tests
Version and / or Patch Used: 1.0.0
Developer Homepage: http://www.futuremark.com
Product Homepage: http://www.futuremark.com/benchmarks/pcmark-vantage/
Buy It Here
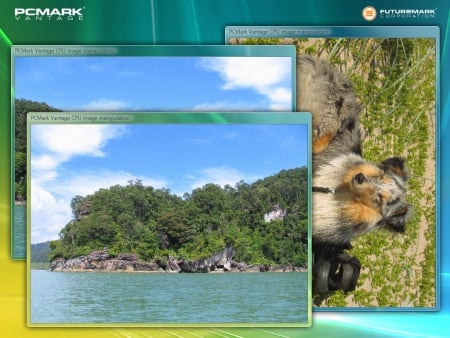
PCMark Vantage is the first objective hardware performance benchmark for PCs running 32 and 64 bit versions of Microsoft Windows Vista. PCMark Vantage is perfectly suited for benchmarking any type of Microsoft Windows Vista PC from multimedia home entertainment systems and laptops to dedicated workstations and high-end gaming rigs. Regardless of whether the benchmarker is an artist or an IT Professional, PCMark Vantage shows the user where their system soars or falls flat, and how to get the most performance possible out of their hardware. PCMark Vantage is easy enough for even the most casual enthusiast to use yet supports in-depth, professional industry grade testing.
FutureMark has developed a good set of hard disk tests for their PCMark Vantage Suite. Windows users can count on Vantage to show them how a drive will perform in normal day to day usage scenarios. For most users these are the tests that matter since many of the old hat ways to measure performance have become ineffective to measure true Windows performance.

HDD1 - Windows Defender
HDD2 - Gaming
HDD3 - Windows Photo Gallery
HDD4 - Vista Startup
HDD5 - Windows Movie Maker
HDD6 - Windows Media Center
HDD7 - Windows Media Player
HDD8 - Application Loading
Every time I get to this point of a review or article I start to hear big bass drums pounding in the back of my mind. The moment of truth for most Windows desktop users for their day-to-day activities, the stuff everyone uses the most.
I am on the verge of calling this one inconclusive since the 100 and 120GB drives are running different firmware than the 60 and 240GB drives. We can still analyse the 60 and 240GB performance on their own since they are full retail products with retail firmware.
With that in mind, the only test that we saw a significant difference in was the Windows Media Center Test and it actually shows the 60GB model running the test a bit faster. Since we are talking about real world, inside of Windows with overhead numbers above 200 MB/s in some cases a 5% margin of error goes a long way. My determination is that in Windows while running day-to-day tasks that there is little to no performance decrease with a smaller capacity Vertex 2.
Staying at the bottom end of the chart, we see the smallest Vertex 2 outperforming the X25-M G2 80GB SSD in all tests, many by a significant margin. Now let's set the Intel aside and look at the VelociRaptor 600GB and how it compares with the 60GB Vertex 2.
Doubters of SSDs pull up a chair and take a look. My favourite test to look at in this series is the top, dark blue bar. This is application loading, like when you double click on an icon and the speed in which your drive is able to read all of those little files that need to be opened to get things going. The Vertex 2 E 60GB can do around 191MB/s due to its ability to rip through those small files like a fresh razor blade through paper. The dinosaur on the other hand takes a bit longer to do the same task; when I say a bit I mean more than 180MB/s difference. If that didn't send a picture through your head, then how about in black and white; 191 to 9. If you are a sports fan then try to link for clarification.
If I went on and on about it for 10 pages, it would still not even compare.
Benchmarks - AS SSD
AS SSD Benchmark
Version and / or Patch Used: 1.2.3577.40358
Developer Homepage: Alex Intelligent Software
Product Homepage: Alex Intelligent Software
Download here: http://www.alex-is.de/PHP/fusion/downloads.php?cat_id=4&download_id=9
AS determines the performance of Solid State Drives (SSD). The tool contains four synthetic as well as three practice tests. The synthetic tests are to determine the sequential and random read and write performance of the SSD. These tests are carried out without the use of the operating system caches.
In all synthetic tests the test file size is 1GB. AS can also determine the access time of the SSD, the access of which the drive is determined to read through the entire capacity of the SSD (Full Stroke). The write access test is only to be met with a 1 GB big test file. At the end of the tests three values for the read and write as well as the overall performance will be issued. In addition to the calculated values which are shown in MB/s, they are also represented in IO per seconds (IOPS).
Note: AS SSD is a great benchmark for many tests, but since Crystal Disk Mark covers a broader range of 4K tests and HD Tune Pro covering sequential speeds, we will only use the Copy Benchmark from AS SSD.
- Copy Benchmark

The write speed difference of the 60GB capacity Vertex 2 E does show up in the copy tests. We have seen SandForce drives lost out to some other SSDs in these tests because of the way SandForce drives handle compressed data. In some ways the SF-1200's strongest feature is also its biggest detractor, but only in some situations where data is already compressed.
For the last few months I have spent a great deal of time pondering over just how much compressed data is kept on a smaller drive. With smaller drives you will keep less music, movies and compressed files since the space is just not available to keep much of that data to begin with.
Benchmarks - Passmark
Passmark Advanced Multi-User Tests
Version and / or Patch Used: 6.1
Developer Homepage: http://www.passmark.com
Test Homepage: http://www.passmark.com
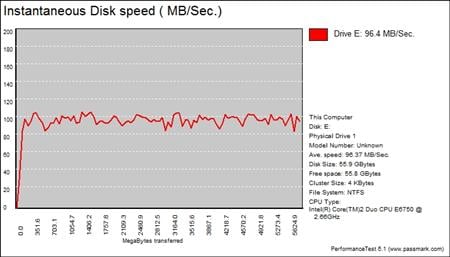
Many users complain that I/O Meter is too complicated of a benchmark to replicate results so my quest to find an alternative was started. Passmark has added several multi-user tests that measure a hard drives ability to operate in a multi-user environment.
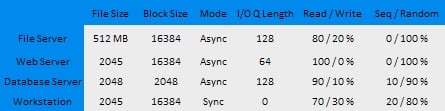
The tests use different settings to mimic basic multi-user operations as they would play out on your server. Variances is read / write percentage as well as random / sequential reads are common in certain applications, Web Servers read nearly 100% of the time while Database Servers write a small amount of data.
The Workstation test is the only single user environment and will be similar to how you use your system at home.
The server tests show near equal performance across the board. Looking at the bottom of the chart, we see why it has been predicted that enterprise SSDs will replace enterprise HDDs at a rate of 10 to 1 in 2010.
Final Thoughts
In the synthetic tests we see that the smaller SandForce drives see a small performance reduction, but once we get into real world tests any reduction to speed is minimal thanks to SandForce's outstanding controller. The one area that does show a weakness for the smallest capacity Vertex 2 was where the SF-1200 is the weakest and that is when dealing with data that is already compressed. Oddly enough this is also the kind of data that should not be on a drive this small to begin with since at 60GB you are mainly looking to install your OS and programs while leaving your media content on another, much larger drive.
The largest reasonable priced SandForce SF-1200 controlled drive is the 240GB version. My Digital Discount currently has what should be regarded as the best in class Vertex 2 E 240GB available now for 619.99. This version is a beast with all around performance and the capacity to be used as the only drive in your system. With your OS and a few games, Office and other necessaries installed, you will still have a ton of room for music, movies and anything else you like to keep around at all times. Business travelers looking for high speed and high capacity should take to the Vertex 2 E 240GB quite well, but I think most enthusiasts will find the cost to be a little out of their range still.
Today we saw a few things that are note worthy. The first is that the Vertex 2, no matter the capacity is faster than the Intel X25-M by quite a large margin in many tests. The Vantage test that produces performance numbers for many of our typical day to day activates really drives this point home.
We also saw today that the fastest consumer platter drive in the world that is appropriately named after a dinosaur can be considered one as well. Western Digital will never be able to push this drive to mainstream users due to cost. That leaves enthusiasts and power users, but these groups are looking for ultimate performance and at this stage the best performance doesn't come with rotating parts. I am still a bit blown away by the application load test in Vantage where the Vertex 2 drives just belittle the latest VelociRaptor.
So here is the final tally. My Digital Discount does to other e-tailers what the Vertex 2 does the VelociRaptor. Their business model has them moving drives in volume just like the Vertex 2 does data. This is an outstanding way to do things with this economic climate since everyone is looking to save money where ever they can. No one wants to the guy without an SSD, so MDD is where you can get your drive and save a few bucks on it, too.
The prices are 60GB (184.99), 120GB (344.99) and 240GB (649.99). OCZ Technology has sweetened the deal with a 20 Dollar mail in rebate for the 60GB model (after MIR price 164.99), 25 Dollar MIR for the 120GB (after MIR price 319.99) and 30 Dollar MIR for the 240GB (after MIR price 619.99). Where do you need to go to get it? RIGHT HERE! - You will not find a better deal, that is at the link. Click it while supplies last!
Personally I recommend the 120GB capacity drive for 319.99. It is the fastest drive in the group and has enough space for both desktop and notebook users. The price point is right around where most of us spend on new component hardware and the drive will make any system, even an older one feel and act faster.
 United
States: Find other tech and computer products like this
over at
United
States: Find other tech and computer products like this
over at  United
Kingdom: Find other tech and computer products like this
over at
United
Kingdom: Find other tech and computer products like this
over at  Australia:
Find other tech and computer products like this over at
Australia:
Find other tech and computer products like this over at  Canada:
Find other tech and computer products like this over at
Canada:
Find other tech and computer products like this over at  Deutschland:
Finde andere Technik- und Computerprodukte wie dieses auf
Deutschland:
Finde andere Technik- und Computerprodukte wie dieses auf  Elgato announces new Neo range that includes plug-and-play Wave, Facecam, Stream Deck, and more
 Meta's next-gen Llama3 LLM is here and the Intel Arc A770 outperforms the GeForce RTX 4060
 Boston Dynamics unveils its next-gen humanoid robot in a very disturbing way
 Turtle Beach unveils redesigned versions of its Stealth Wireless Gaming Headsets
 NASA's Mars helicopter sends heart-warming final message back to Earth
 FlexiSpot C7B-Mesh Ergonomic Office Chair Review
 Samsung G8 34-inch QD-OLED Gaming Monitor Review - 175Hz for $900
 ASRock NUCBOX-155H Mini PC Review
 NuPhy Air96 V2 Wireless Mechanical Keyboard Review
 TEAM T-FORCE Siren DUO360 RGB Liquid CPU Cooler Review
 AVerMedia Live Streamer ULTRA HD Review
 AVerMedia Live Gamer 4K 2.1 Review
 XPG Invader X Mid-Tower Chassis Review
 Intel Core i9-14900KS CPU Review
 Arbiter Polar 65 Magnetic Gaming Keyboard Review
 Everything you need to know about the latest ASUS NUC Mini PCs - NUC 14 Pro and ROG NUC
 How to Overclock Your GPU and Boost Your PC Gaming with ASUS GPU Tweak III
 ASUS's AMD Radeon RX 7000 Series GPU lineup has something for every gamer
 ASUS OLED Premium Care defends the ROG Swift OLED PG32UCDM gaming monitor from burn-in
 Patriot Viper Xtreme 5 Engineering Prototype 48GB Dual-Channel Memory Kit Preview